
Breaking Down the Balance Sheet
The Fed saw a reduction in its balance sheet of $177M. The majority of this was actually in Treasuries with less than 1-year maturity, totaling $102B. The next biggest reduction was in loans, totaling $40B.
MBS fell short of the $35B reduction target yet again, seeing only $17.6B roll off the balance sheet.
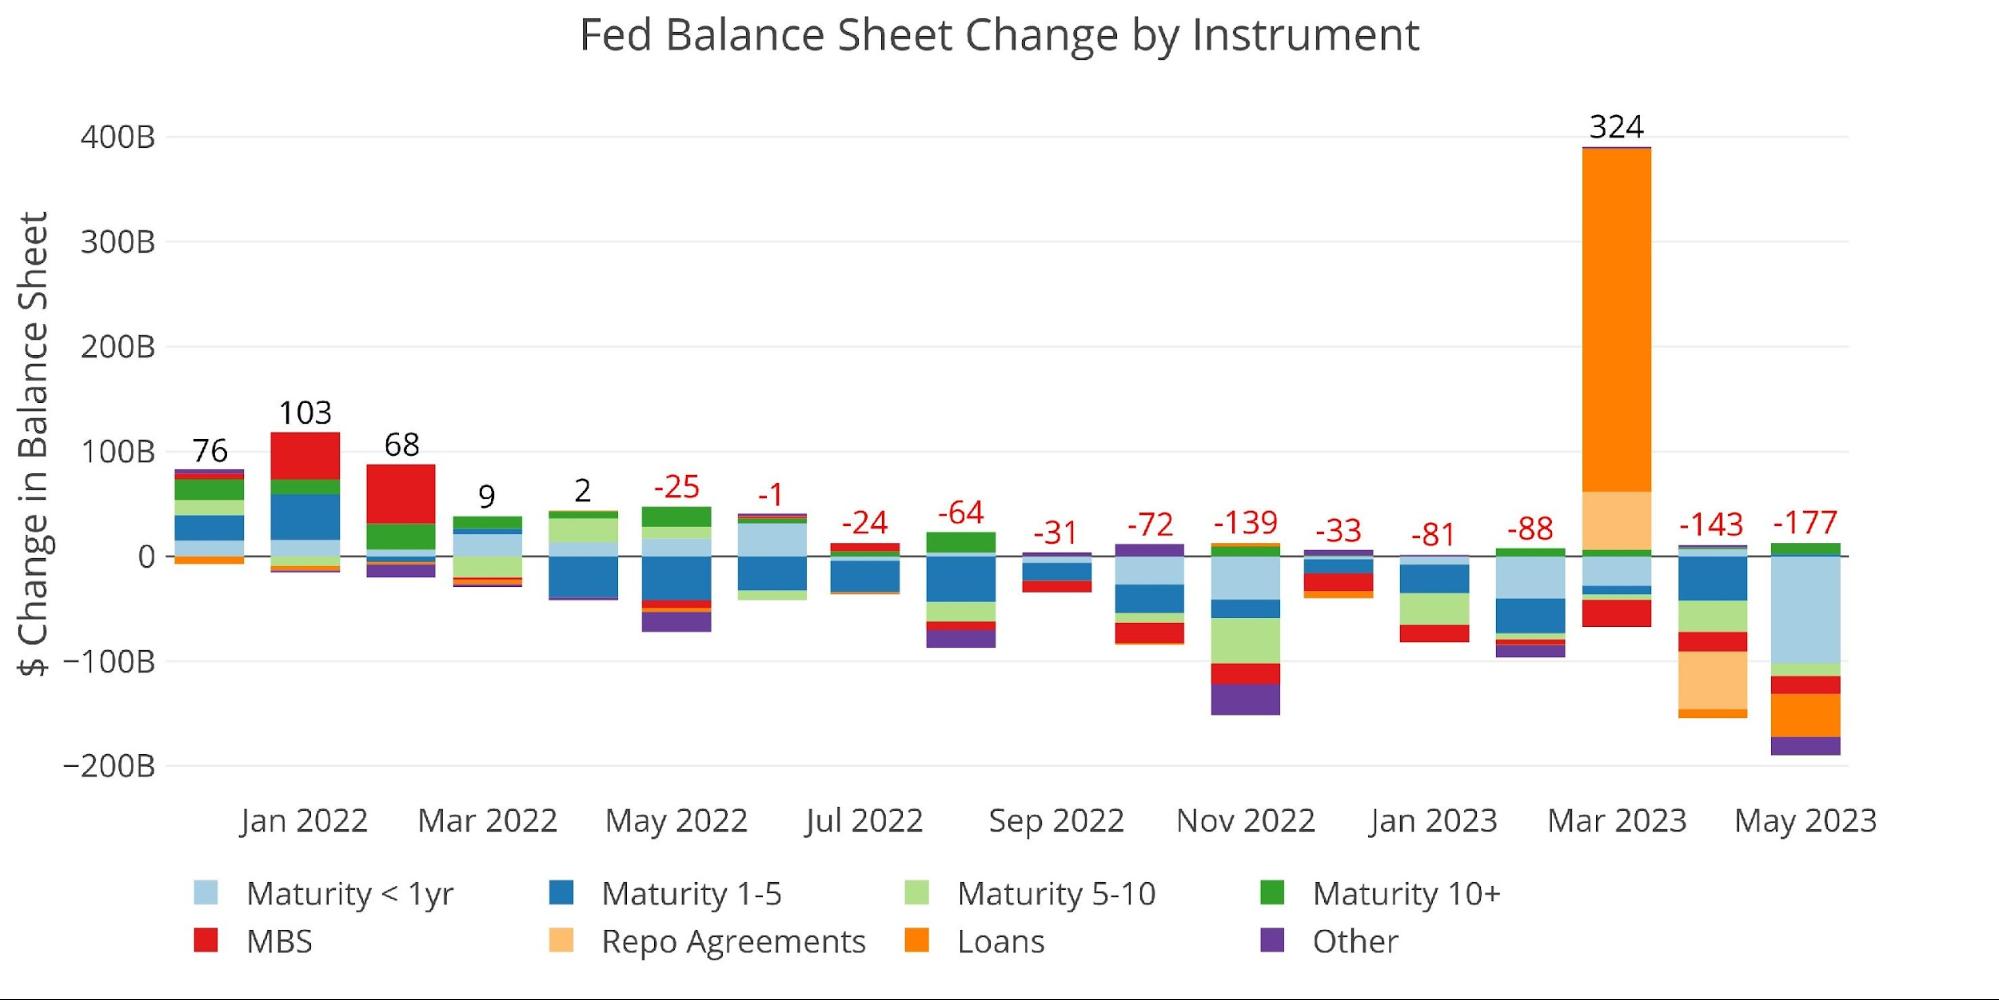
Figure: 1 Monthly Change by Instrument
The table below provides more detail on the Fed’s QT efforts.
-
- Treasuries saw a net reduction of $101.3B which greatly exceeded the $65B target.
- MBS continues the streak of never reaching the monthly reduction target.
- Loans and Repo Agreements have gone quiet as things have settled down.
The big reduction in short-term treasuries could be for many reasons, but it is likely tied to the debt ceiling. With the treasury not issuing any new debt, it could simply be harder to replace this debt as it rolls off. The Fed works closely with the Treasury so they may want to keep liquidity flowing in the short-term debt market. The Fed could accomplish this by not rolling over its TBill debt.
As the Treasury gears up to issue a ton more debt in the months ahead, the last thing they want is any disruption to the market in TBills. TBills are extremely liquid, easy to sell, and critical when the Treasury is issuing a ton of debt. Expect a ton of new issuance in the months ahead similar to what happened in the wake of the massive Covid stimulus.
Whether the Fed is opening its balance sheet now to help with absorbing the debt later or simply keeping liquidity in the market, the market is clearly aware of what’s coming. Players have been building up huge short positions in treasuries in anticipation of the deluge of new debt to come.
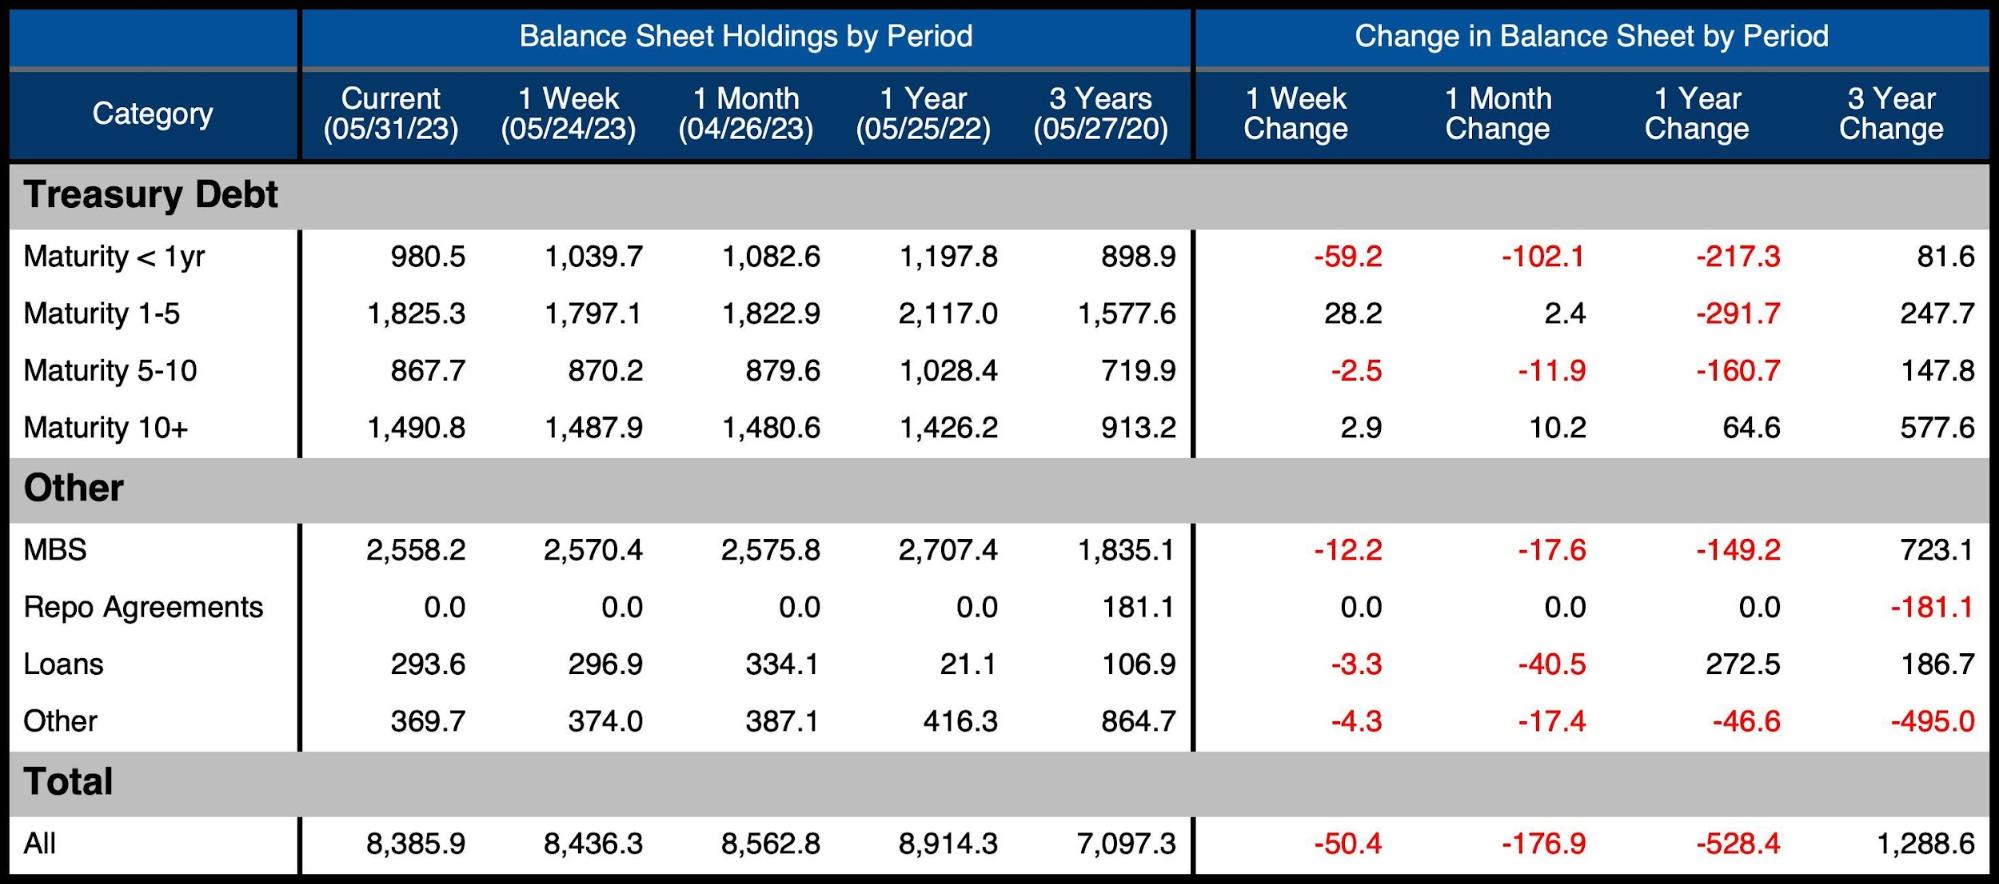
Figure: 2 Balance Sheet Breakdown
The weekly activity can be seen below. It shows that a big move in TBills happened in the latest week ($60B), right before the debt deal was reached.
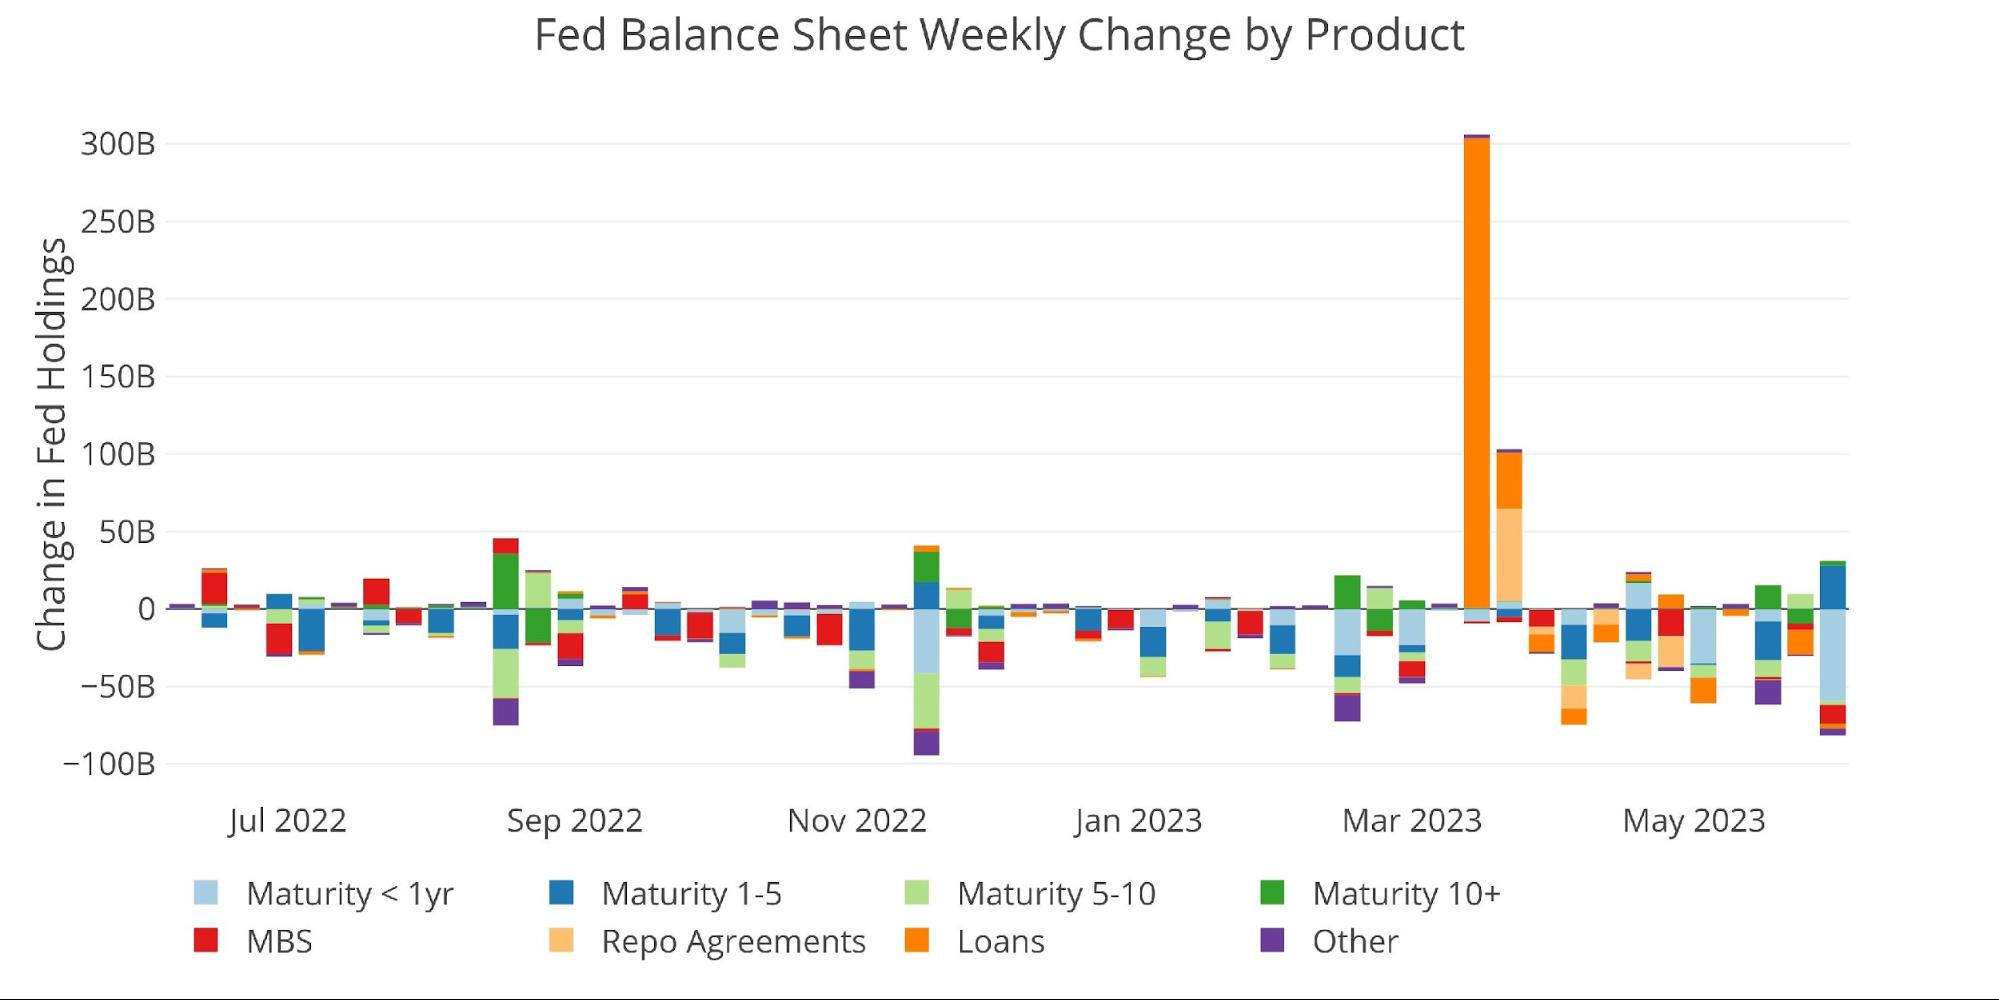
Figure: 3 Fed Balance Sheet Weekly Changes
The chart below shows the balance on detailed items in Loans and also Repos. Primary Credit has dropped down close to zero, but the Bank Term Funding Program (BTFP) continues to see new all-time highs, suggesting that there is still trouble beneath the surface. Other Credit Extensions also remain elevated.
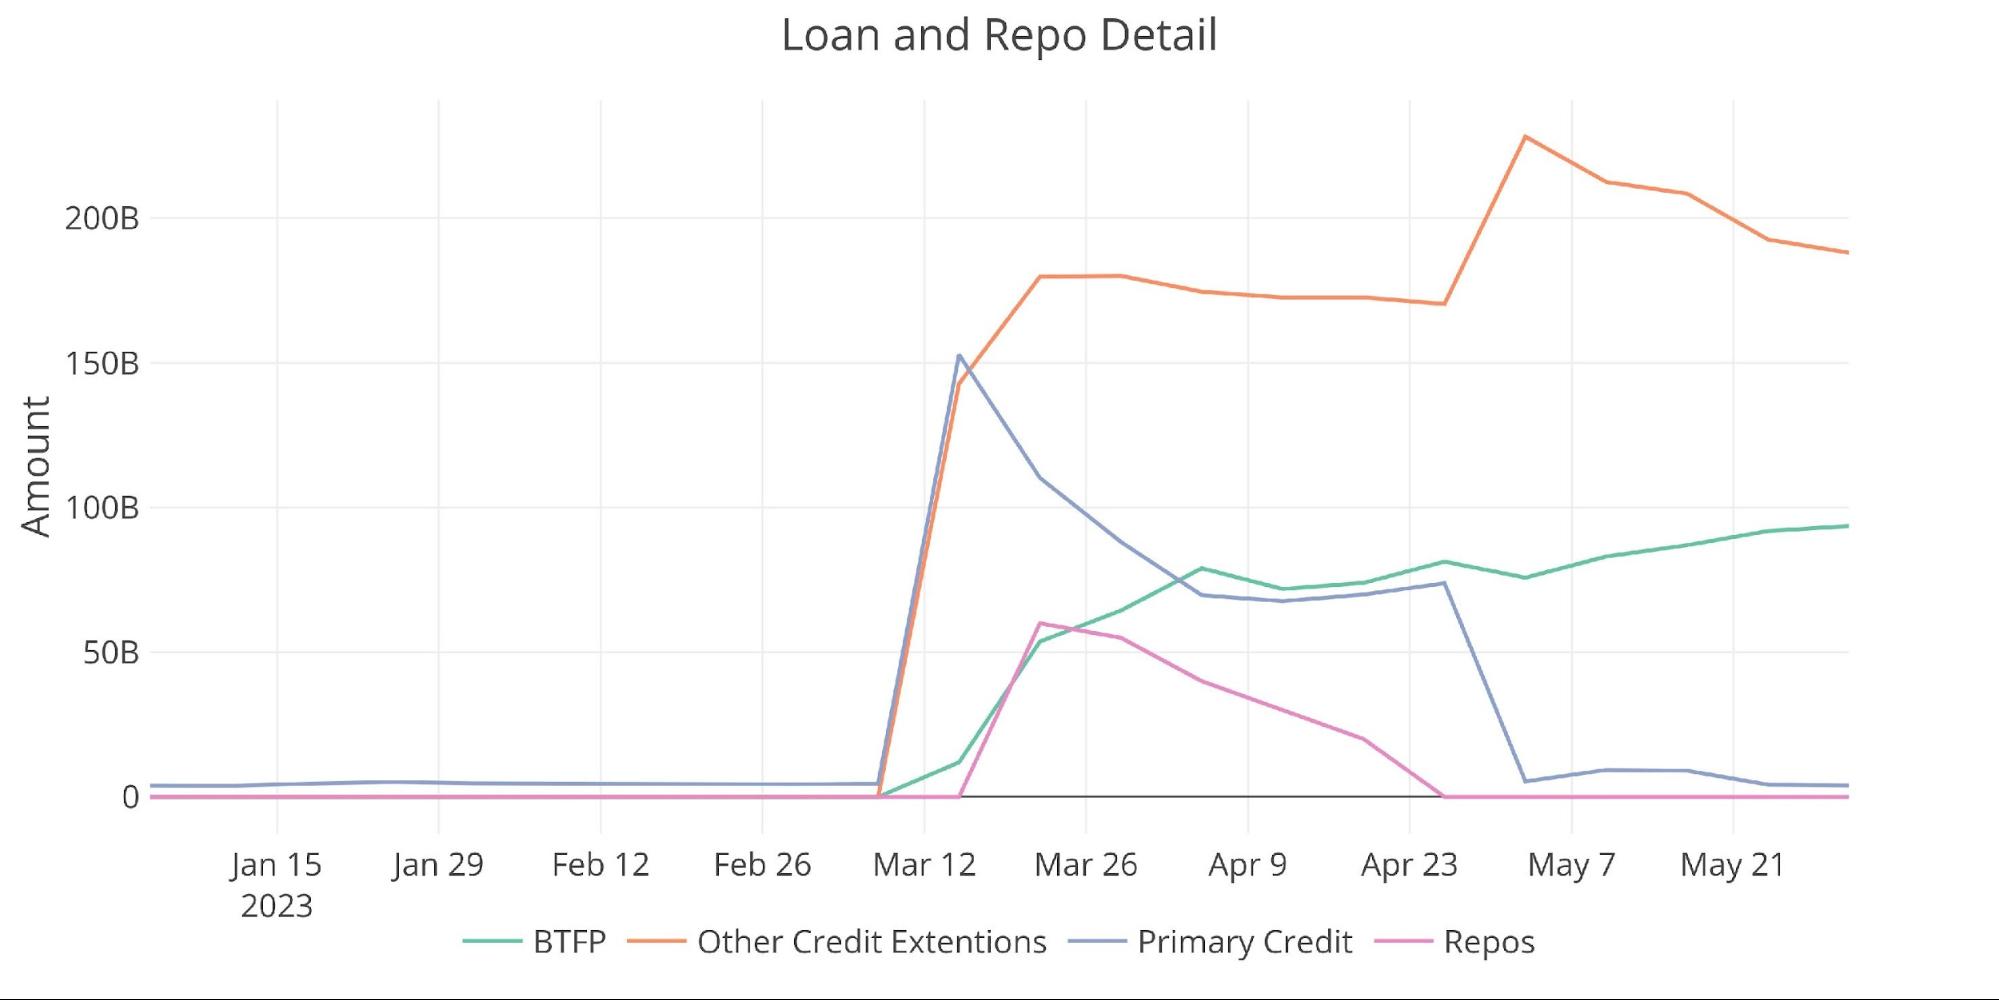
Figure: 4 Loan Details
Yields
Yields have climbed back up in recent weeks. As mentioned above, some of this could be driven by the build-in shorts in the Treasury market from traders anticipating large issuance in the coming months.
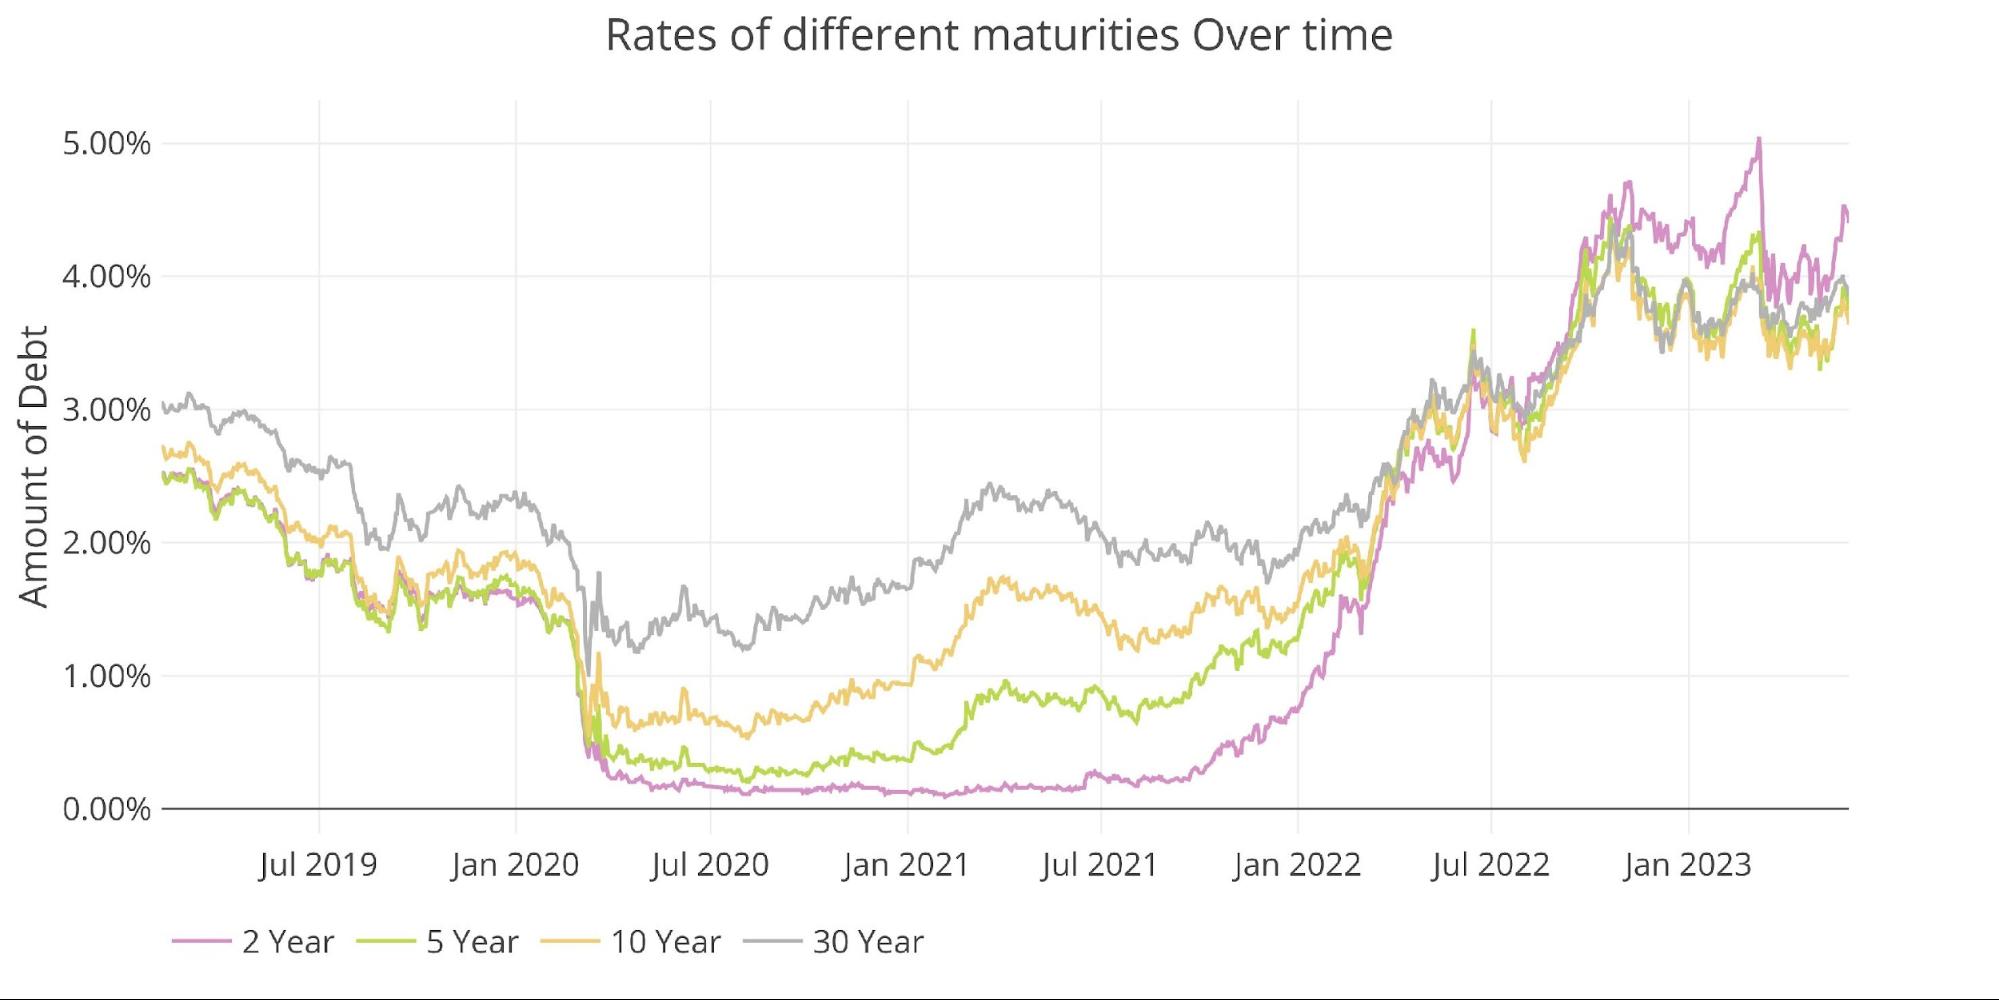
Figure: 5 Interest Rates Across Maturities
The yield curve remains deeply inverted at -77bps. It had recovered to -38bps in early May, but has since turned back down. This still suggests the market is pricing in a high risk of recession.
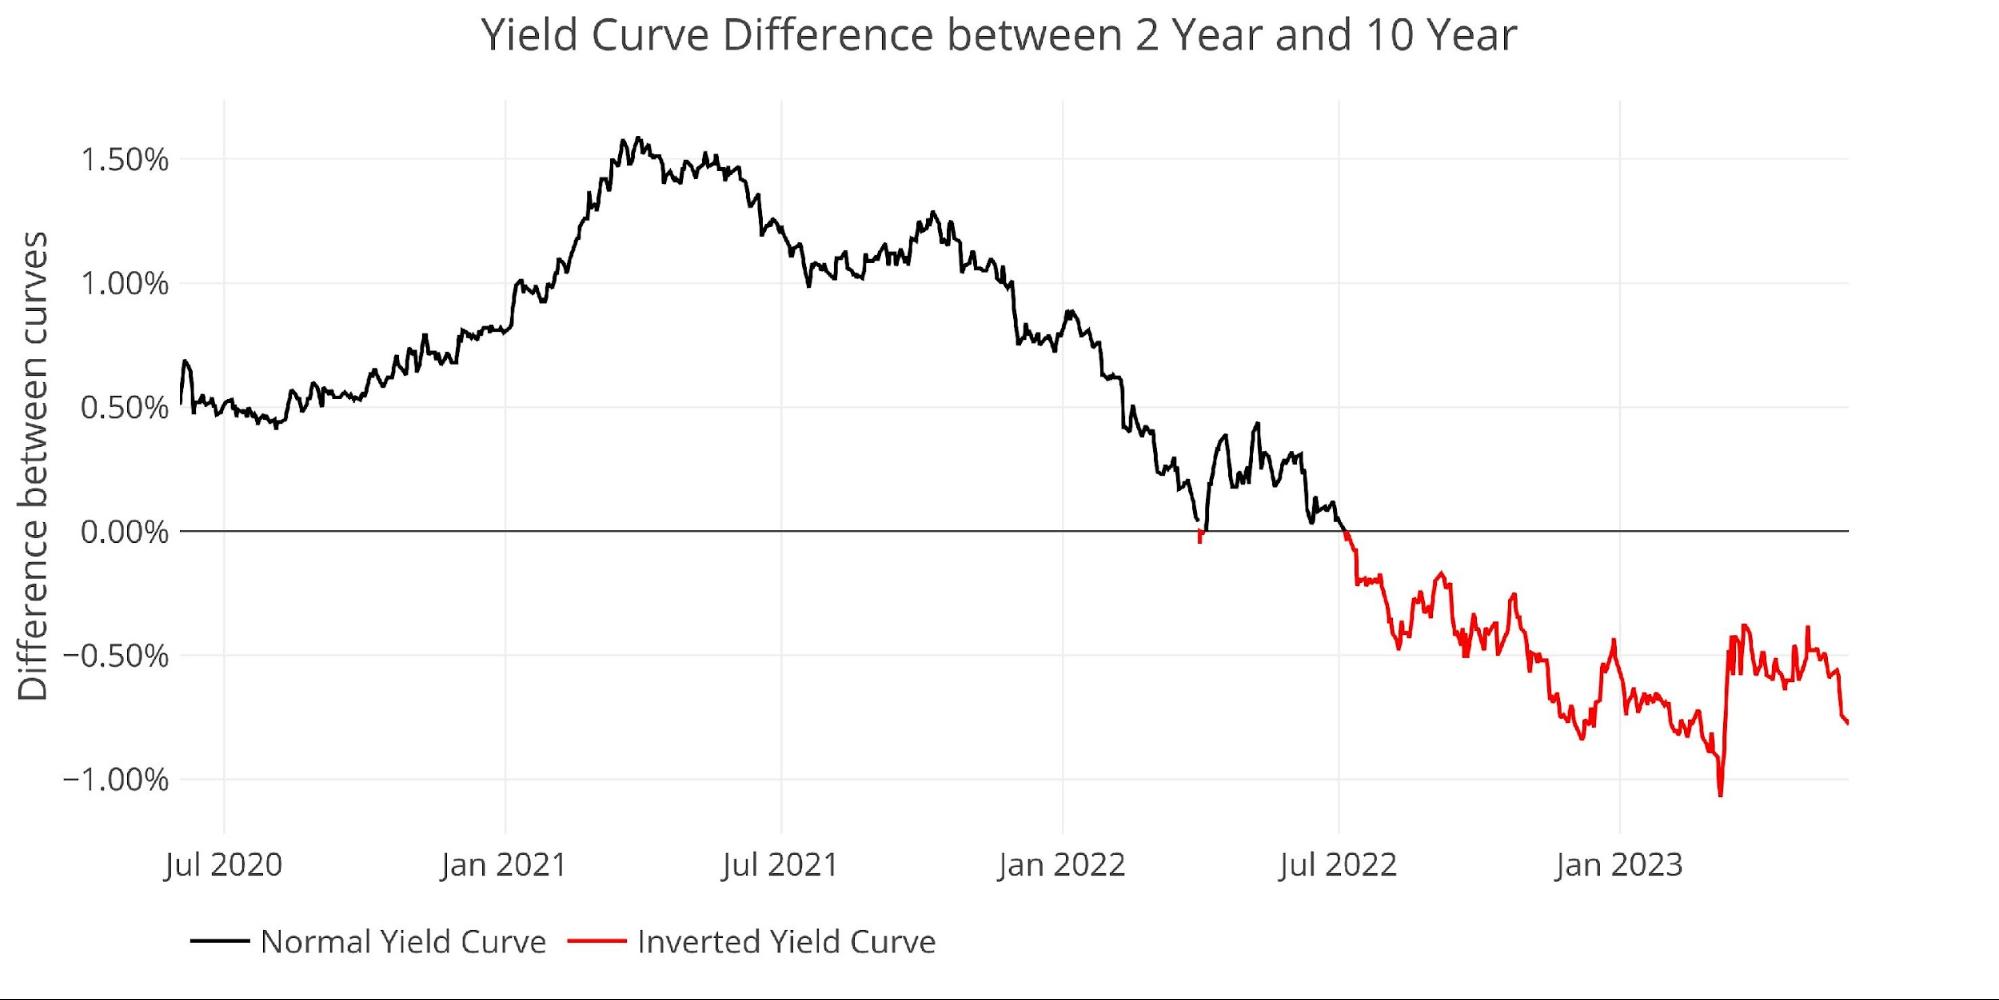
Figure: 6 Tracking Yield Curve Inversion
The chart below shows the current yield curve, the yield curve one month ago, and one year ago. The entire yield curve is higher than it was one month ago even though it remains inverted. The rise in rates will only further exacerbate the Federal Budget issues as interest on the debt continues to explode higher.
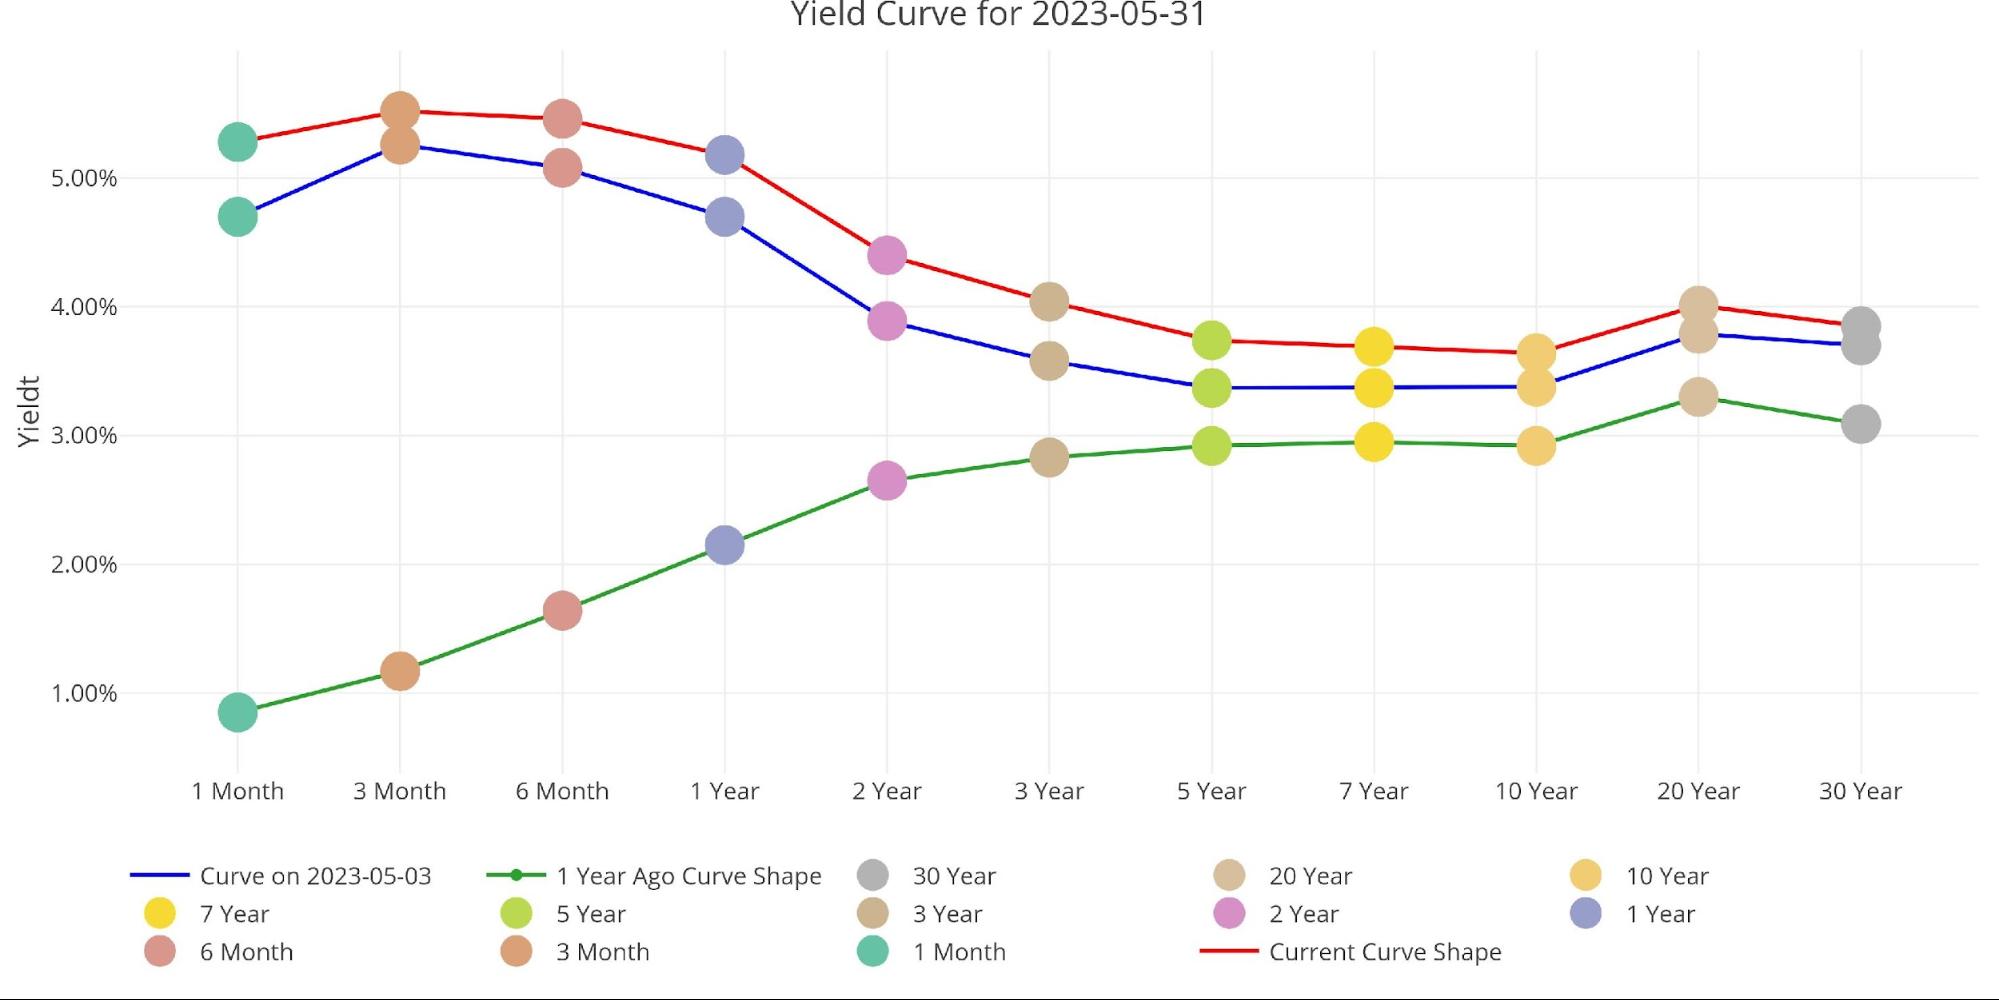
Figure: 7 Tracking Yield Curve Inversion
The Fed Takes Losses
The Fed has recently accumulated about $65B in total losses. This is driven by two factors:
-
- Similar to SVB, it is selling assets (under QT) that are now worth less than when they bought them
- The interest paid out to banks (5%+) is greater than the interest it receives from its balance sheet (2%)
When the Fed makes money, it sends it back to the Treasury. This has netted the Treasury close to $100B a year. This can be seen below.
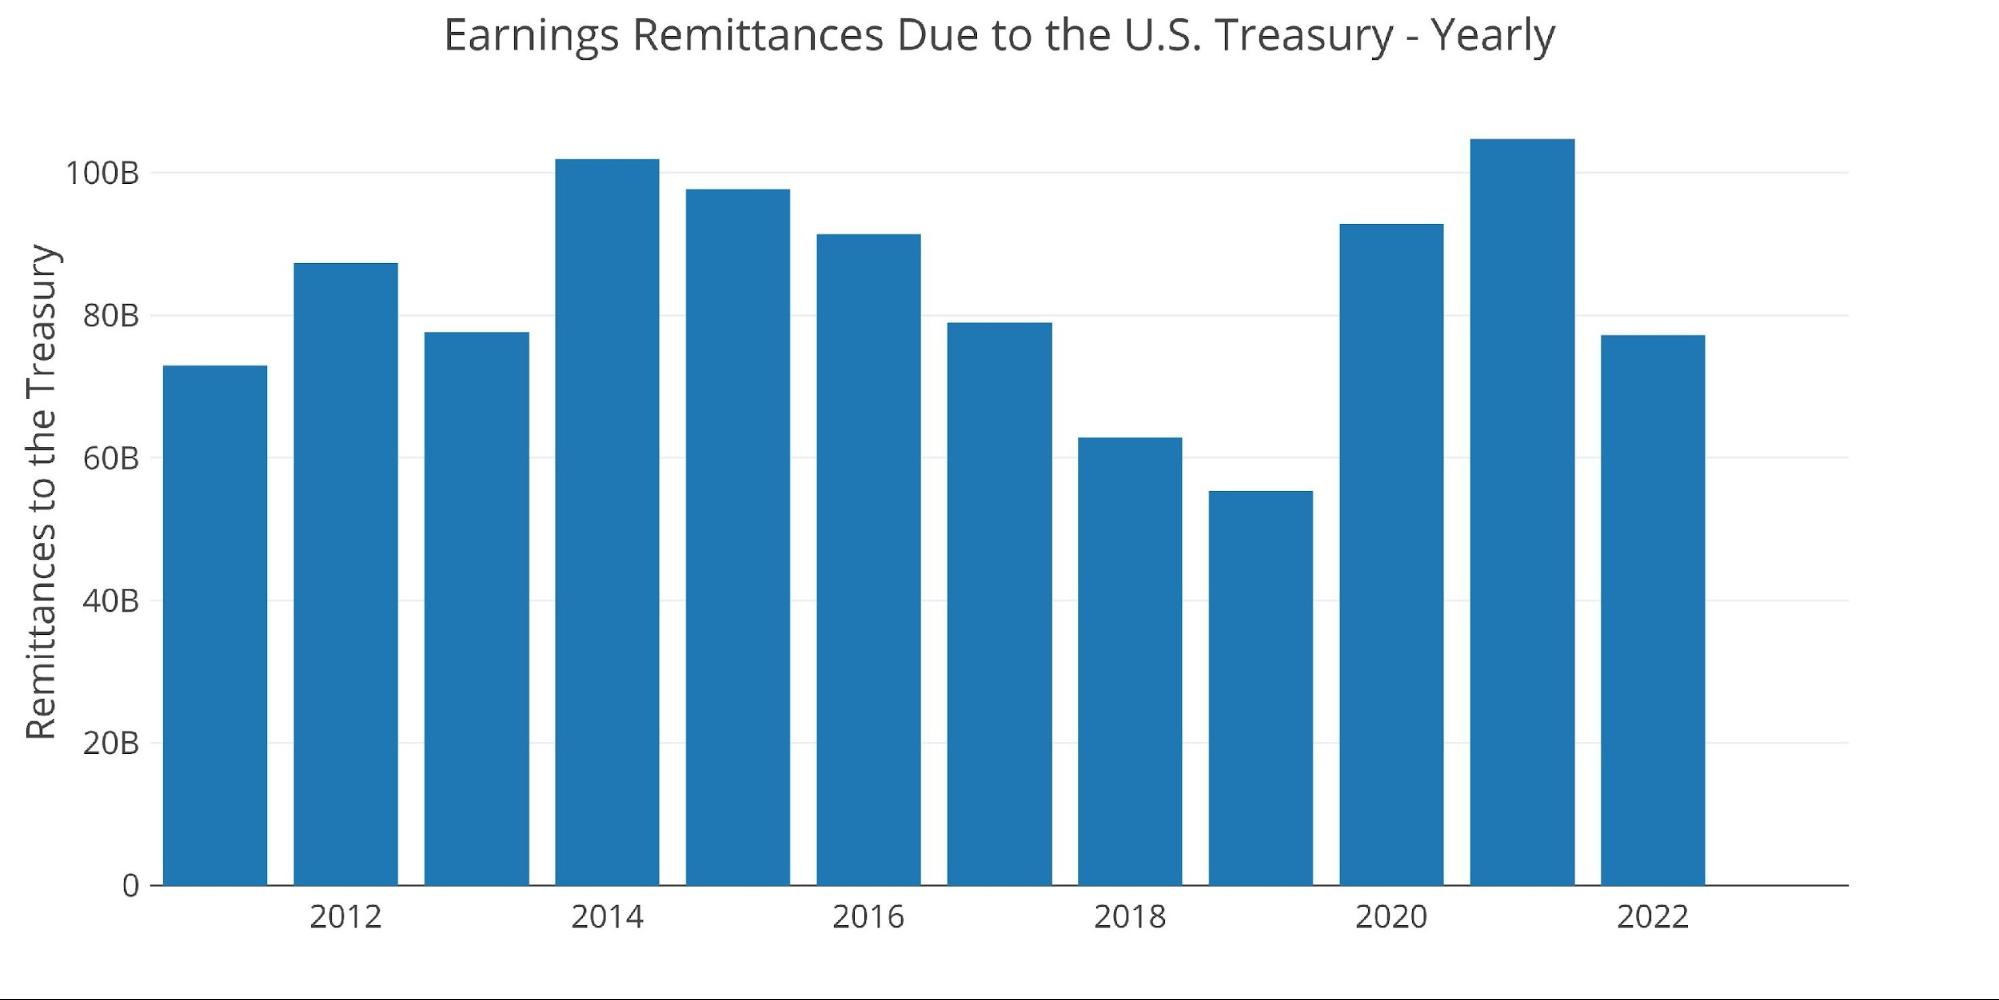
Figure: 8 Fed Payments to Treasury
You may notice in the chart above that 2023 is showing $0. That’s because the Fed is losing money this year. According to the Fed: The Federal Reserve Banks remit residual net earnings to the U.S. Treasury after providing for the costs of operations… Positive amounts represent the estimated weekly remittances due to U.S. Treasury. Negative amounts represent the cumulative deferred asset position … deferred asset is the amount of net earnings that the Federal Reserve Banks need to realize before remittances to the U.S. Treasury resume.
Basically, when the Fed makes money, it gives it to the Treasury. When it loses money, it keeps a negative balance by printing the difference. That negative balance has just exceeded $65B! This negative balance is increasing by more than $10B a month!
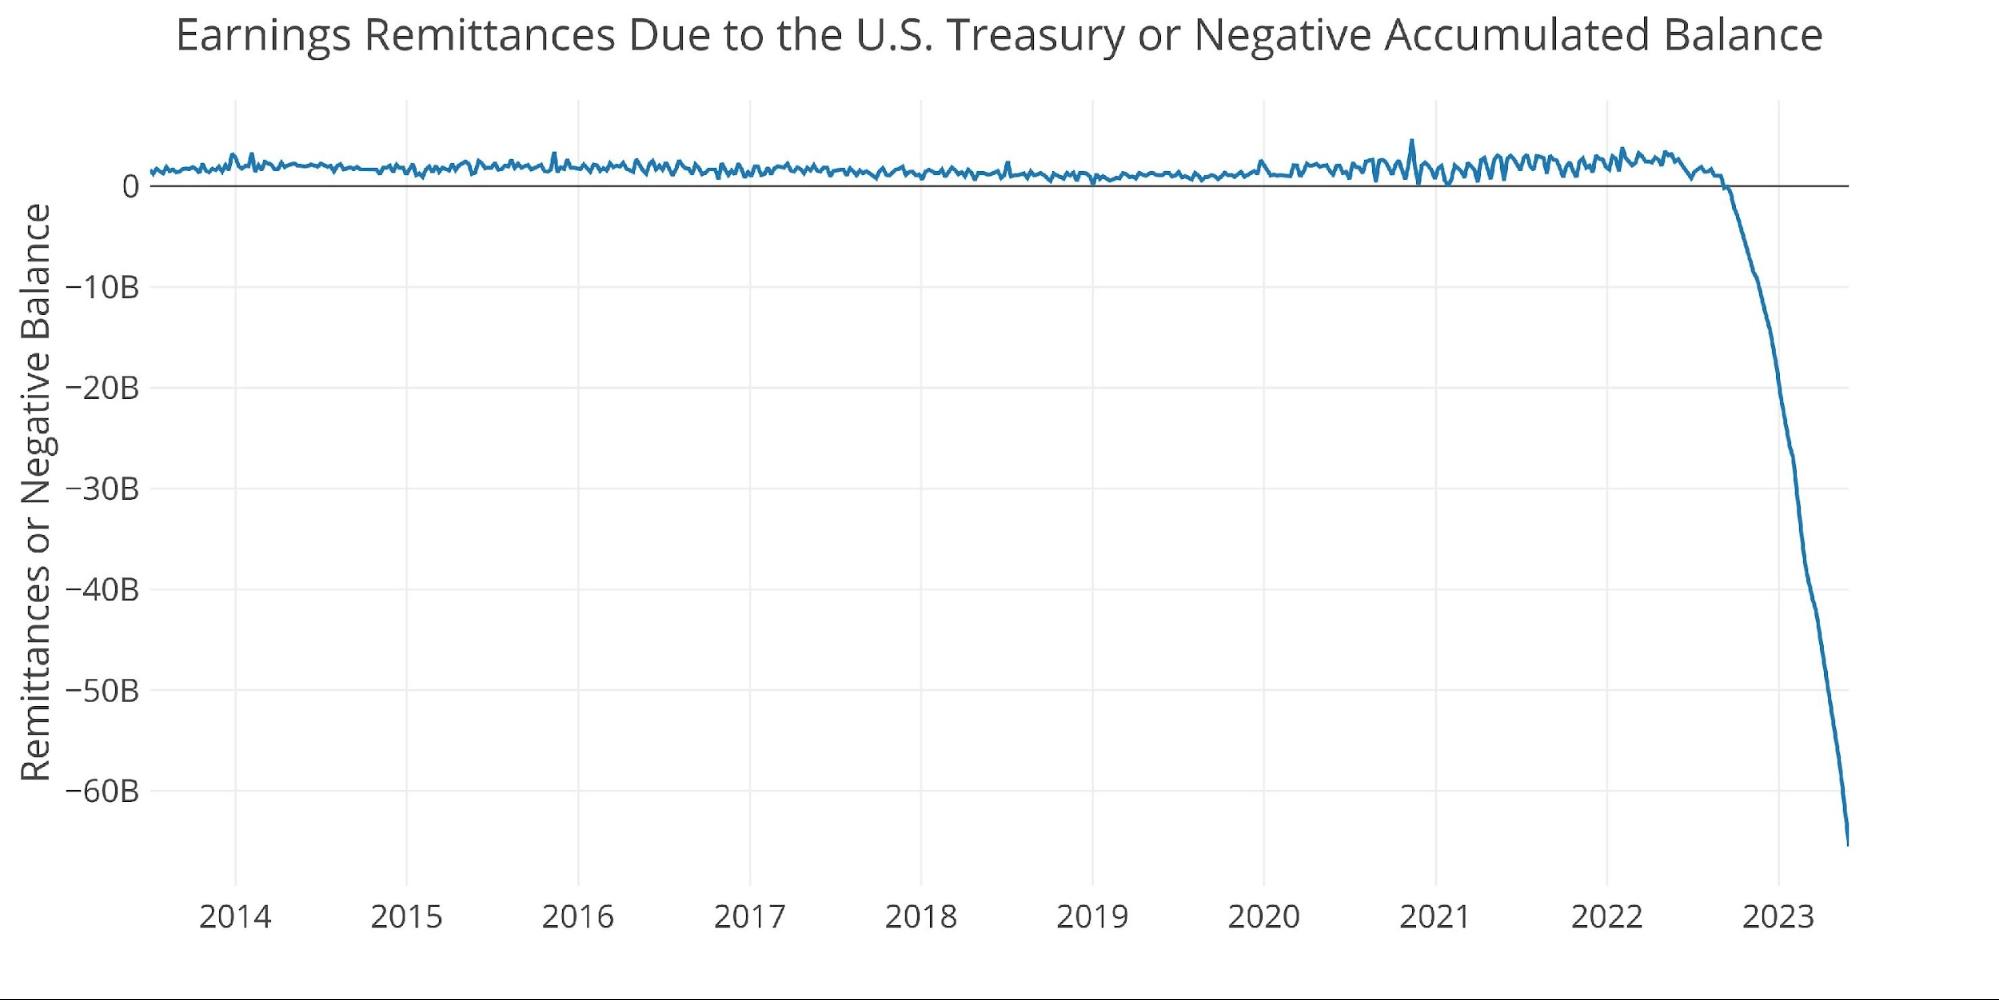
Figure: 9 Remittances or Negative Balance
Note: these charts are a correction to earlier articles that aggregated the Fed’s negative balance, overstating the losses.
Who Will Fill the Gap?
The Fed has been absent from the Treasury market for over a year. The debt ceiling has kept debt issuance low for the last several months, but now that the debt ceiling has been suspended for the next few years, there will be a ton of new issuance. Who will absorb all the new debt? If the Fed sticks to QT, then they will only add to the selling pressure in the market.
International holdings have been stagnant since July 2021 at around $7.5T. With the Treasury set to issue $2T a year combined with the Fed selling $65B a month, that is a lot of debt for the market to absorb. The shorts in the Treasury market have a lot of reason to feel confident… until the Fed steps in as they always have to be the lender of last resort.
Note: data is updated on a lag. The latest data is as of March.
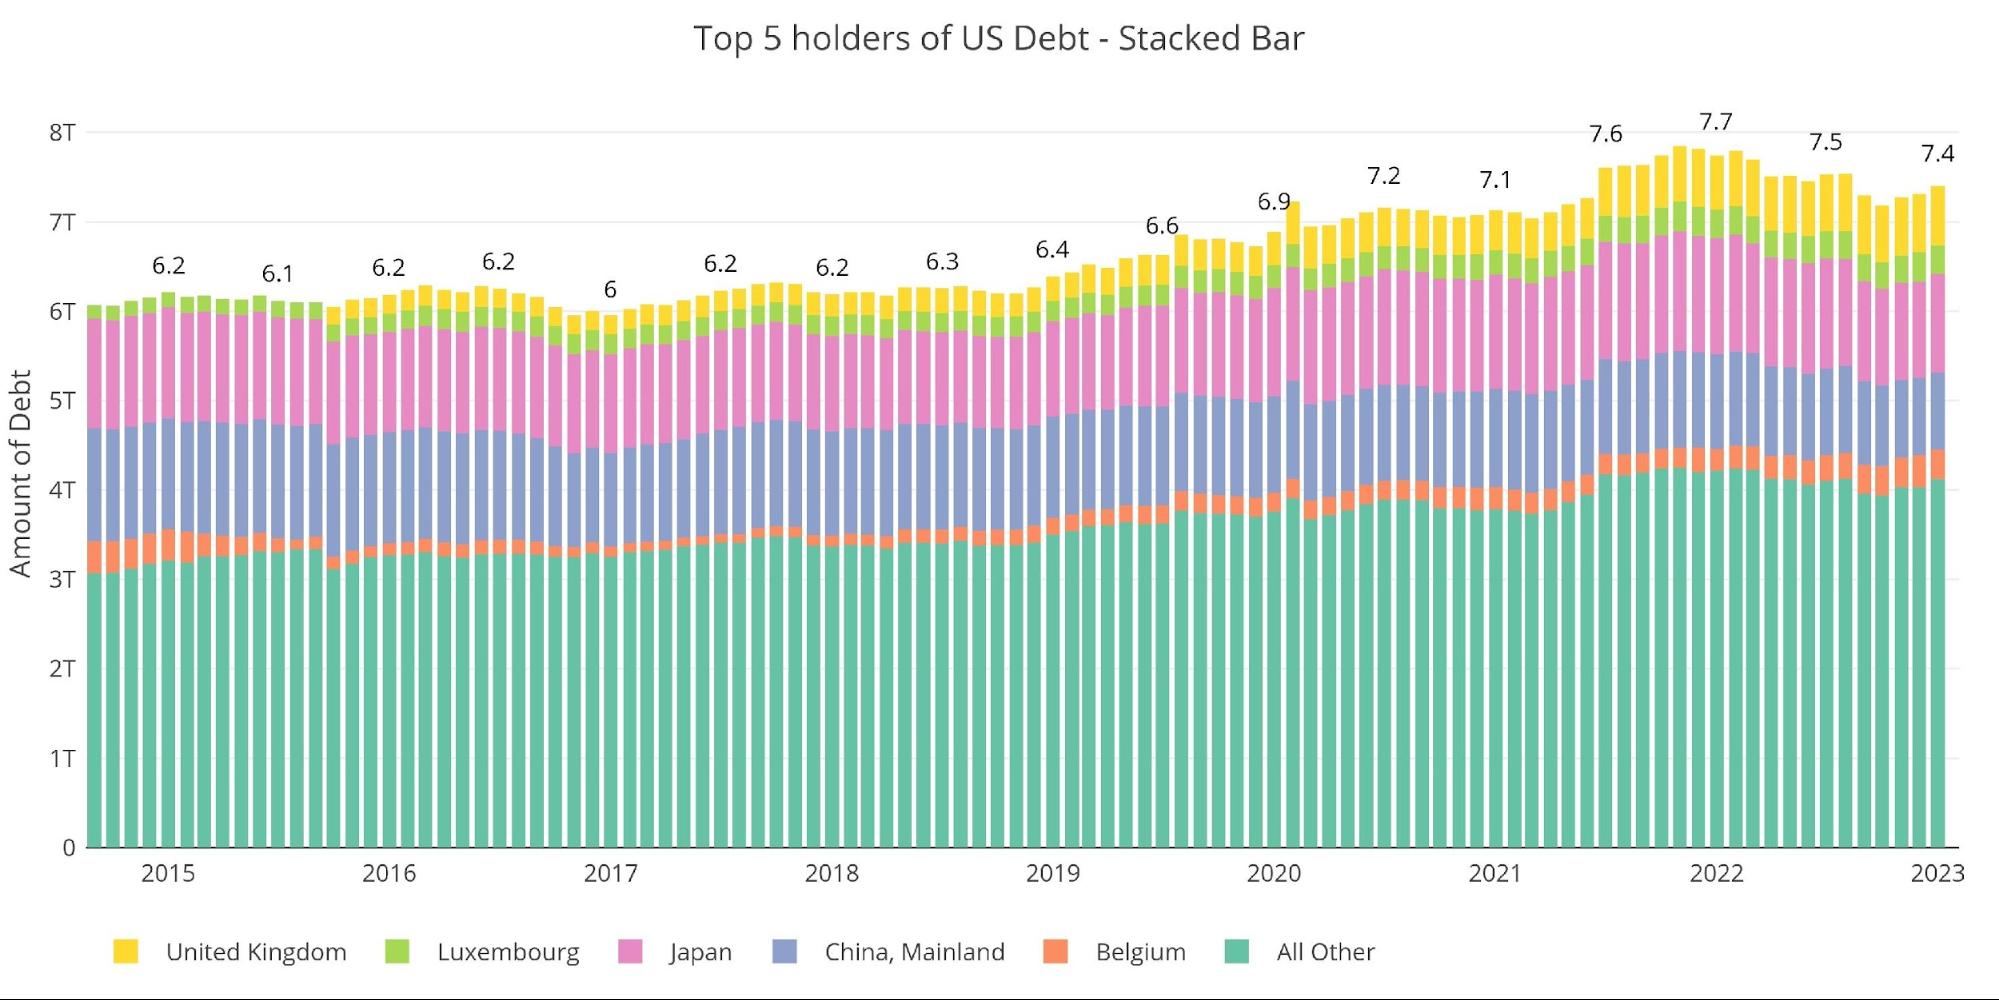
Figure: 10 International Holders
It should be noted that both China and Japan (the largest international holders of Treasuries) have been reducing Treasury holdings. China is now below $900B in total holdings with Japan dropping down to almost $1T.
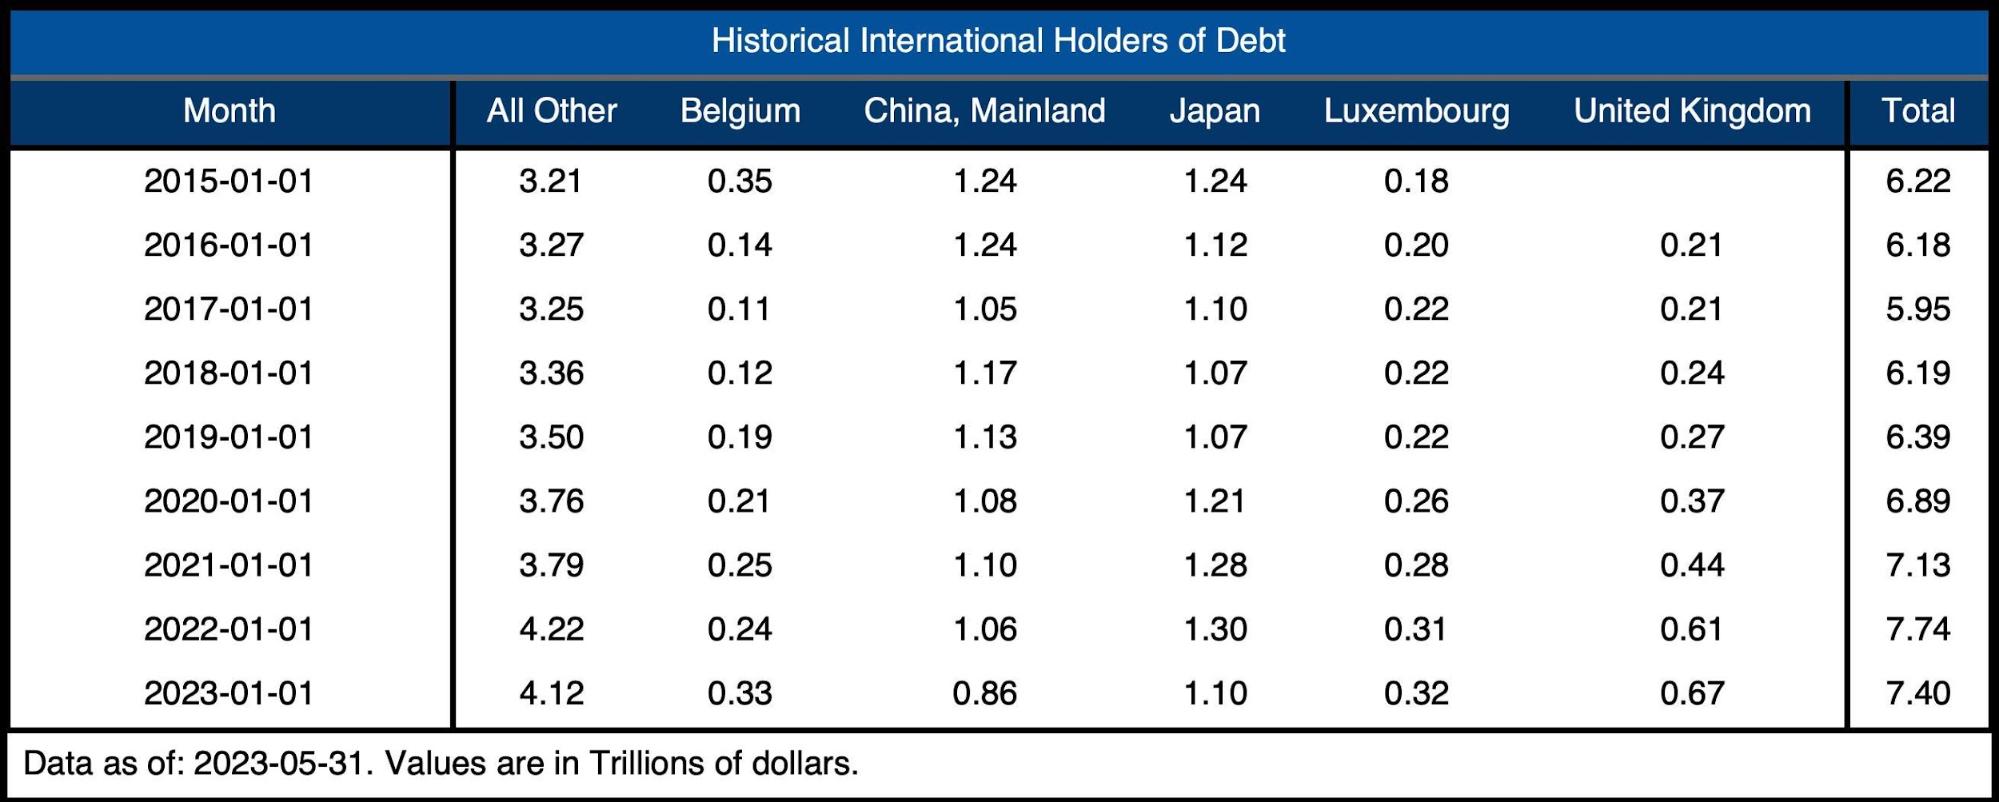
Figure: 11 Average Weekly Change in the Balance Sheet
Historical Perspective
The final plot below takes a larger view of the balance sheet. It is clear to see how the usage of the balance sheet has changed since the Global Financial Crisis.
The recent moves by the Fed in the wake of the SVB collapse can also be seen below. When the next break in the economy occurs, it’s likely that the balance sheet will spike again.
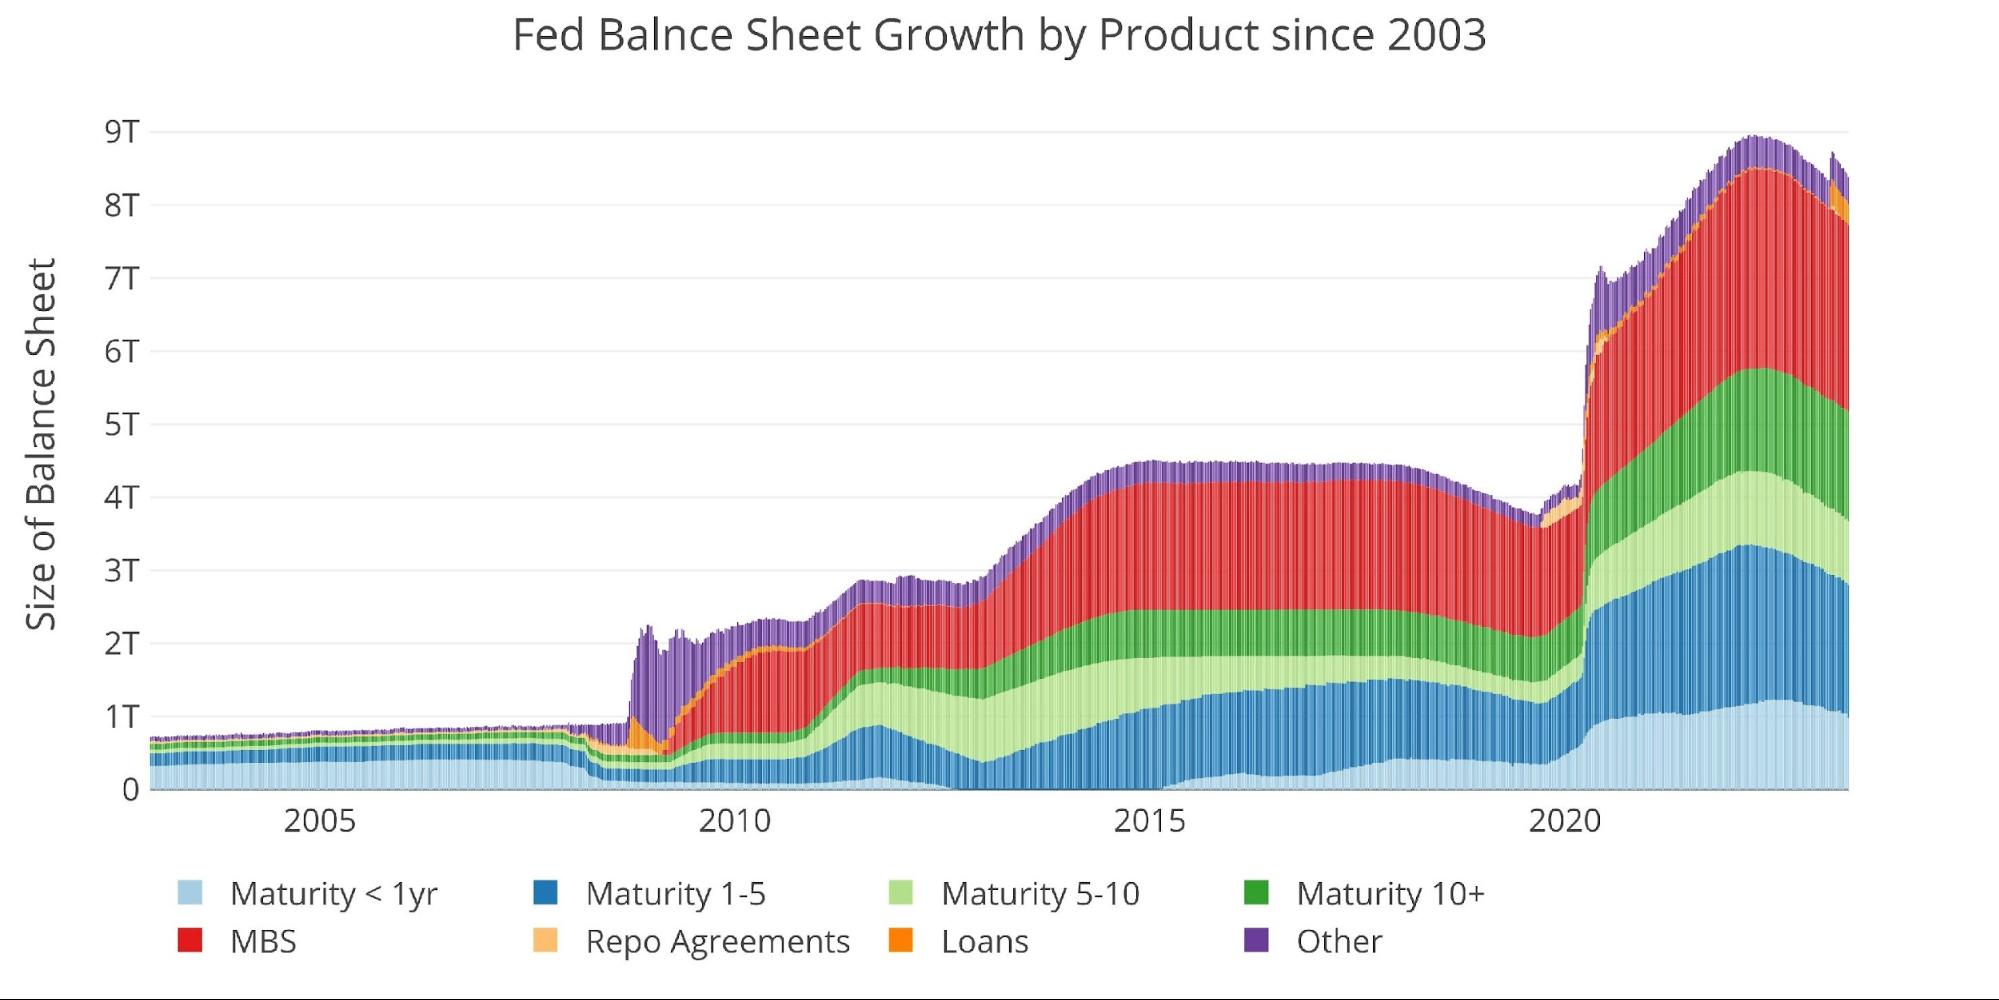
Figure: 12 Historical Fed Balance Sheet
Wrapping up
The debt ceiling has actually been helpful for the Fed as the Treasury has not had to issue any new debt. This has meant much lower amounts of debt hitting the market. That relief is now coming to an end as the debt ceiling has been suspended. With the Treasury set to flood the market, the Fed might not be able to stay on the sideline for too much longer.
The Fed will have to step in to provide liquidity to this market. The Treasury is simply issuing too much debt and the interest expense has exploded higher. The Fed can only ignore the math for so long before it is forced to pivot.
Data Source: https://fred.stlouisfed.org/series/WALCL and https://fred.stlouisfed.org/release/tables?rid=20&eid=840849#snid=840941
Data Updated: Weekly, Thursday at 4:30 PM Eastern
Last Updated: May 31, 2023
Interactive charts and graphs can always be found on the Exploring Finance dashboard: https://exploringfinance.shinyapps.io/USDebt/

Call 1-888-GOLD-160 and speak with a Precious Metals Specialist today!
Buka akaun dagangan patuh syariah anda di Weltrade.
Source link