The CPI rose in March by 0.06%, which was less than expected. That said, as the chart below shows, the fall in Energy prices was entirely responsible for containing an otherwise high CPI.

Figure: 1 Month Over Month Inflation
The YoY CPI shows that Energy is actually negative YoY, helping bring down the annual CPI to 5%. Unfortunately, this is likely a temporary reprieve. The Biden administration burned through the Strategic Petroleum Reserve to help bring energy prices down. Now that over half the reserves have been used for political reasons (rather than strategic), the drop in Energy prices is likely over. This was further confirmed when OPEC announced more cuts in production which will help lift Energy prices.
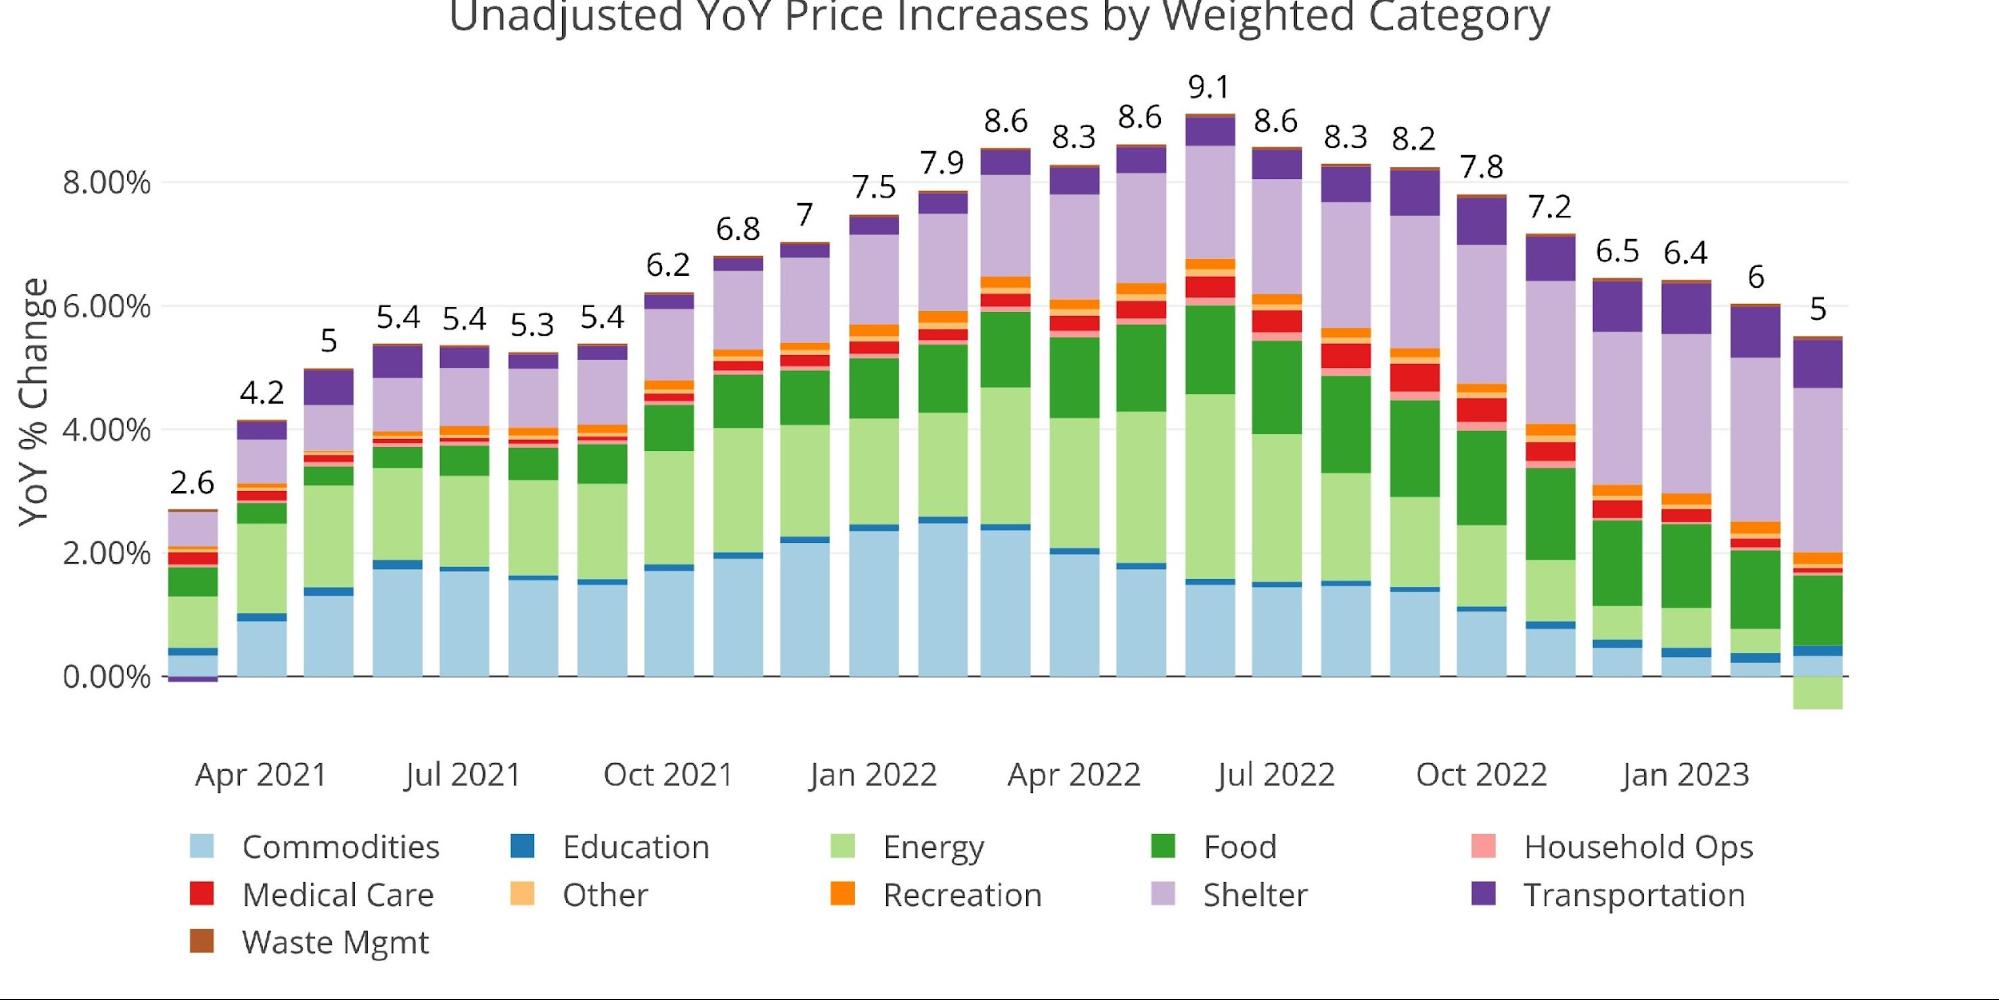
Figure: 2 Year Over Year Inflation
Looking at the 12-month trend shows that 4 categories are actually growing faster than the 12-month average. This will make it hard to bring down the CPI when some categories are still accelerating. Shelter only increased 0.6% compared to the 0.7% average, but this still means the highest weighted component of the CPI at 34.5% is increasing at a 7.4% annual basis.
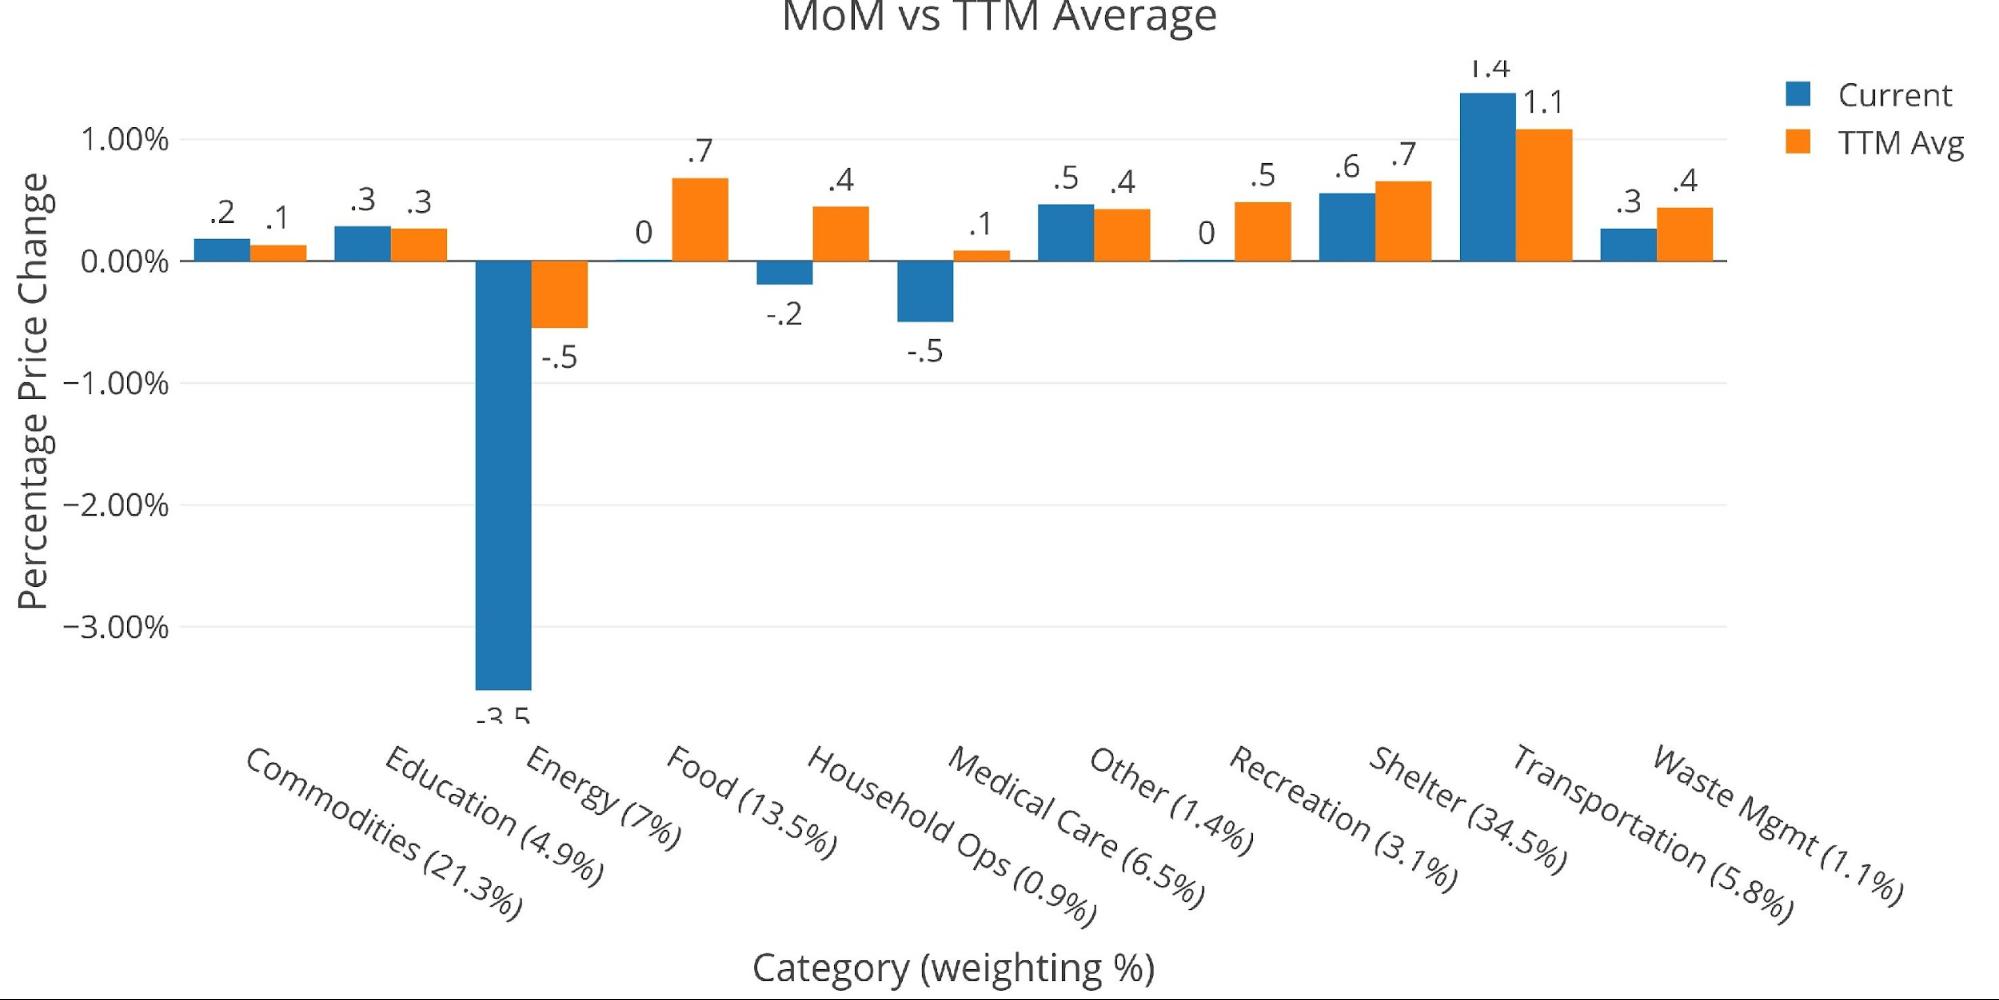
Figure: 3 MoM vs TTM
The table below gives a more detailed breakdown of the numbers. It shows the actual figures reported by the BLS side by side with the recalculated and unrounded numbers. The weighted column shows the contribution each value makes to the aggregated number. Details can be found on the BLS Website.
Some key takeaways:
-
- The Energy component of the CPI brought the headline number down by 0.25%. Had Energy been flat, the CPI would have come in at 0.31, which annualizes to 3.7%.
-
- Considering the changes in OPEC, it’s likely Energy will start pushing the CPI back up!
-
- There are demand concerns given the weakness in the economy, but the busy driving season is also approaching
- Food was flat on the month, but still up 8.5% YoY followed by an 8.8% rise seen last March – an 18% gain in 2 years!
- Transportation was up YoY an incredible 13.8% with Shelter the next largest component at 8.18%
- The Energy component of the CPI brought the headline number down by 0.25%. Had Energy been flat, the CPI would have come in at 0.31, which annualizes to 3.7%.
Looking at the annual numbers by component really shows what the average consumer has experienced over the last year. It is not pretty.
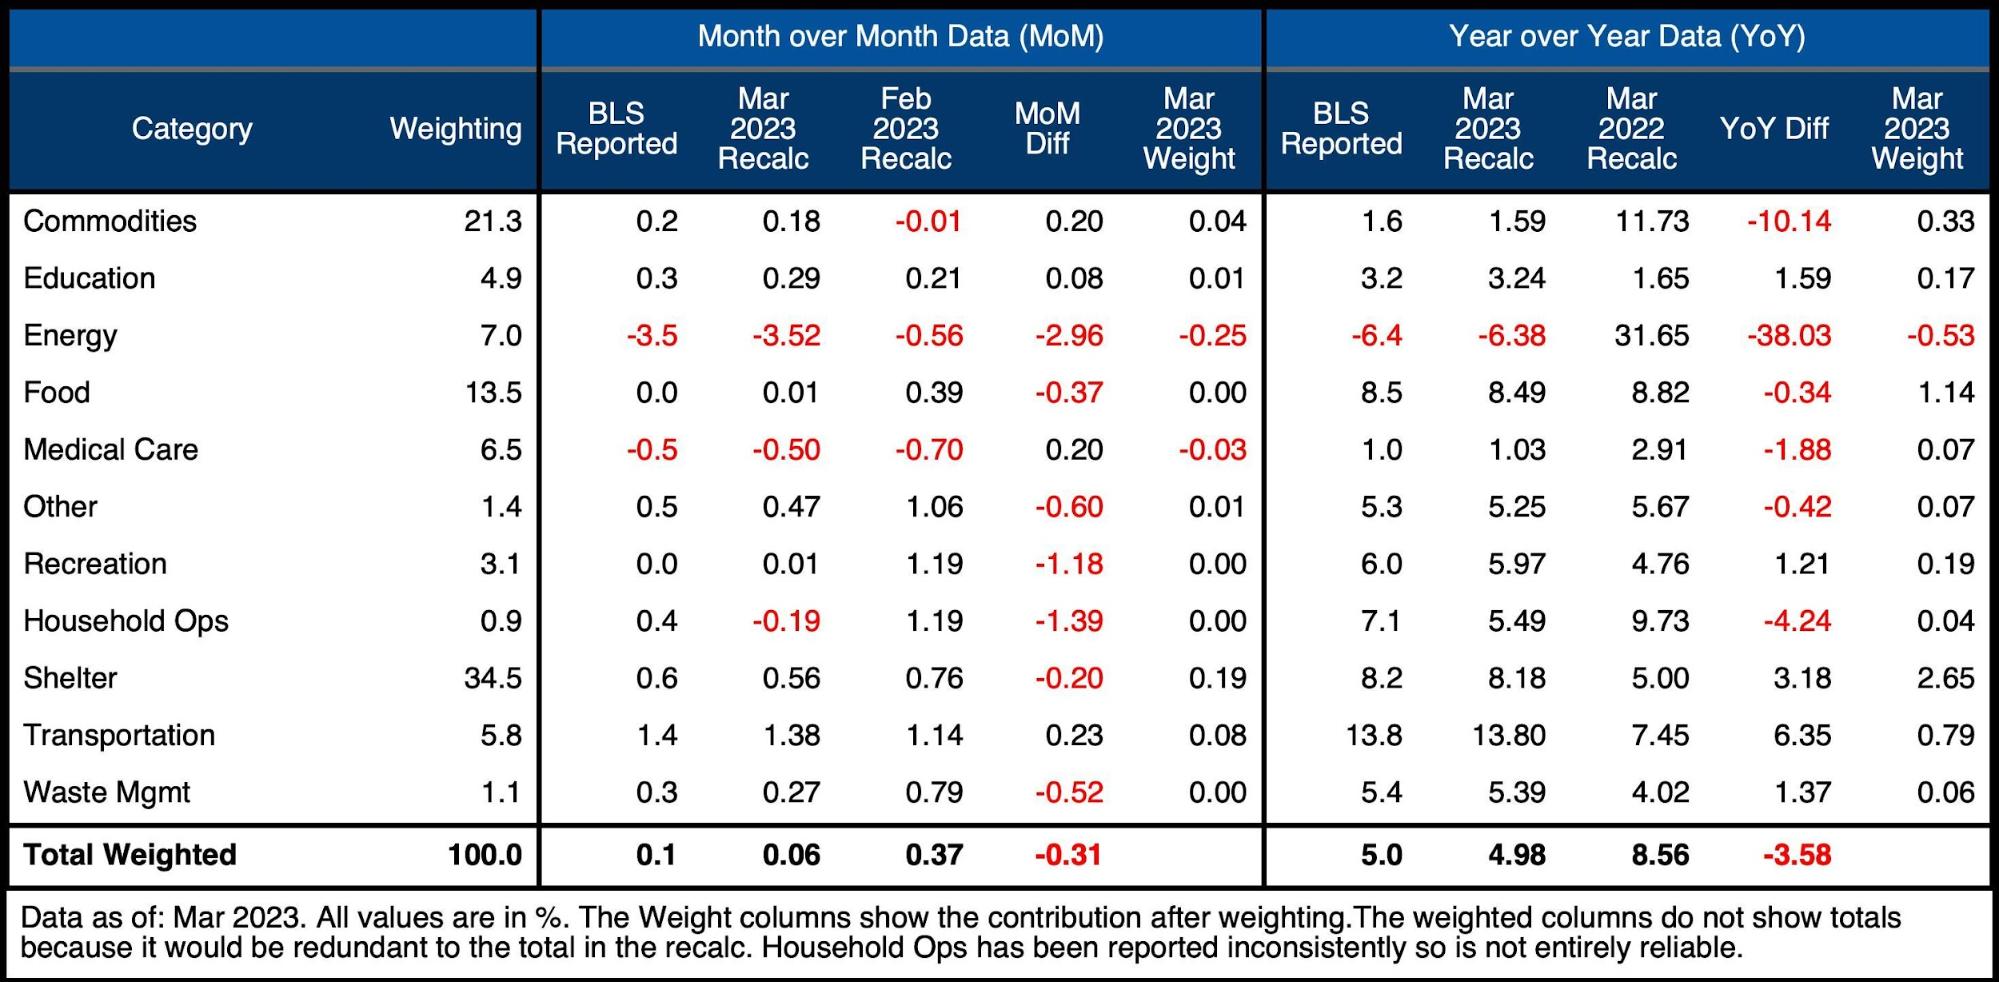
Figure: 4 Inflation Detail
Looking at the Fed Numbers
While the Fed does have different categories (e.g., Energy is in transportation), their aggregate numbers match to the BLS. Their categories make it seem like all components are at or below the 12-month trend. Considering what the BLS is showing, this is quite deceiving.

Figure: 5 Current vs History
Fed Historical Perspective
The Fed is only now seeing the CPI and interest rates converge. Unfortunately, the Fed is nearing the end of its tightening cycle, while inflation is likely taking a break before heading back up. Looking at the history of the CPI, it’s very rare that a spike-up is not followed by a second spike later on. Furthermore, in past cycles, the Fed has been quicker to act and raised rates above the rate of inflation.
The Fed has certainly made it higher and longer than would have been expected, but the economy is buckling under the weight. They are still focused on the jobs numbers, and not seeing the bigger picture. It’s only a matter of time before things come unraveled and the Fed is back to easy money. The CPI will likely be heading up again when this happens which will only add fuel to the fire.
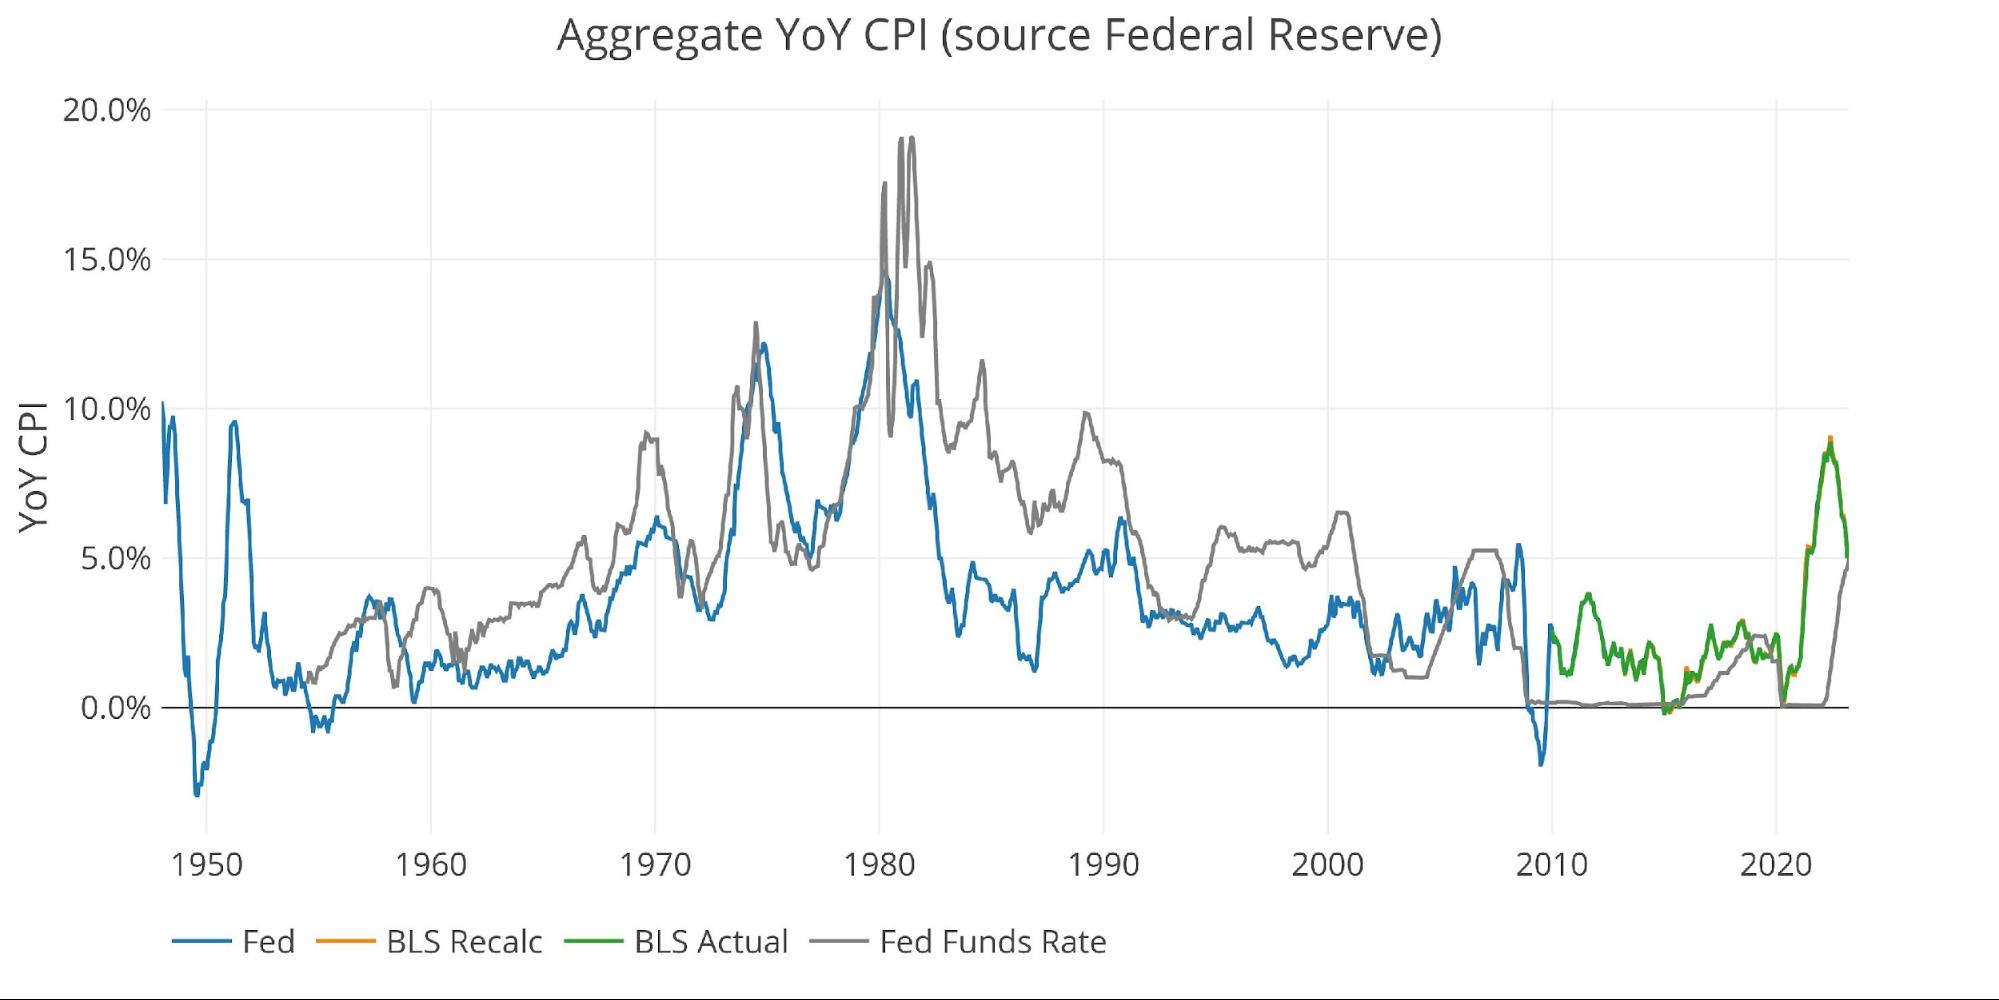
Figure: 6 Fed CPI
BLS Historical Perspective
The BLS weightings have only been scraped back to 2012, thus the chart below shows the past 11 years of annual inflation data, reported monthly. It cannot show the spikes of the 70’s and 80’s shown in the Fed data above.
Big months from last year (i.e., May – 0.92% and June – 1.2%) will be coming off soon which will further lower the YoY numbers. At the same time, something else is likely to break in the economy giving the Fed the perfect excuse to pause its hiking cycle. The next hike, currently 71% probable, will likely be the last… if it even happens.
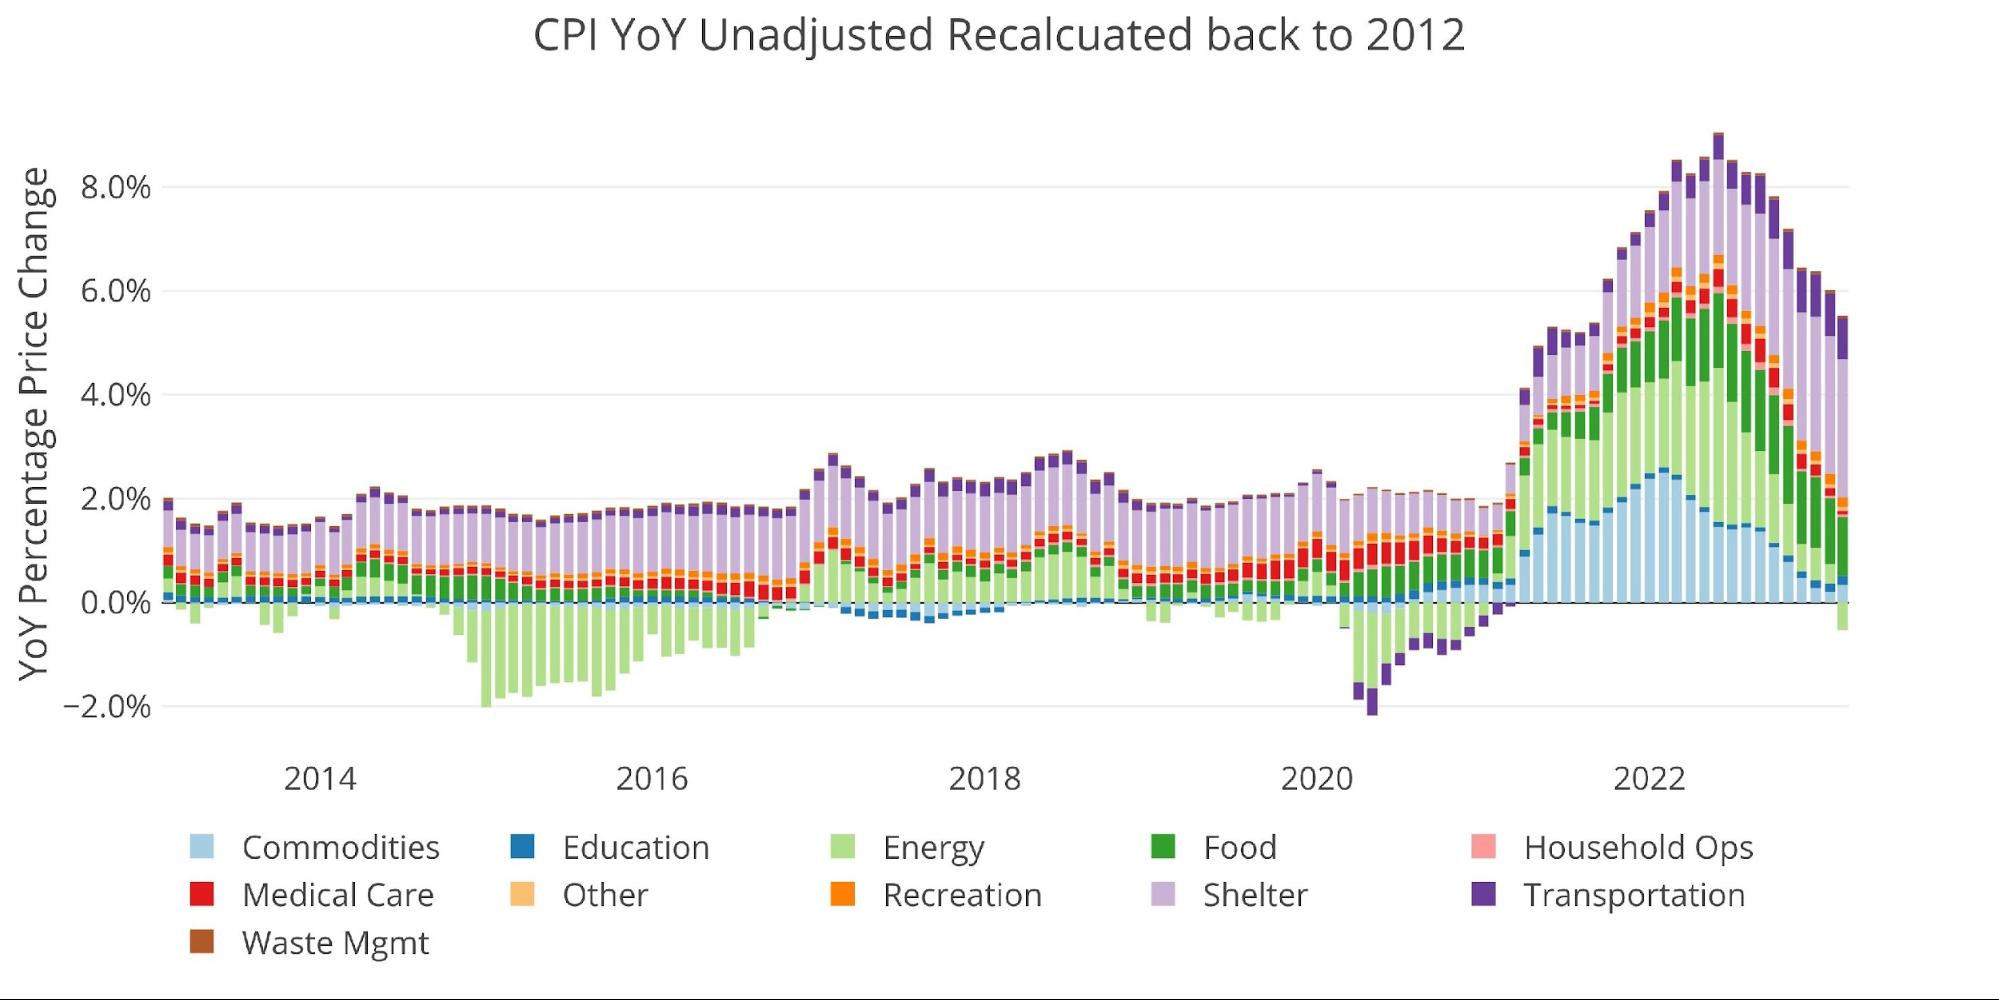
Figure: 7 Historical CPI
Wrapping Up
I must admit that I am still surprised that the Fed has made it this far with only breaking a few things. I must remind myself that these things take longer to play out than you would expect. Peter Schiff was calling for the housing bubble to pop back in 2004, but it wasn’t until March 2008 when Bear Stearns collapsed and things started to unravel. Even after Bear, it took another 6 months for Lehman to go down.
Pressure is building, and something else will break. Considering the magnitude and aggressiveness of the tools they used when SVB collapsed, the Fed is clearly aware of the fragility of the situation. Thus, the next crisis will absolutely put inflation on the back burner. They are delaying that day as much as they can, but it is not far off. When the Fed jumps back into the easy money game, the Dollar might see a massive repricing lower, only exacerbating the inflation problem. The continued strength in gold is reflecting this reality.
The inflation rate has dropped steadily over the last year, but there are still too many components rising to get inflation back to 2%. Long before this happens, the Fed will be back to easy money. In a year, it’s far more likely inflation is trending above 5% than below it.
Data Source: https://www.bls.gov/cpi/ and https://fred.stlouisfed.org/series/CPIAUCSL
Data Updated: Monthly within first 10 business days
Last Updated: Mar 2023
Interactive charts and graphs can always be found on the Exploring Finance dashboard: https://exploringfinance.shinyapps.io/USDebt/

Call 1-888-GOLD-160 and speak with a Precious Metals Specialist today!
Buka akaun dagangan patuh syariah anda di Weltrade.
Source link