The technical analysis last month highlighted how the current price spike looked unsustainable and needed time to consolidate. It also mentioned that we may be at a turning point in precious metals, concluding:
The price indicators are quite bearish at the moment. Price spikes like the one seen this week are typically unsustainable. The technical price chart is calling for a pullback. However, many of the other indicators are quite bullish. While not definitive, this leads me to conclude we might be on the cusp of a shift in the market where fundamentals and physical supply dominate the price action rather than technicals in the paper market.
This tug of war has played out over the last month and particularly over the last week. $2000 became support for gold even as the Fed rhetoric remained hawkish. It was clear that the market was challenging this support diligently, finally breaking it on Friday. So, where does this leave gold and silver?
The shift to fundamentals driving the price seems underway but is still early. Until it completes, the technicals will drive this market. The data below paints a picture of mixed indicators and suggest that a period of consolidation is likely ongoing but with relatively high levels of support. The consolidation will complete once the next catalyst hits the market, bringing gold to new all-time highs.
Resistance and Support
Gold
Gold made it through $2000 but the move lacked conviction. It spent most of the last month flirting right around $2000 and a big move up in April to attempt a new all-time high was immediately sold hard. That move up looked like the last gasp of this current bull move, which has run out of steam. This week, the shorts kept hammering the price back below $2000 and the bulls finally ran out of stamina this past Friday, unable to hold above.
The shorts had to use a lot of effort to get the price to close back below $2000. This suggests that much of the consolidation might be complete. Having broken minor support, the price could test the $1950 area, but there does not seem to be much more downside beyond that. The bulls need to hold the $1950 level so that on the next move up, all-time highs remain well in sight.
If the right catalyst lands before the shorts get below $1950 then gold is poised to hit $2100 quickly. Any shorts should be careful here.
Outlook: Slightly bearish very short-term (1 month), bullish medium-term (2-3 months)
Silver
Silver held the $25 level this week. The shorts were likely more focused on gold, hoping that a break in one market would lead to a break in the other. If silver can hold $25 over the next week, this would be a very bullish sign, and suggest it could be ready to take on the $28 level with $30 as the next major hurdle. A break of $25 opens the door to test $24 and even $22 in an extreme scenario. This week will be telling.
Outlook: Neutral
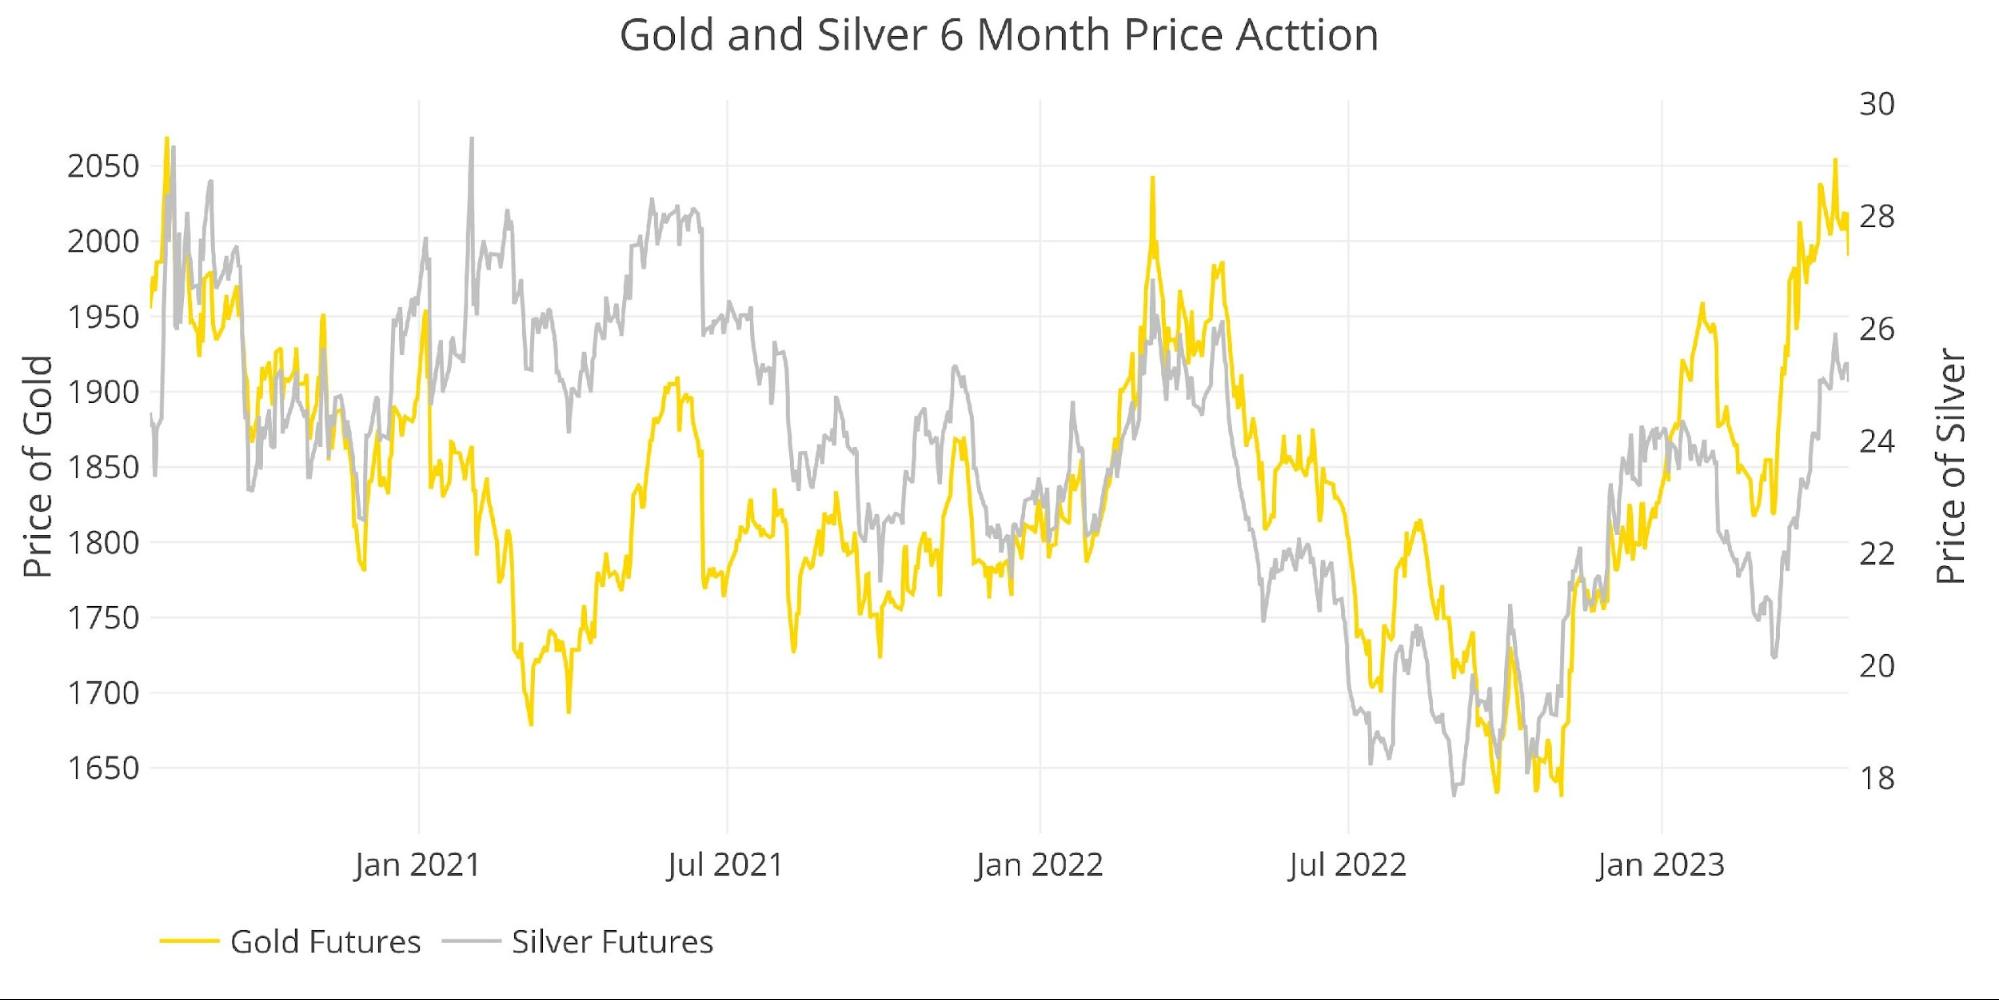
Figure: 1 Gold and Silver Price Action
Daily Moving Averages (DMA)
Gold
The current move has definitely gotten ahead of itself. The price is well above the 50 and 200 DMA. This suggests a pullback or an extended consolidation at the very least. That said, as mentioned above, there are now several levels of support that the bears would have to fight with on any move down. The 50 DMA is at $1924 with the 200 DMA all the way down at $1804.
The current price is pulling both averages up, but more time is needed to bring them higher and raise long-term support levels.
Outlook: Short-term neutral/bearish, medium-term very bullish
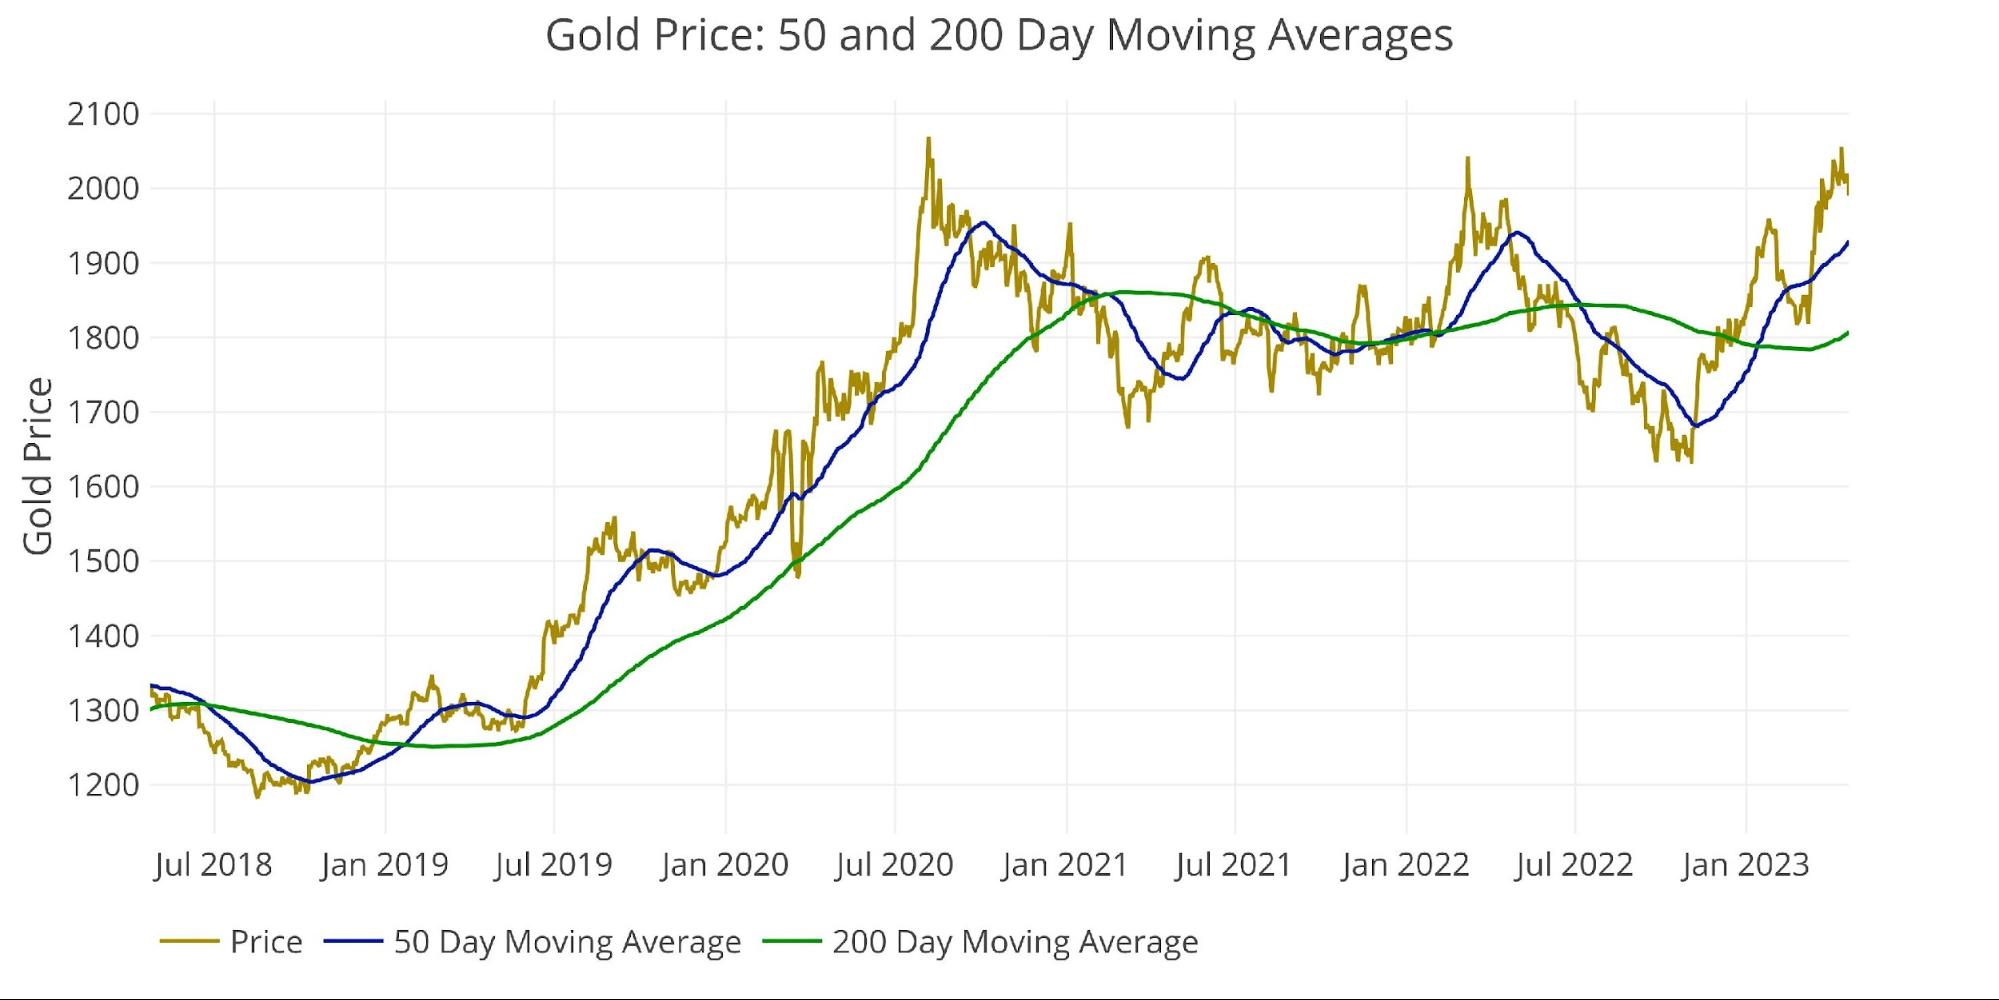
Figure: 2 Gold 50/200 DMA
Silver
Last month, silver was less overbought, which gave it more room to run. The call at the time was “bullish”. Having completed that run, it is now in the same position as gold. It needs time to consolidate and let the DMAs catch up to the current price. A very bullish consolidation would allow for less downside as it meanders near current levels. Again, the next few weeks are quite important. If silver holds current levels, it would be very bullish.
Outlook: Short-term neutral/bearish, medium-term very bullish
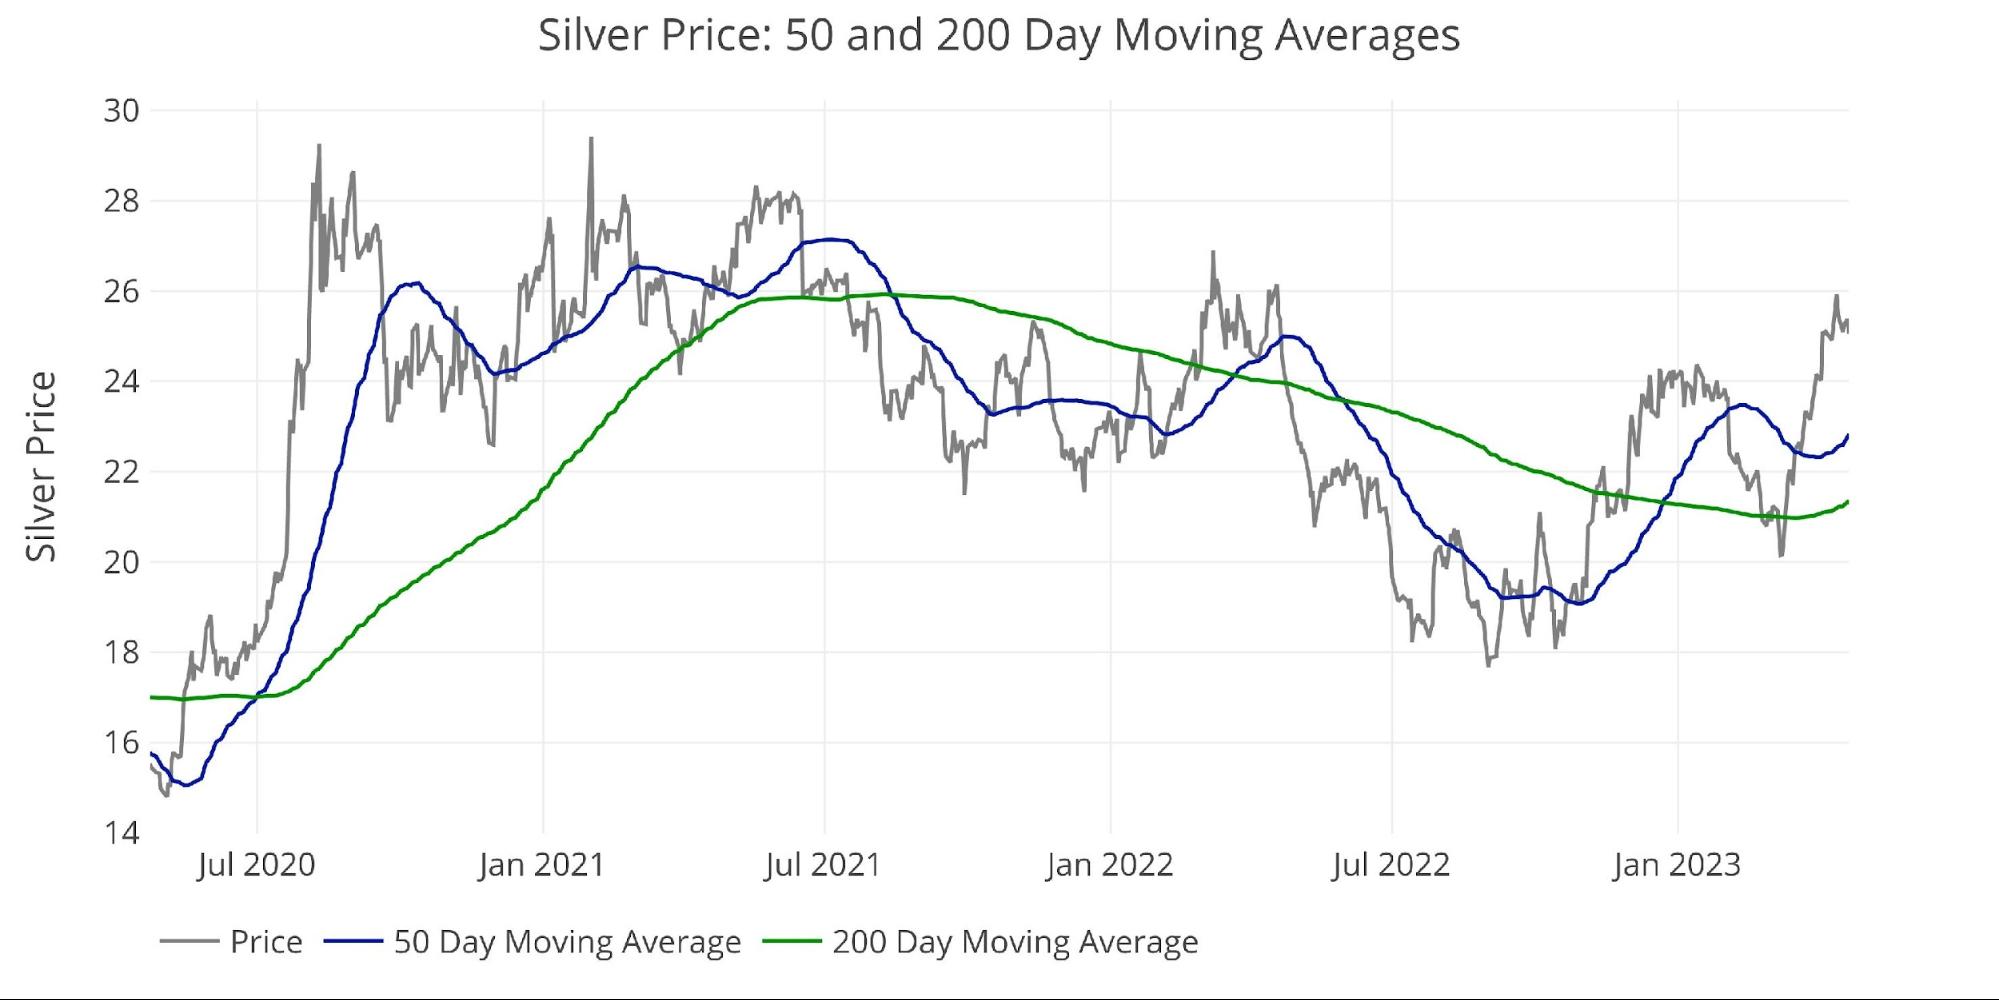
Figure: 3 Silver 50/200 DMA
Comex Open Interest
Gold
Similar to last month, the chart below is extremely bullish. Historically, big price moves are driven by big moves up in open interest as traders get behind a move. The problem is that traders are weak holders and sell at the first sign of trouble. The current price move-up has not been fueled entirely by the futures market. This can be seen below as the open interest stays well below recent highs.
This is likely why $2000 held up so well during the week. When the price dipped, longs were not immediately running for the hills. The chart below suggests that there is actually a lot of fuel in the futures market that could really drive the price higher if the traders got behind the move.
Outlook: Very Bullish
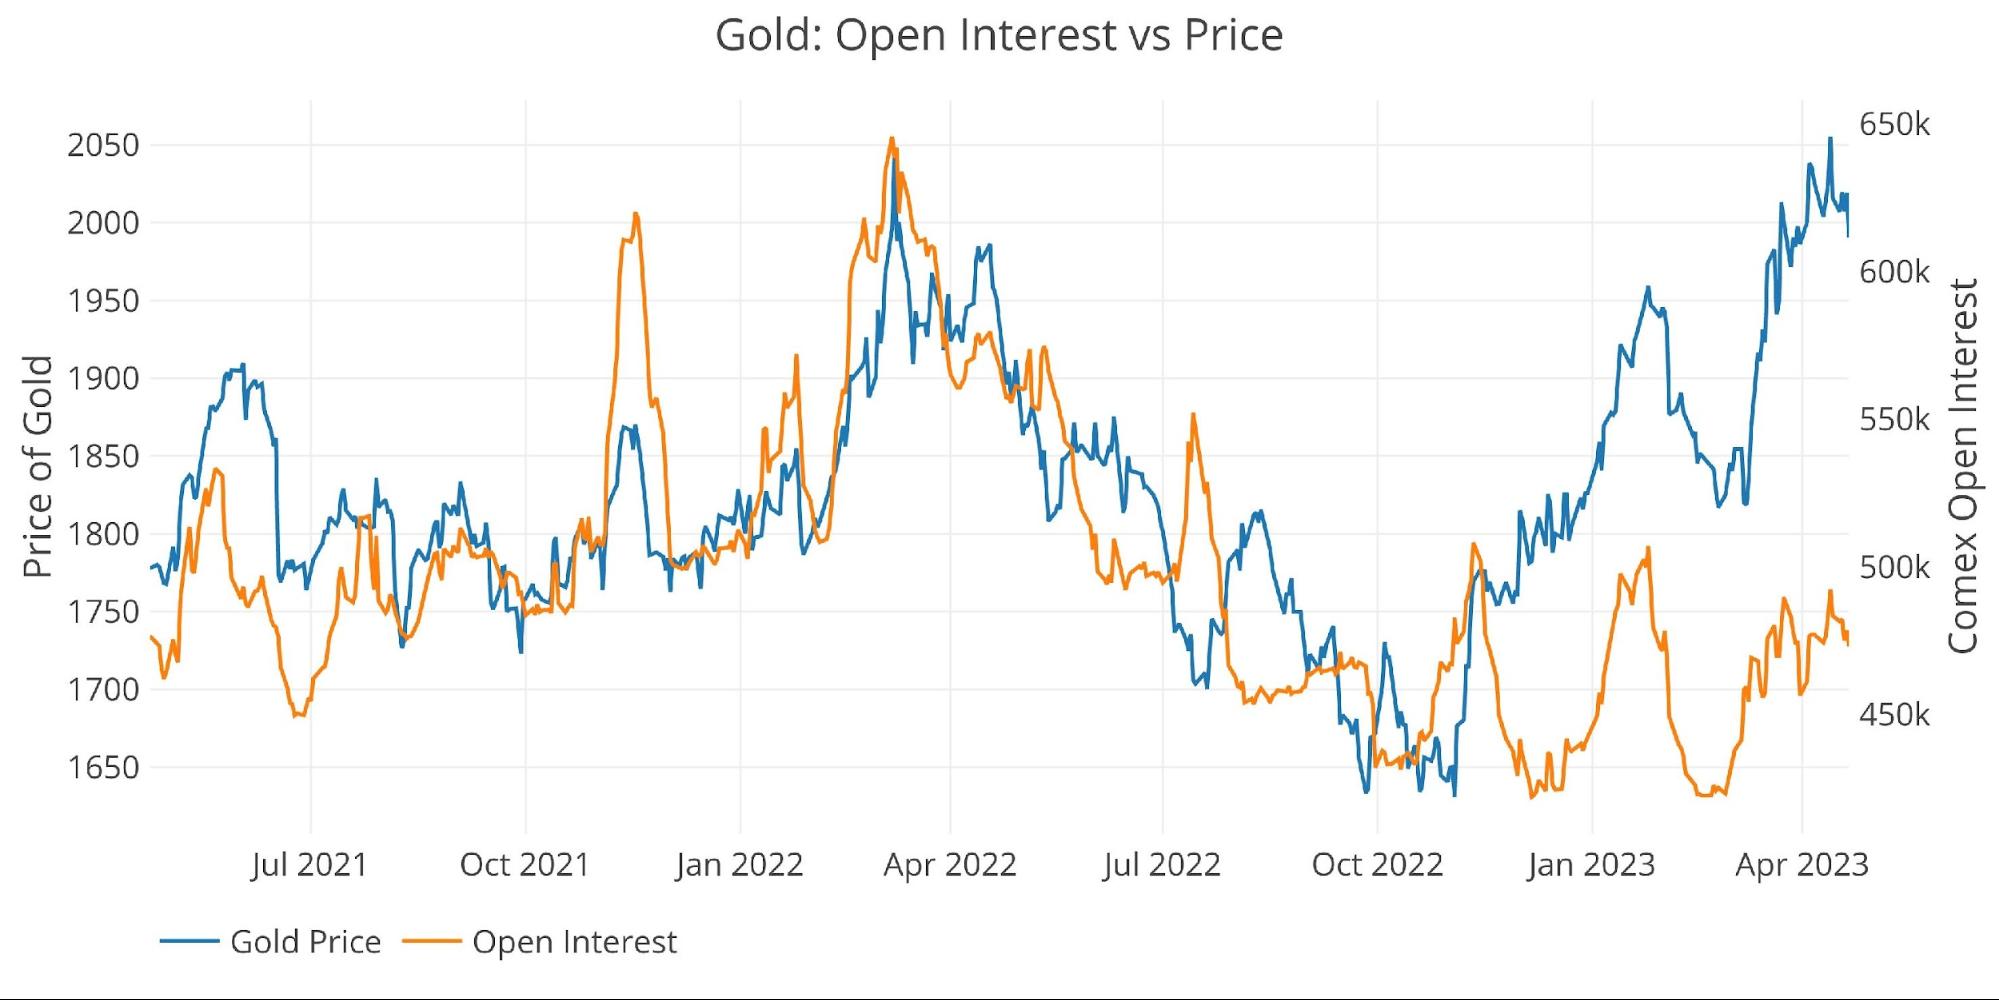
Figure: 4 Gold Price vs Open Interest
Silver
This chart last month was shown as being “Extremely Bullish”. In hindsight, that was definitely the right call as silver exploded up by almost 10%. The traders have now bought into the move in silver, which drove both price and open interest much higher. The concern here is that these traders will leave at the first sign of trouble, once again highlighting why the next two weeks are so important.
Now that open interest has risen so much, the chart is far less bullish than it was. While gold has open interest well below where it should be given the price, silver is now in-line. These new holders need time to get comfortable in their position. This will happen unless they are given a reason to unload.
Outlook: Neutral
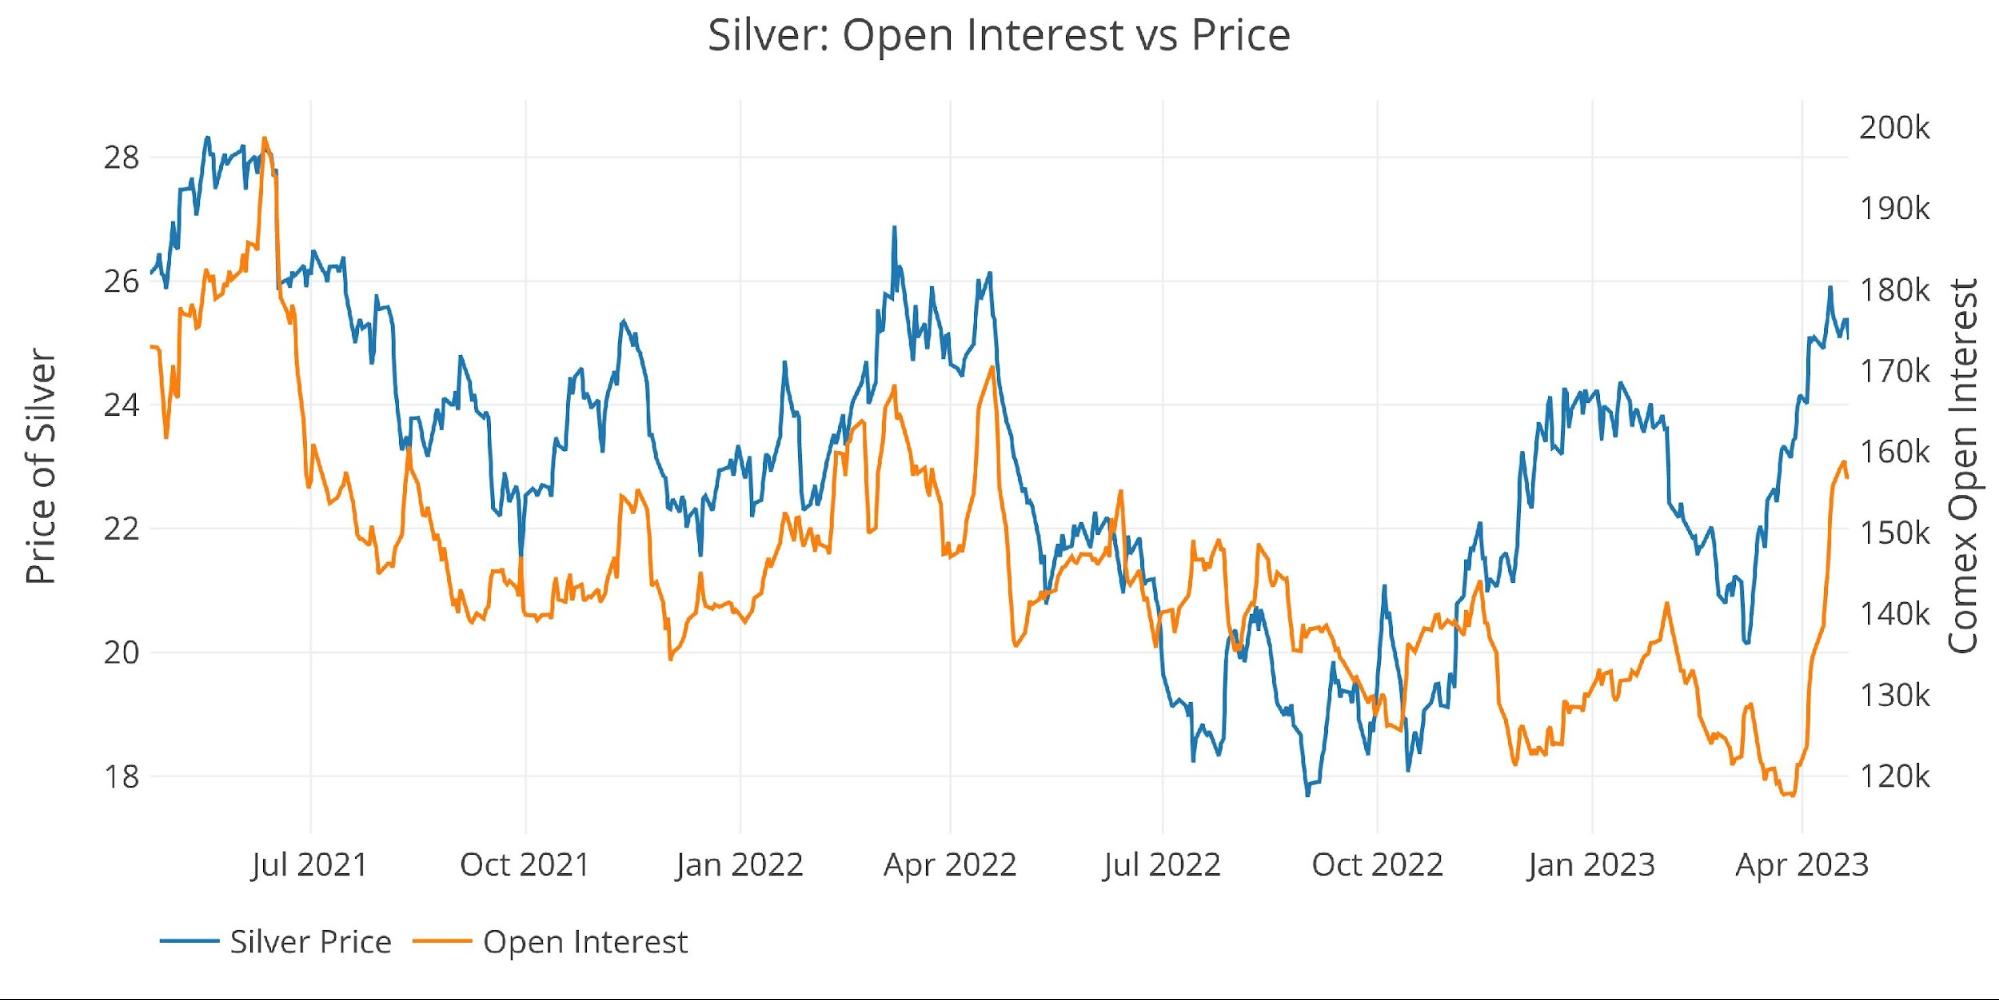
Figure: 5 Silver Price vs Open Interest
Margin Rates and Open Interest
Gold
Margin rates have been steadily rising since November last year. Rates are now up $2600 in 5 months. This is a very big move (increase of 50%) but it has done little to dent the price. The reason it has had minimal impact is because the gold price is not being driven primarily by the futures market as noted above.
If the CFTC continues to increase margin rates, then it will be missing at least one major lever on the next price advance to halt the move.
Outlook: Bullish
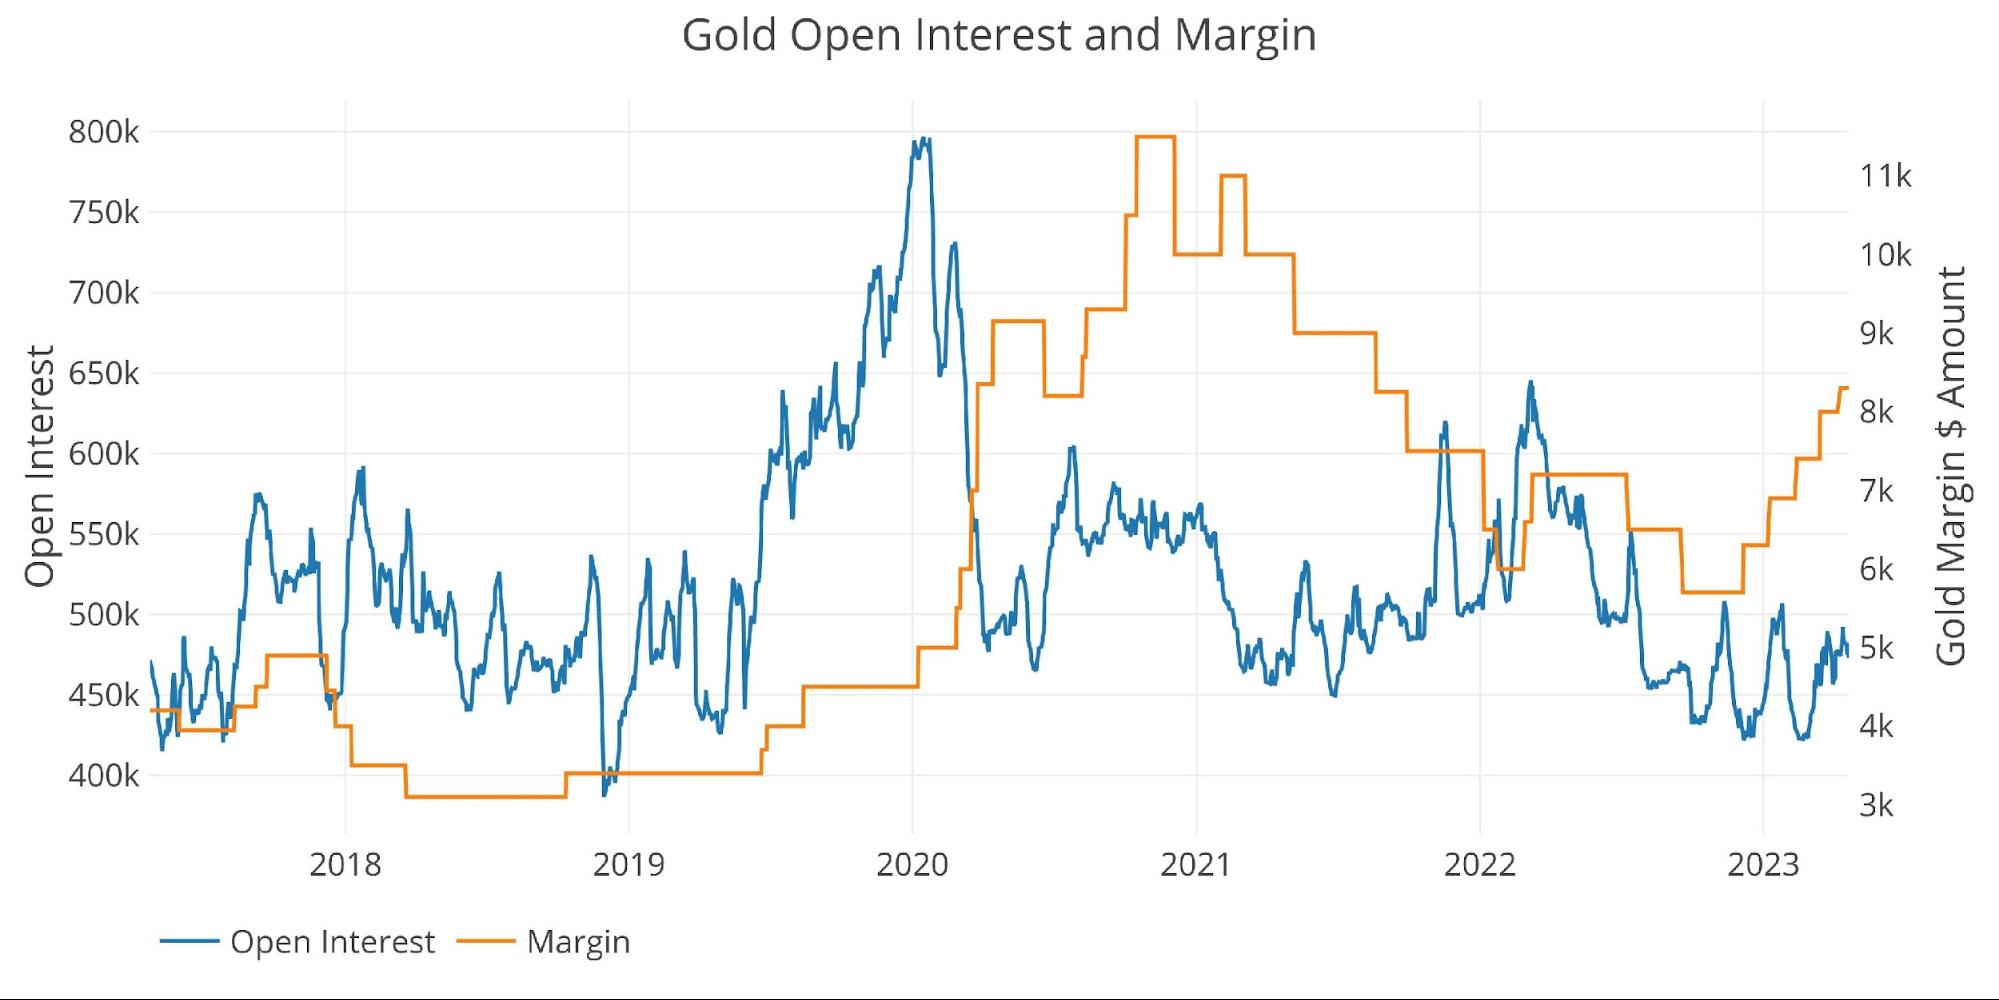
Figure: 6 Gold Margin Dollar Rate
Silver
With the recent spike in open interest combined with the smaller increases in margin rates, the CFTC now has much more ability to contain this market. The CFTC has a lot of room to push margin rates higher and a new cohort of weak holders to push out.
Outlook: Bearish
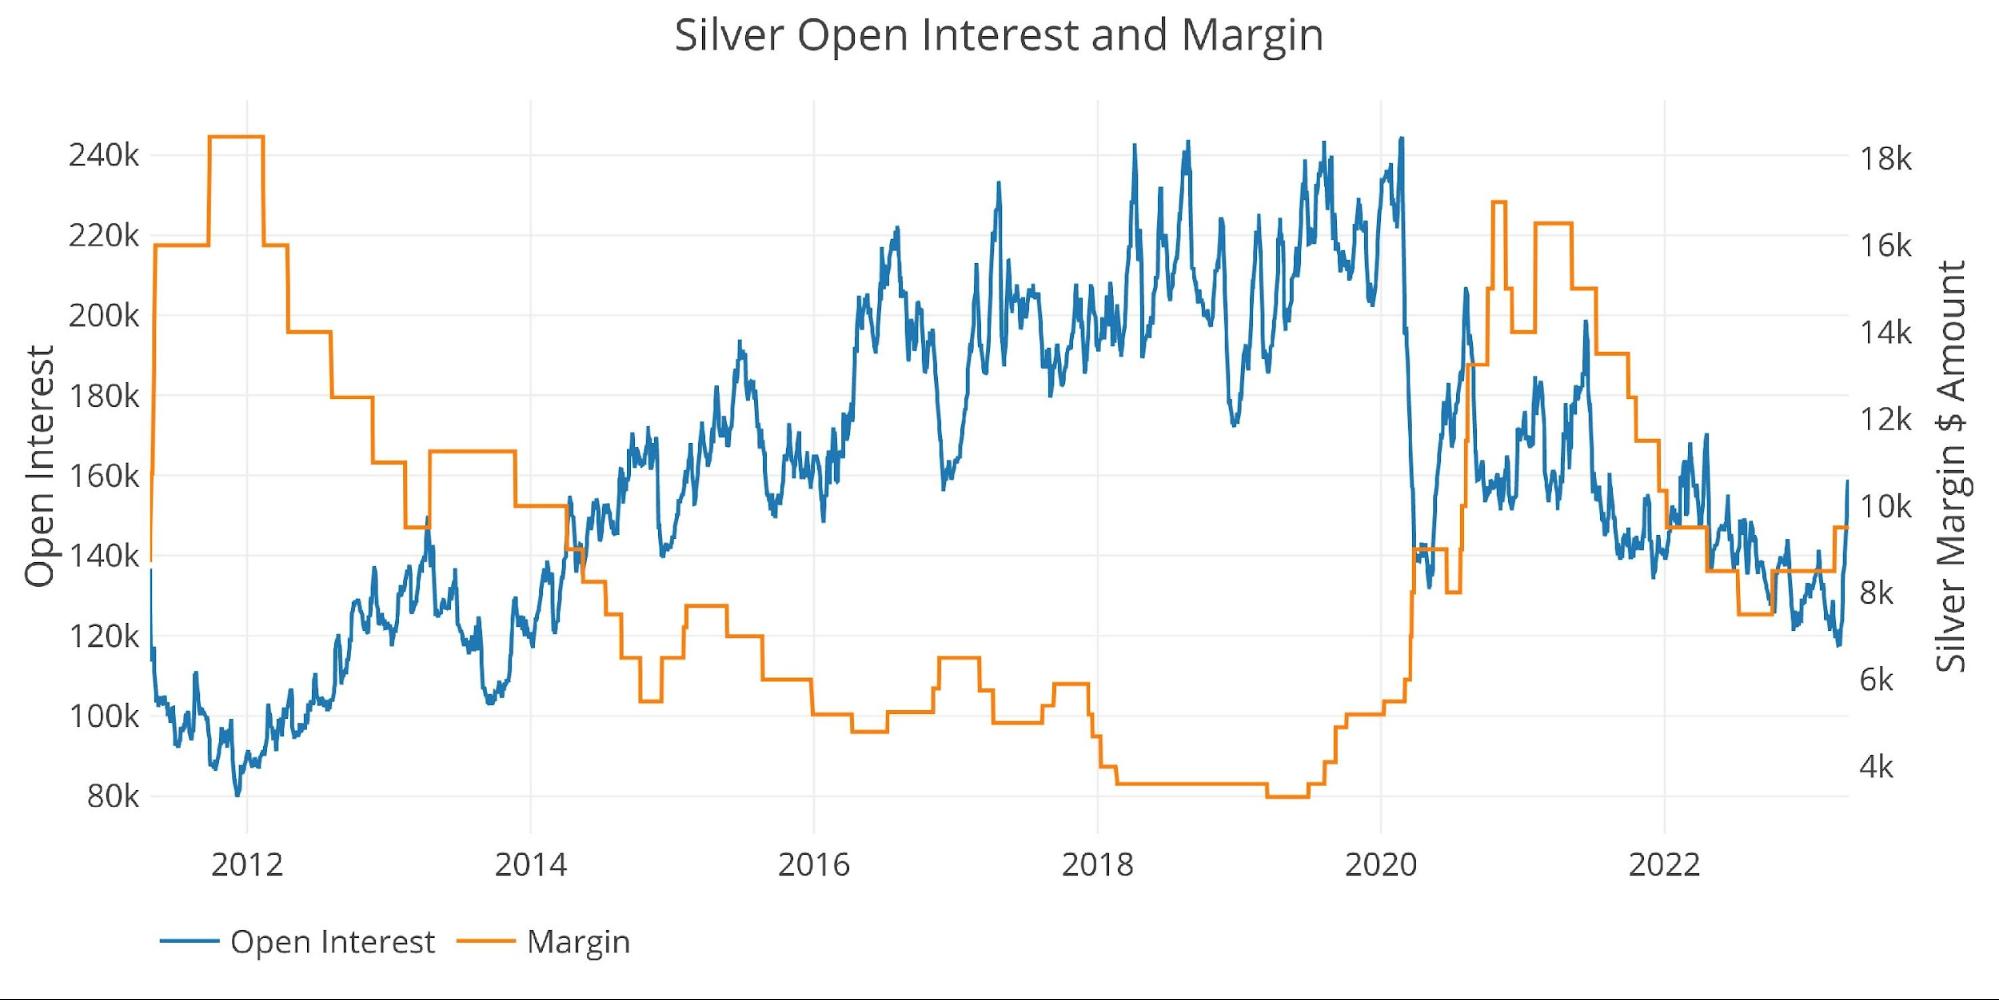
Figure: 7 Silver Margin Dollar Rate
Gold Miners (Arca Gold Miners Index)
The gold miners have been consistently leading the price of gold in both directions for years. The price action this week suggested that gold was going to have trouble holding $2000. The miners were getting sold hard each day. Even as gold recovered, the rally in the miners sputtered out.
Over the last six weeks, traders clearly got behind the move in gold, but this past week suggests that traders are getting nervous. Gold’s inability to break out to new all-time highs has traders contemplating the next move. Right now, it looks like that could be down.
Outlook: Neutral to bearish
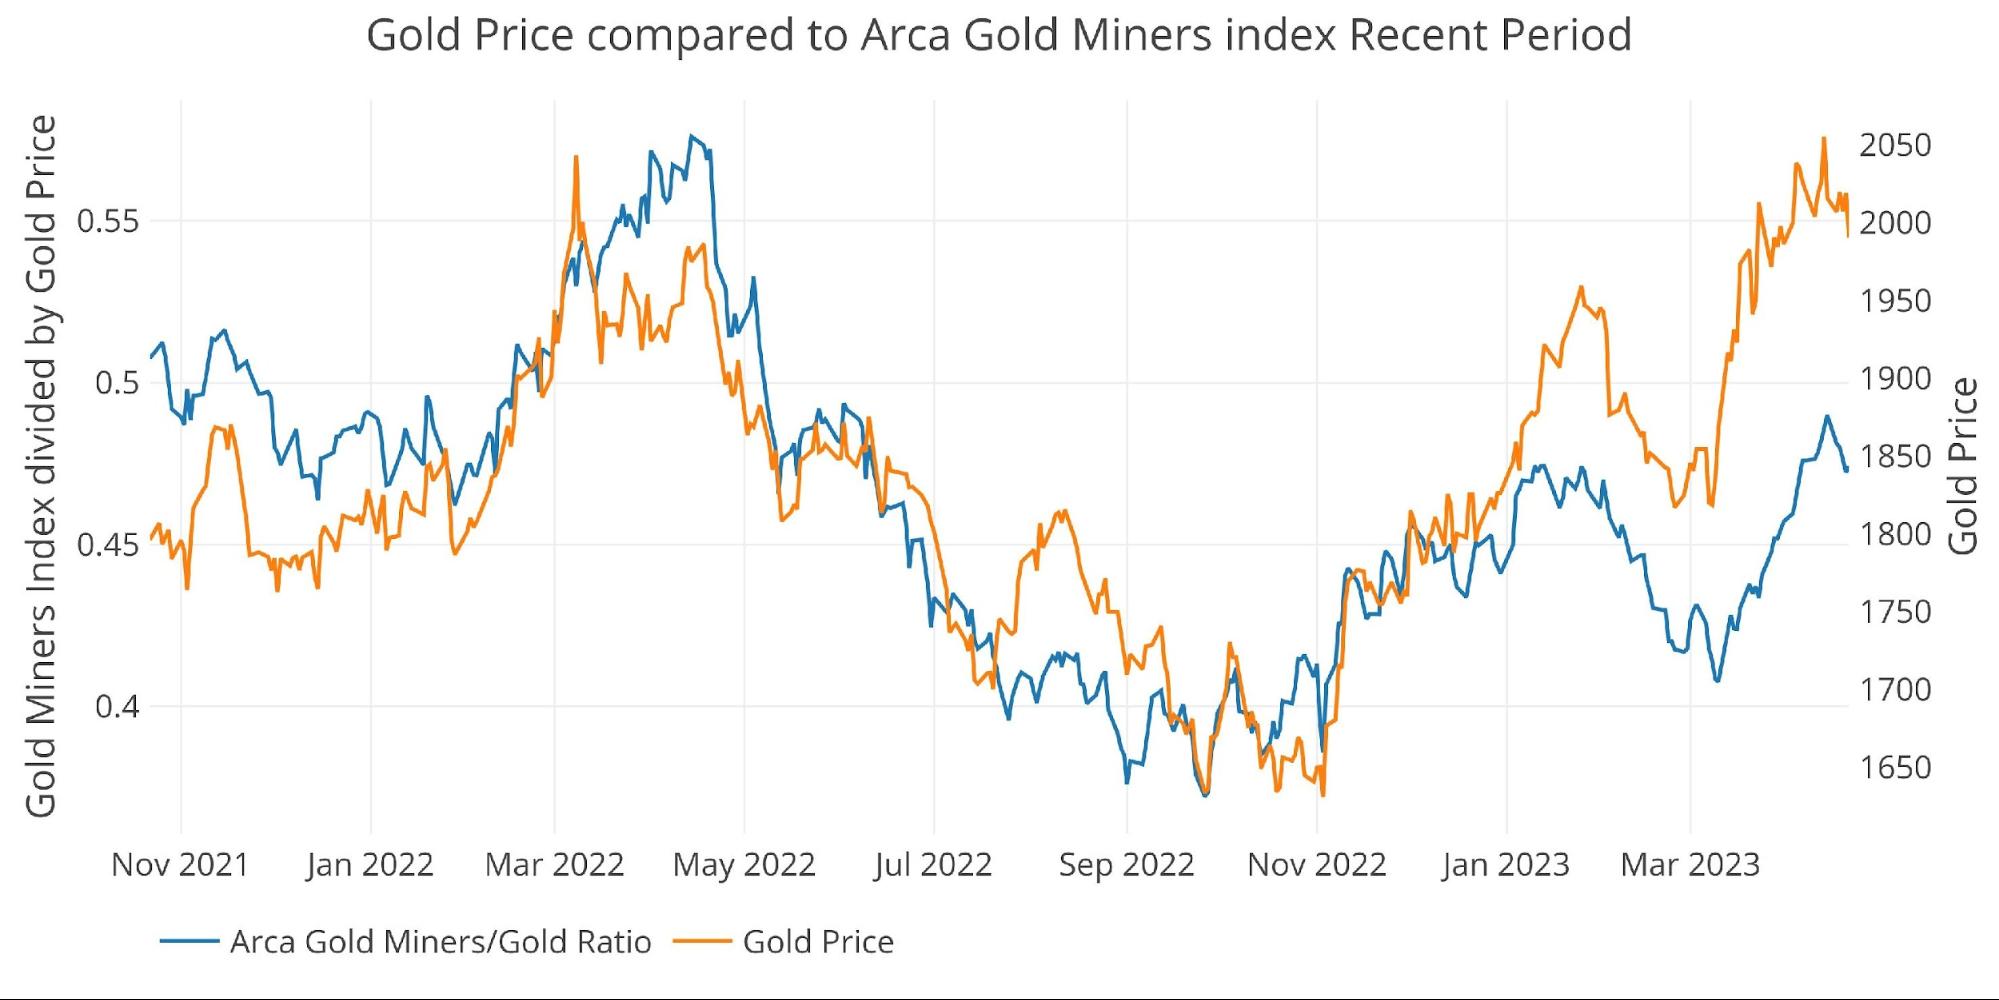
Figure: 8 Arca Gold Miners to Gold Current Trend
The chart below shows the longer-term historical relationship. The miners have been absolutely punished over the last decade as stock traders have never bought into the current move in gold. That leaves these stocks deeply undervalued and set up for an explosive move when the gold price takes off.
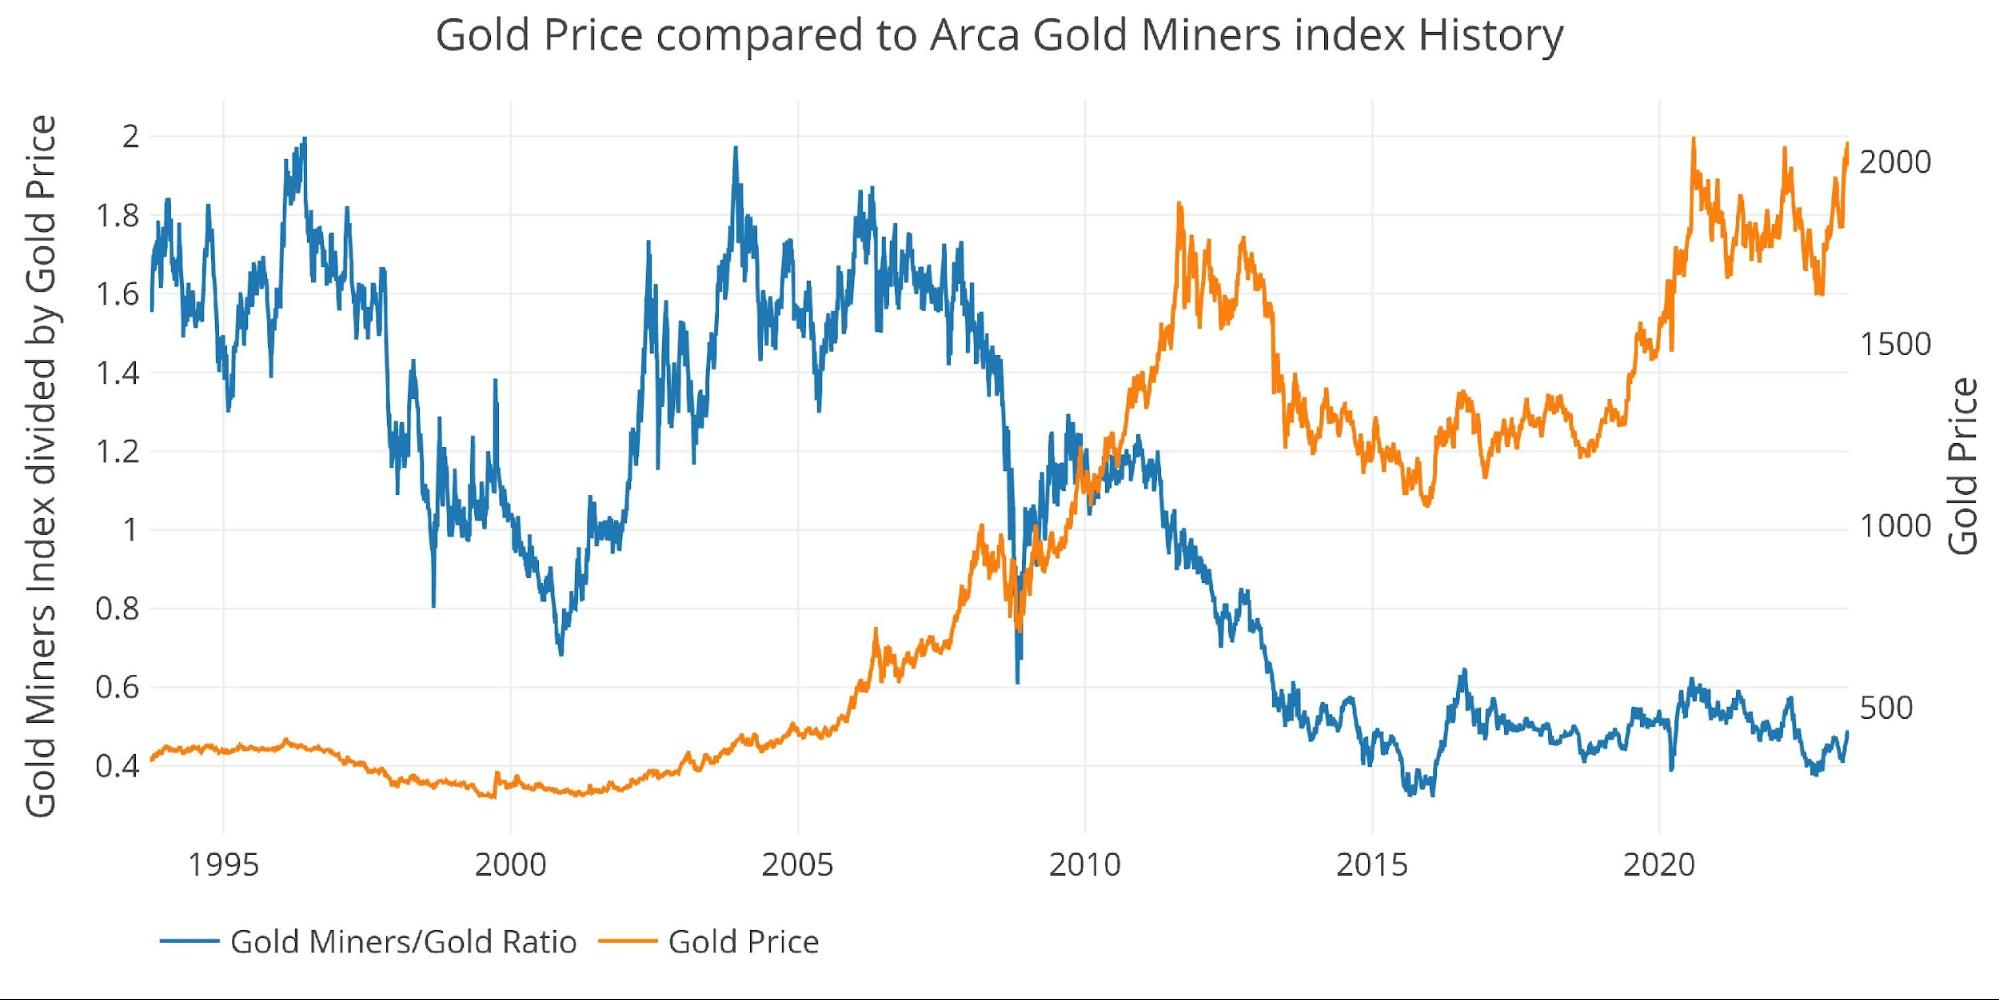
Figure: 9 Arca Gold Miners to Gold Historical Trend
Trade Volume
Love or hate the traders/speculators in the paper futures market, but it’s impossible to ignore their impact on price. The charts below show more activity tends to drive prices higher.
Volume in gold has calmed down but the open interest has not seen the subsequent dumping. Again, this shows that the current price advance was not driven entirely by the futures market as it has been in the past. Further, with volume back at the lows, the next spike in volume could easily take gold to new all-time highs.
Outlook: Bullish
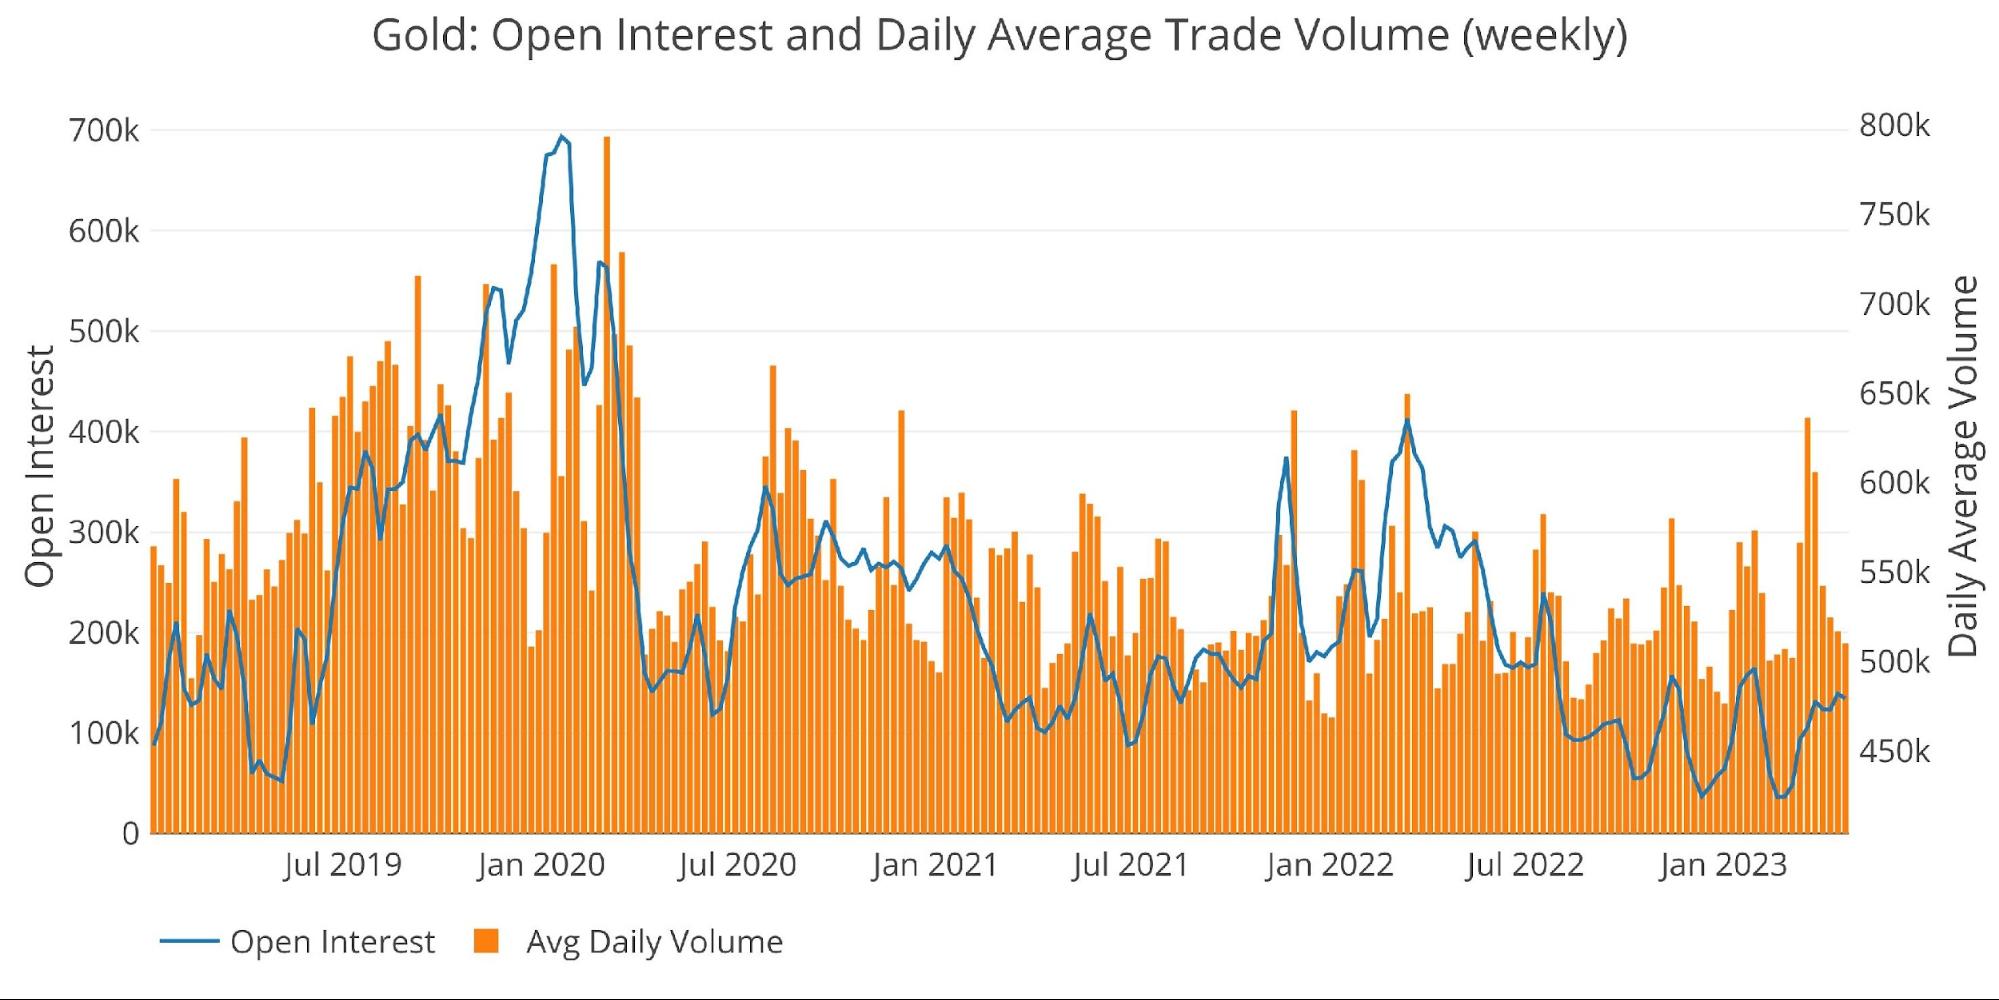
Figure: 10 Gold Volume and Open Interest
Silver has seen stronger volume in recent weeks which suggests it could be ready for a cool-down.
Outlook: Bearish
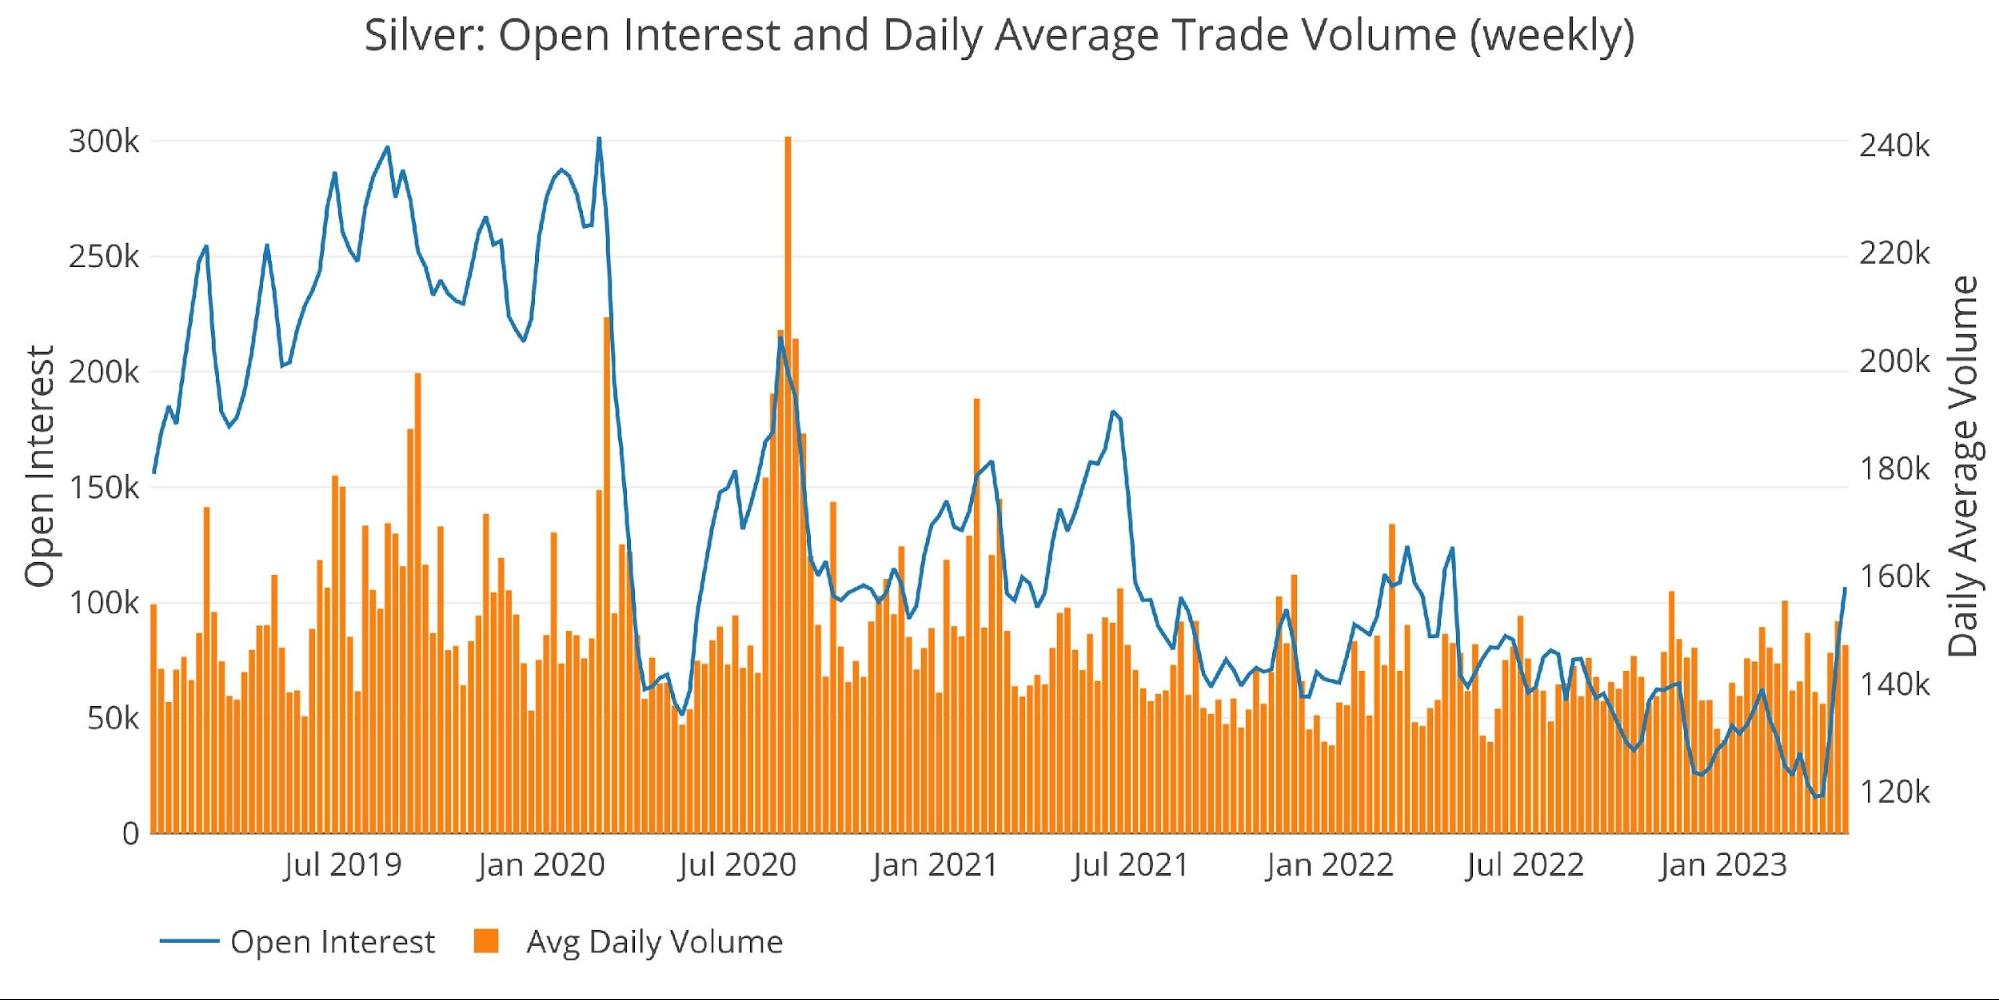
Figure: 11 Silver Volume and Open Interest
Other drivers
USD and Treasuries
Price action can be driven by activity in the Treasury market or US Dollar exchange rate. A big move up in gold will often occur simultaneously with a move down in US debt rates (a move up in Treasury prices) or a move down in the dollar.

Figure: 12 Price Compare Inverse DXY, GLD, 10-year prices
The up move in the dollar occurred on Monday, prompting the sell-off in gold early in the week. The dollar then sold off for the week and gold was unable to rally. The situation is similar in bonds, ending the week about where it started the week. This means gold deviated from the pack in the second half of the week. This likely means the move in gold has gone too far and the selling pressure should abate unless the dollar and yields both rally early next week.
Outlook: Bullish
Gold Silver Ratio
The gold-silver ratio has recovered swiftly with silvers’ recent rise. While it remains above long-term historic averages, it is in line with more recent averages (back to 2015). Long-term, silver remains bullish relative to gold, but recent trends suggest a more neutral posture.
Outlook: Silver bullish relative to gold long-term
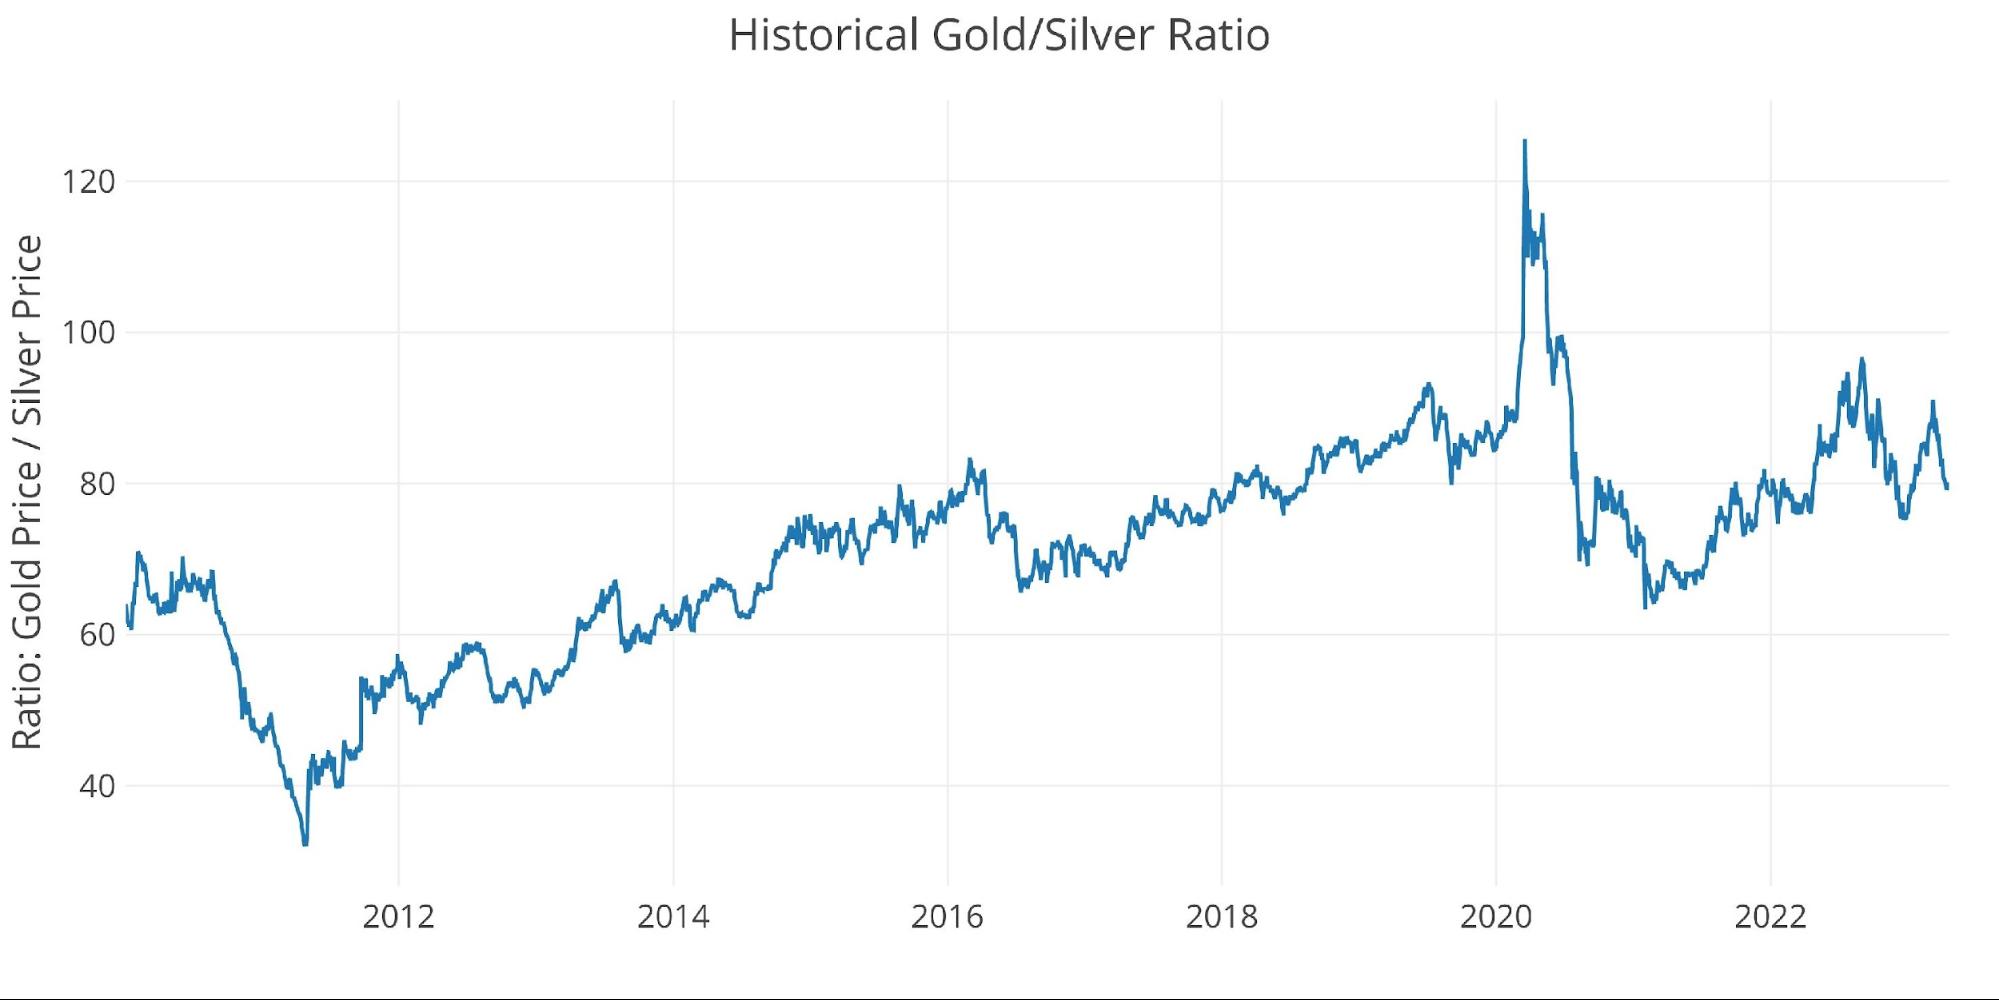
Figure: 13 Gold Silver Ratio
Bringing it all together
The table below shows a snapshot of the trends that exist in the plots above. It compares current values to one month, one year, and three years ago. It also looks at the 50 and 200-daily moving averages. While DMAs are typically only calculated for prices, the DMA on the other variables can show where the current values stand compared to recent history.
-
- The price is up 2% with the HUI gold ratio improving 8.5%.
- The open interest ratio has actually fallen even as total open interest increased (due to a higher price). The 50 DMA open interest ratio is below the 200 DMA, with current value at the 50 DMA. This suggests the market is far from overbought in the futures arena
-
- Silver has a value closer to the 200 DMA, well above the 50 DMA
-
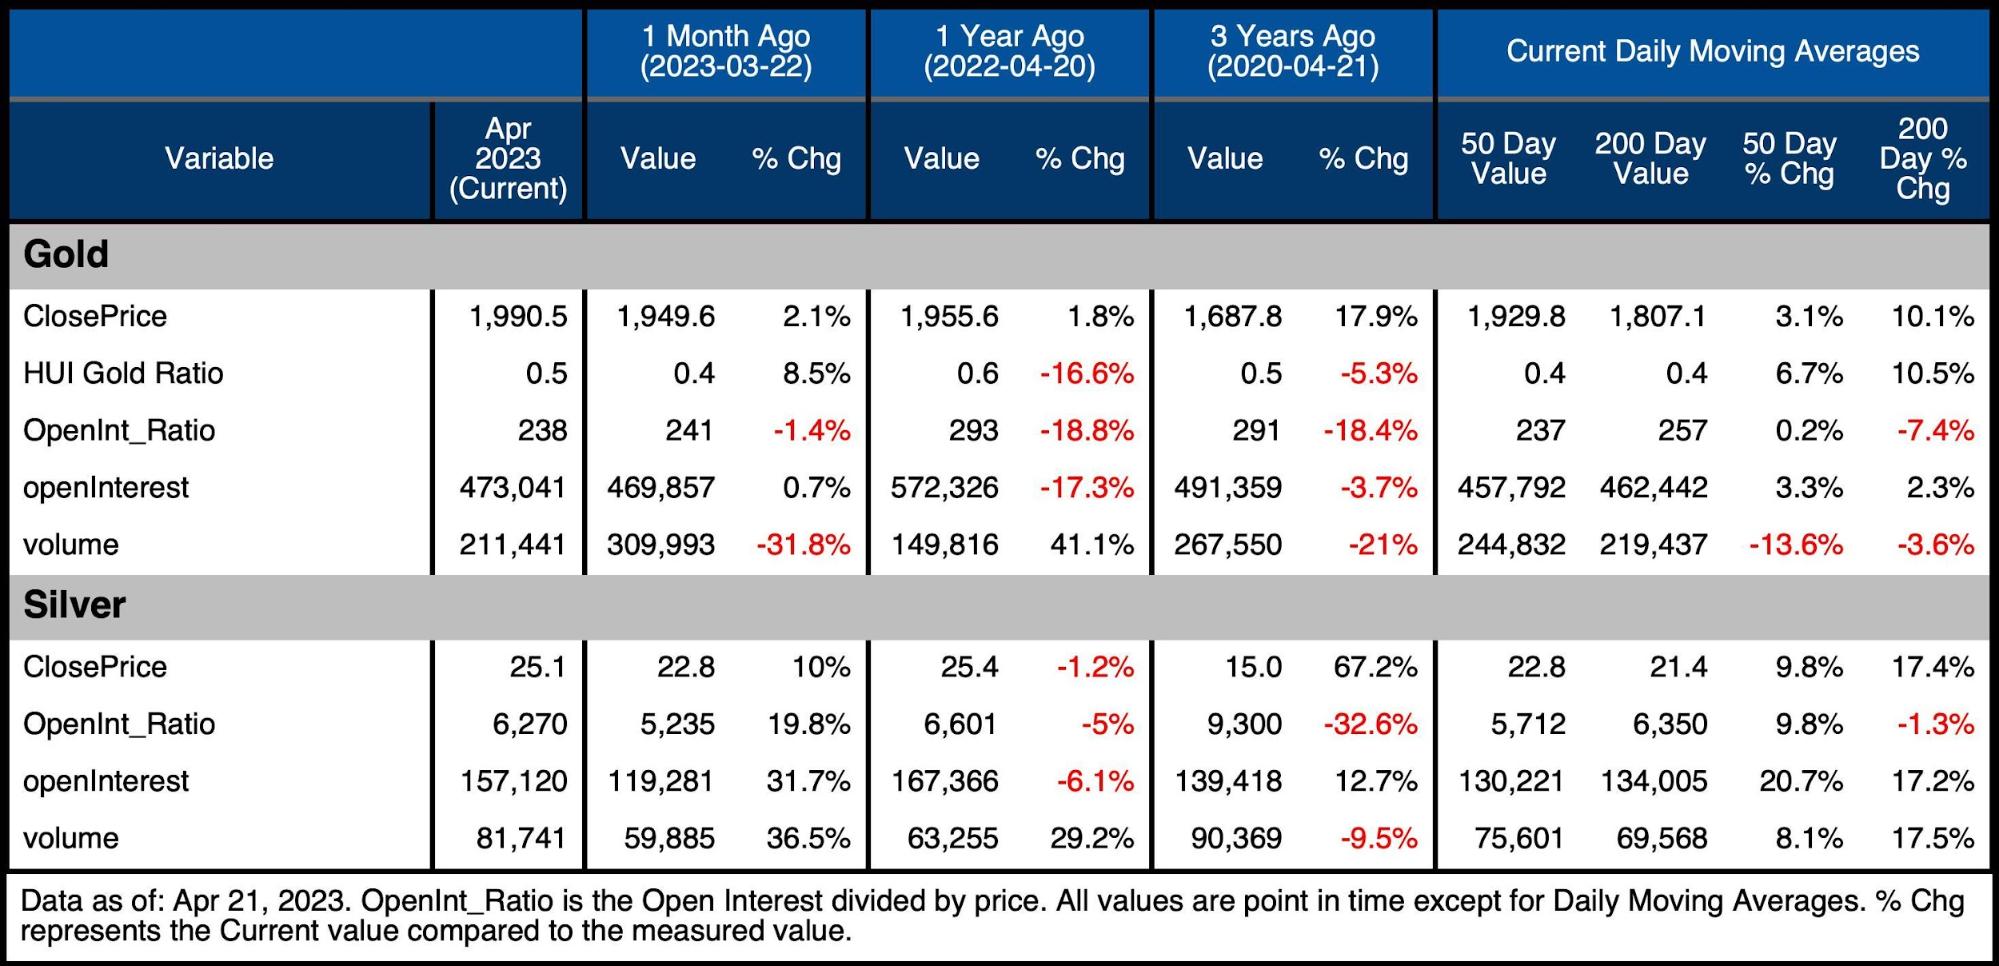
Figure: 14 Summary Table
Wrapping up
The indicators are once again giving some mixed signals. The price action is definitely needing further consolidation. However, other indicators suggest a market that is just getting started. This is especially true in gold, similar to how it was in silver last month. It worked out well for silver over the last 4 weeks so perhaps gold will see a similar reaction over the next few weeks. Either way, downside does seem limited at this point, especially considering all the bad news has been priced in. Things to keep an eye on over the next two weeks:
Silver is heading into a major delivery month starting on April 28th. The countdown data suggests there could be fireworks. especially given the recent drop in Registered that has set up the weakest coverage in years. I will publish a view of the countdown data on Tuesday, but until then, you can catch up on the intricate details on Reddit.
The Fed meeting on May 2nd could spark some activity. The talk remains hawkish and the market is pricing in 90% chance of another hike. Any indication from Powell that they are starting to tilt dovish could be a big catalyst.
Either way, the silver delivery market is the real data point to watch. The supply at the Comex will be what tips the precious metals market from a technically driven market to a market driven by fundamentals. When this happens, the price advances will be record-setting. Be prepared!
Data Source: https://www.cmegroup.com/ and fmpcloud.io for DXY index data
Data Updated: Nightly around 11 PM Eastern
Last Updated: Apr 21, 2023
Gold and Silver interactive charts and graphs can be found on the Exploring Finance dashboard: https://exploringfinance.shinyapps.io/goldsilver/

Call 1-888-GOLD-160 and speak with a Precious Metals Specialist today!
Buka akaun dagangan patuh syariah anda di Weltrade.
Source link