
The Federal Government ran a deficit of $88B in October which is down significantly from the deficit last month that was a record for September due to the student loan forgiveness program. The deficit is also down compared to last October which was -$165B.
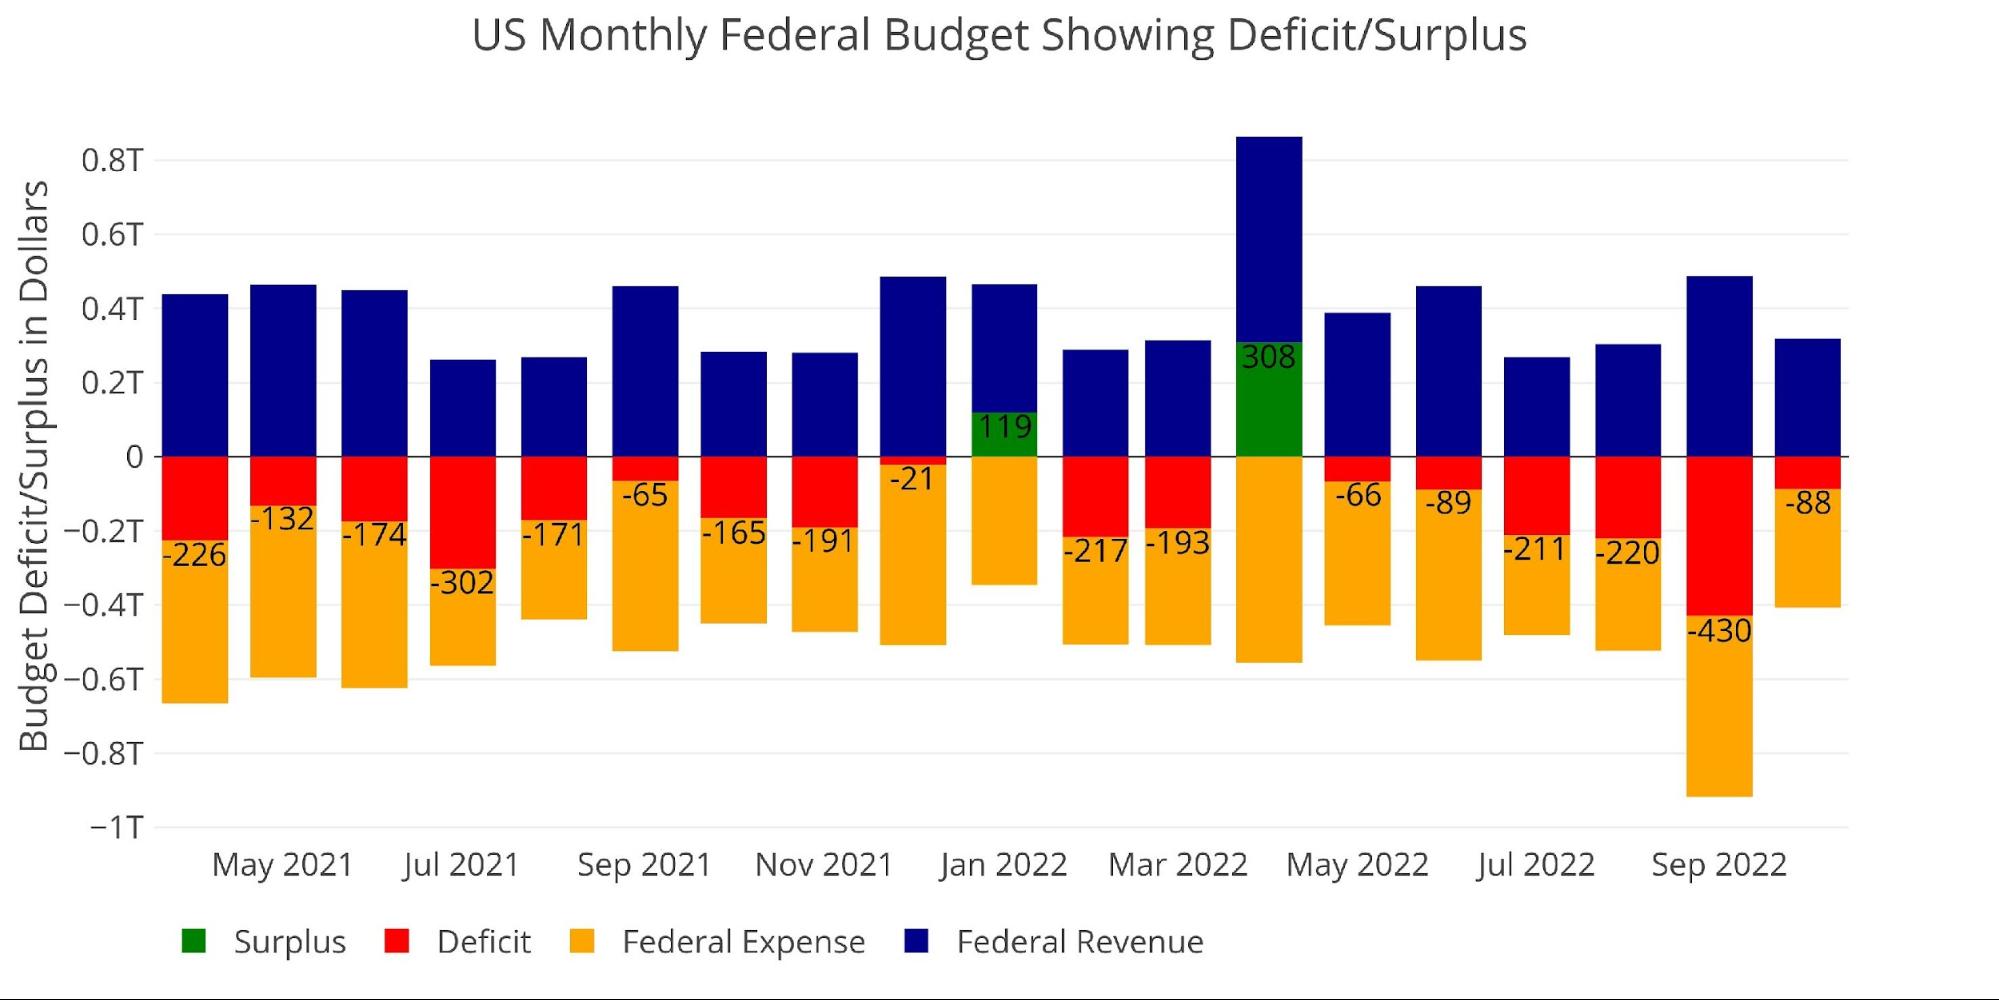
Figure: 1 Monthly Federal Budget
Looking historically at the month of October shows that this is actually the smallest October deficit since 2017. This is mainly due to revenues having increased 35% since 2017 and is even up 12% just since last October.
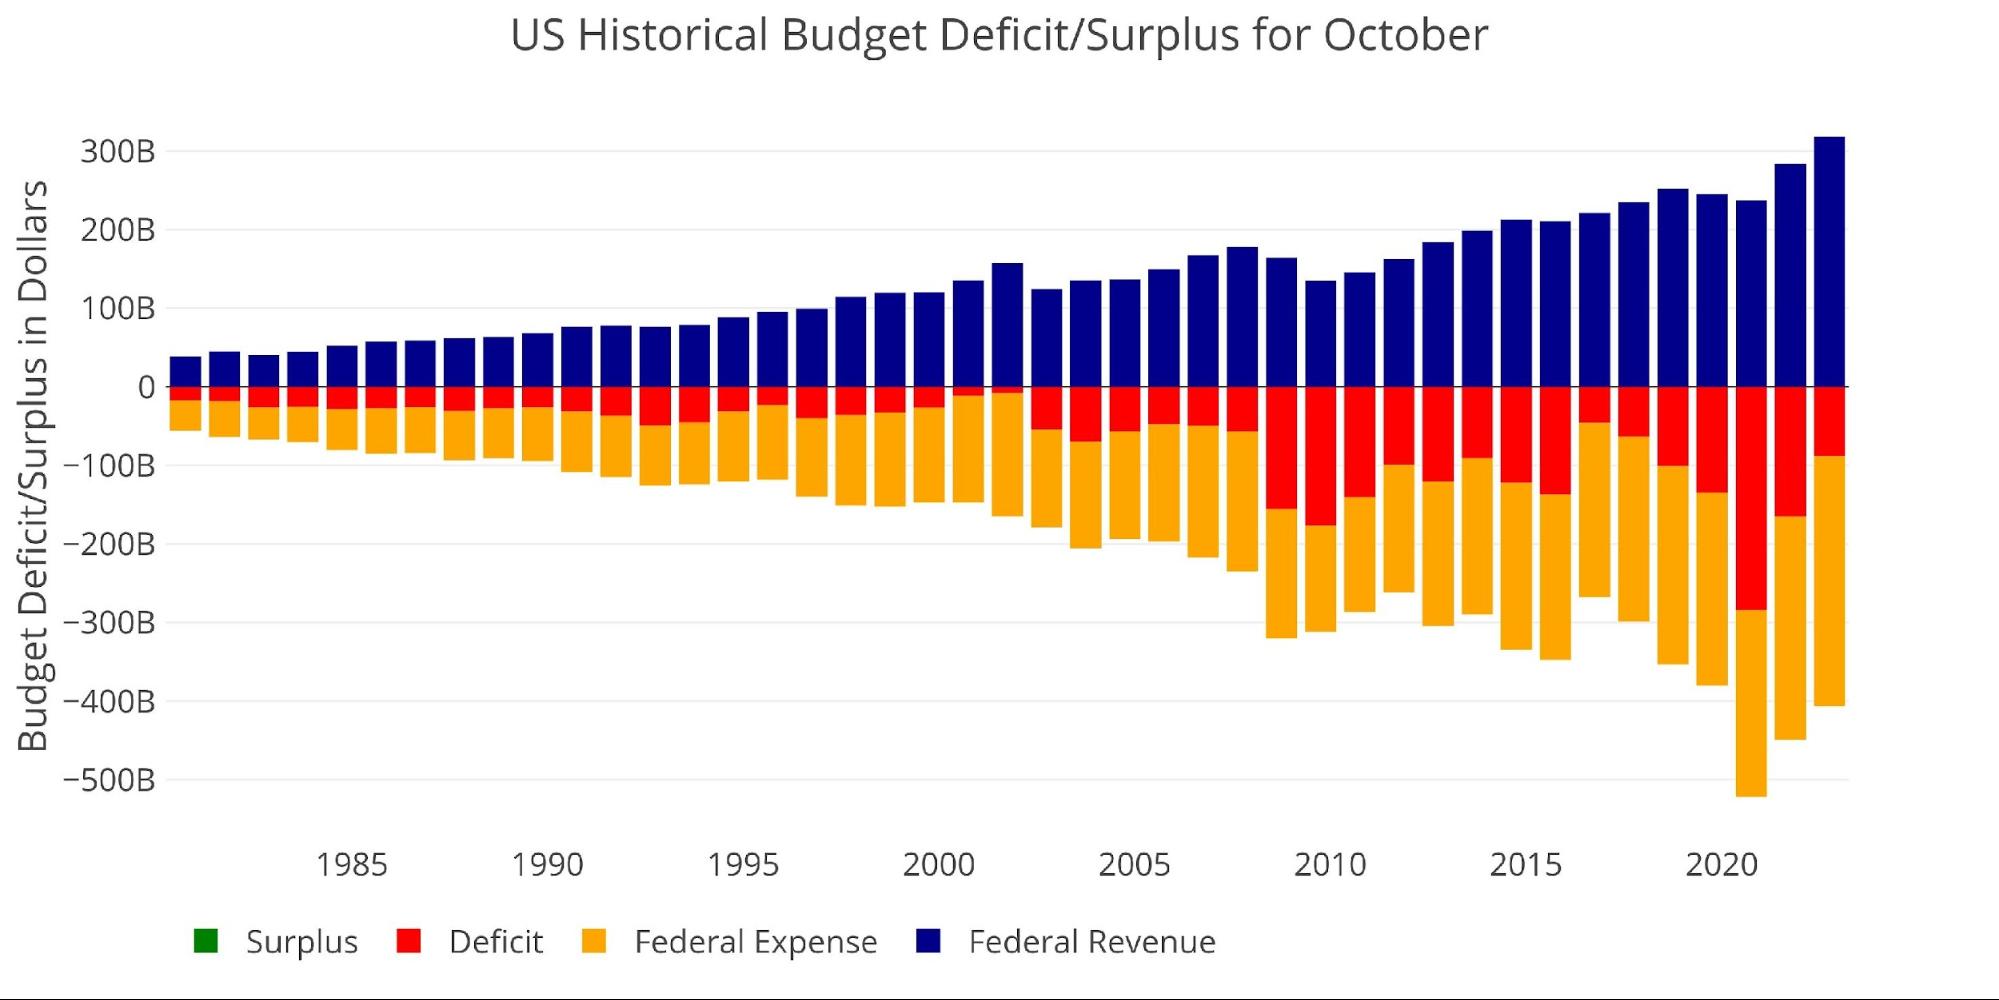
Figure: 2 Historical Deficit/Surplus for October
For the decade before Covid, this October was 18.5% below the average October of $108B.
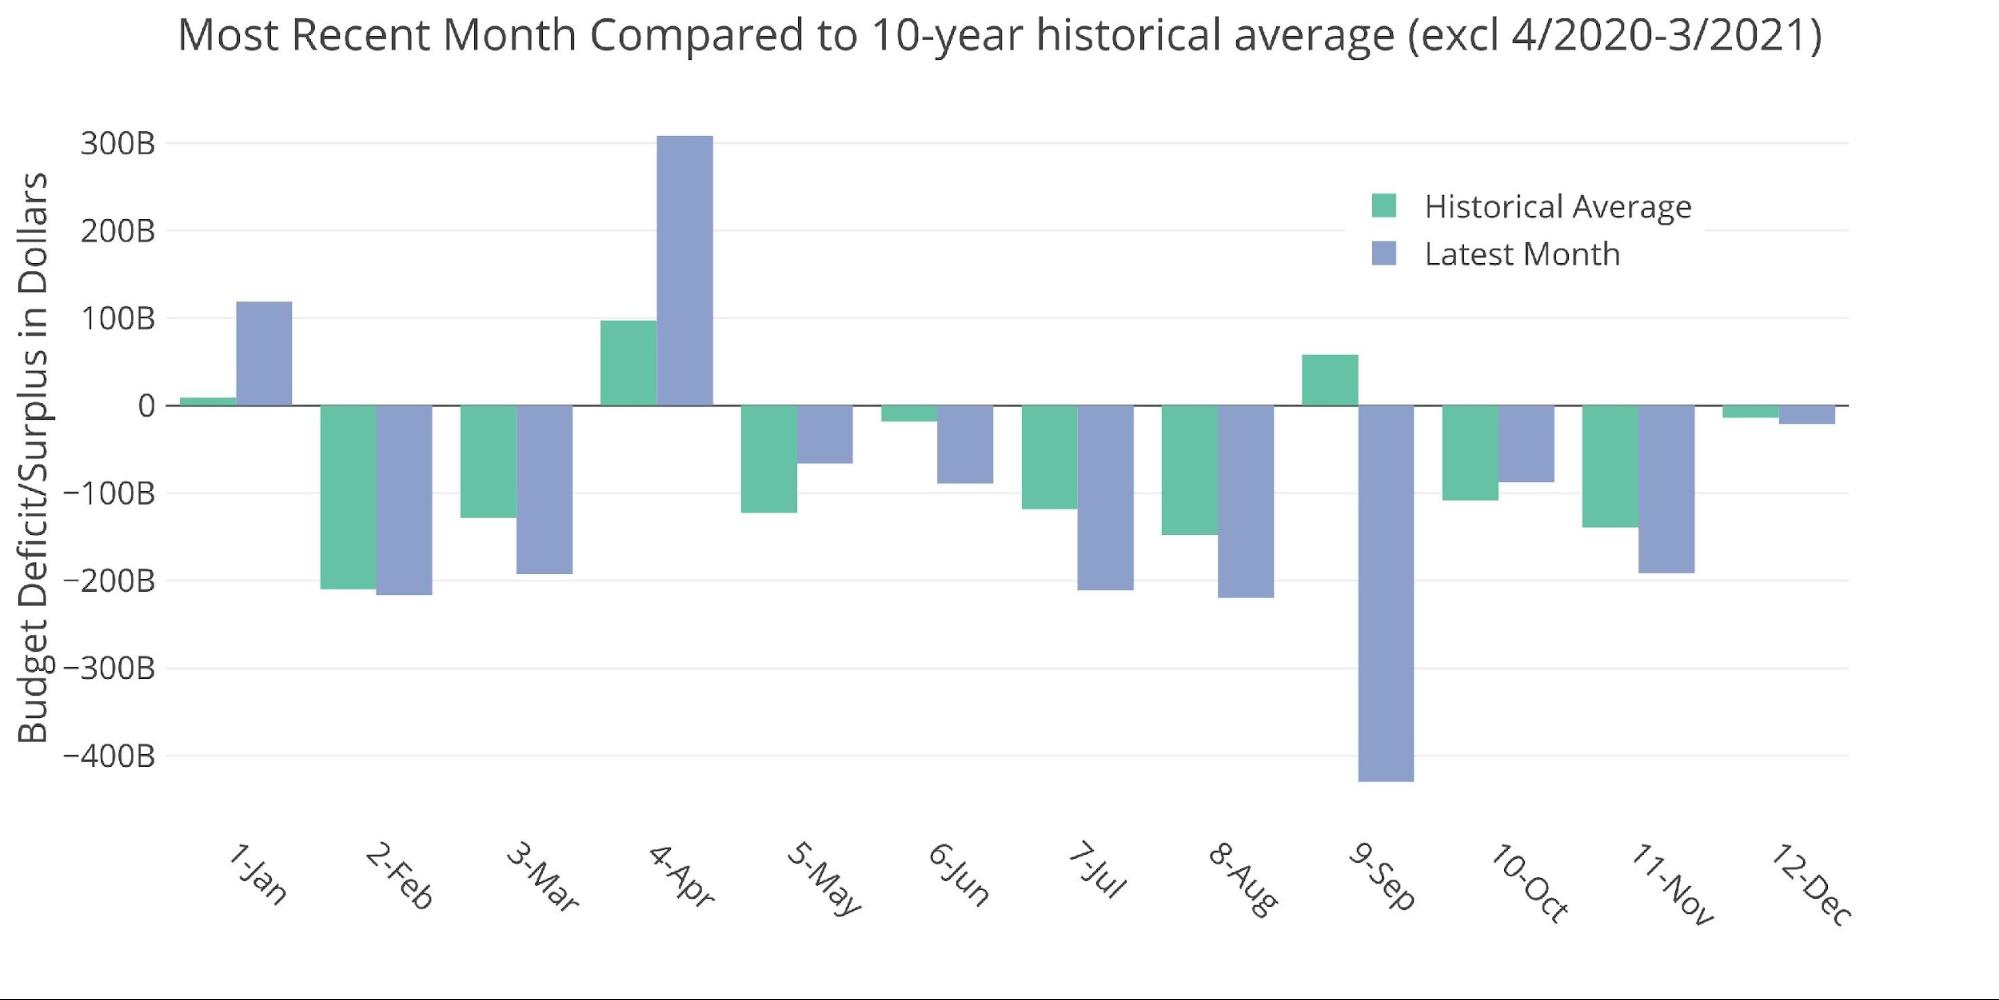
Figure: 3 Current vs Historical
The Sankey diagram below shows the distribution of spending and revenue. The Deficit represented 21% of total spending. More importantly, Net Interest represented 10.6% of total expenditures, which is up from only 6.6% last October.

Figure: 4 Monthly Federal Budget Sankey
Looking at the TTM, the Deficit was nearly the same relative size of October at 20.8% of total expenditures (vs 21.6%). Net Interest relative to all expenditures was 7.8%, up from only 5.2% a year ago. This represents a relative increase of 50% in one year!
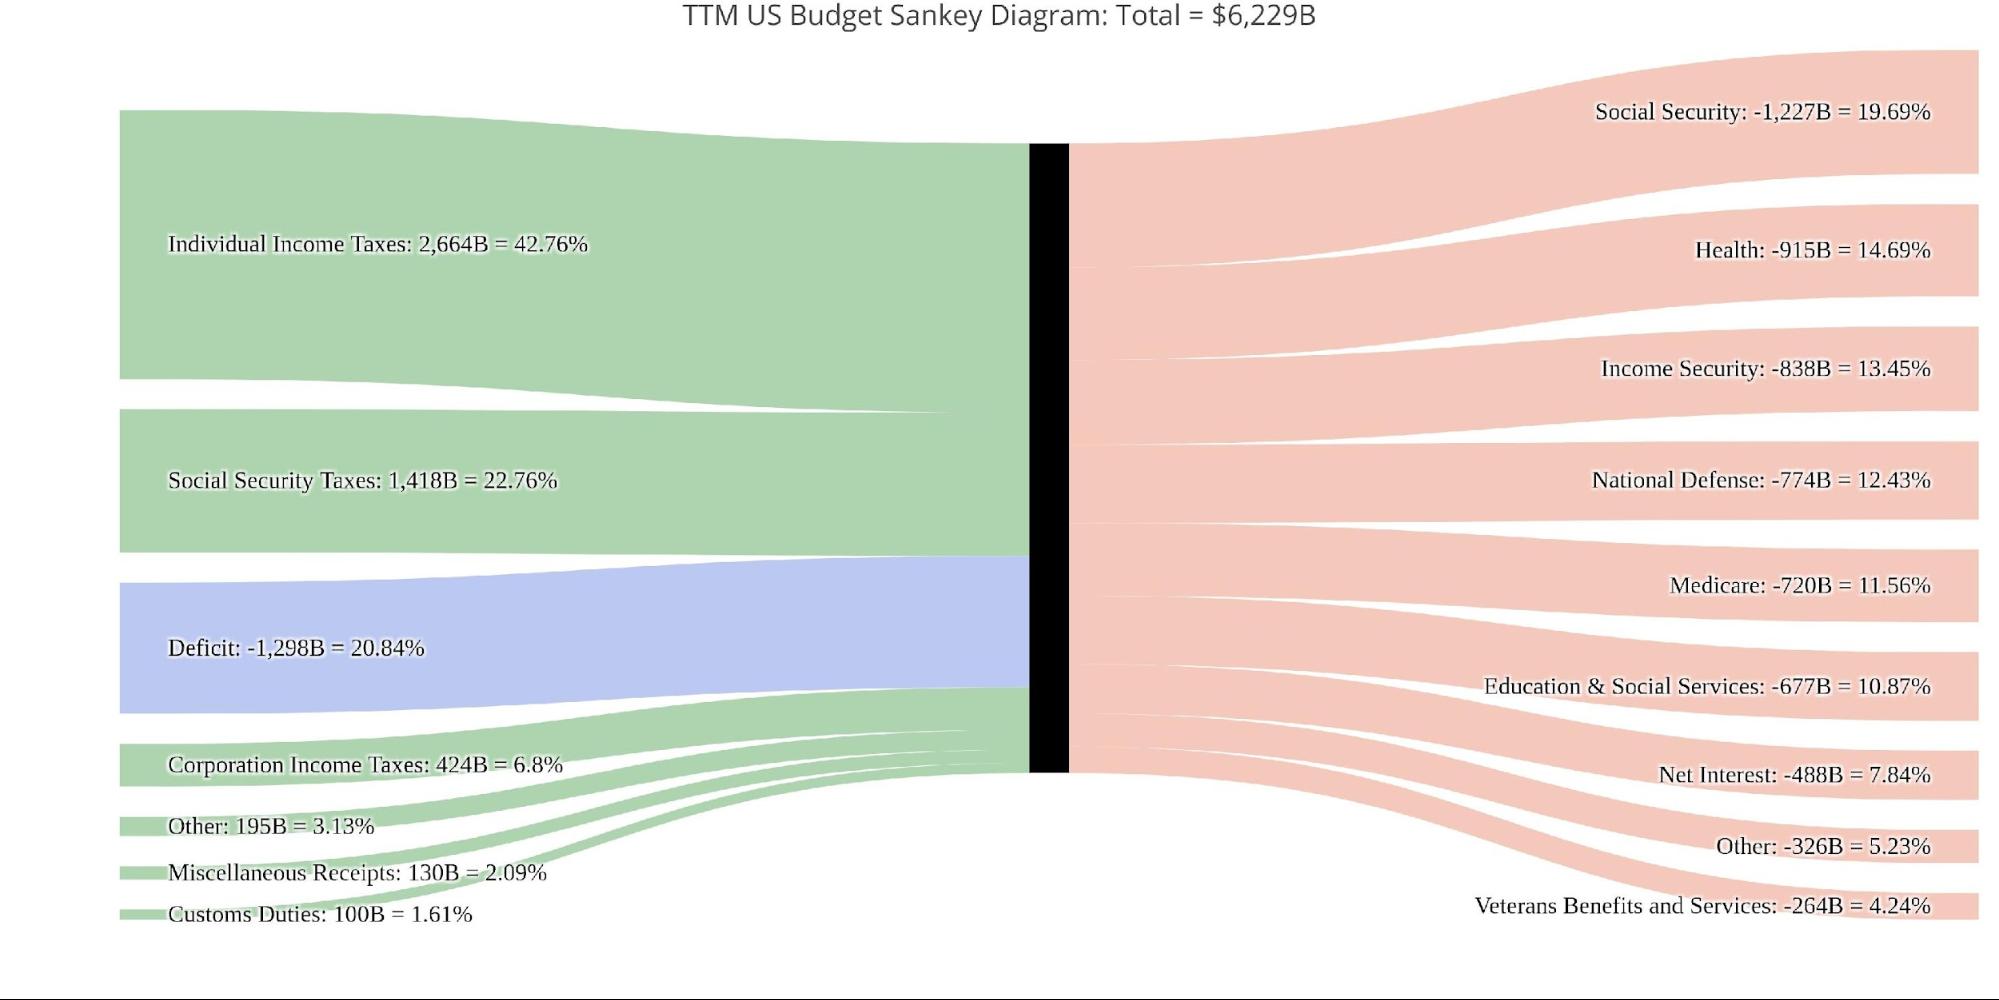
Figure: 5 TTM Federal Budget Sankey
Total revenue fell MoM, as Corporate Taxes dropped. Corporate Tax revenue is fairly volatile MoM as shown below.
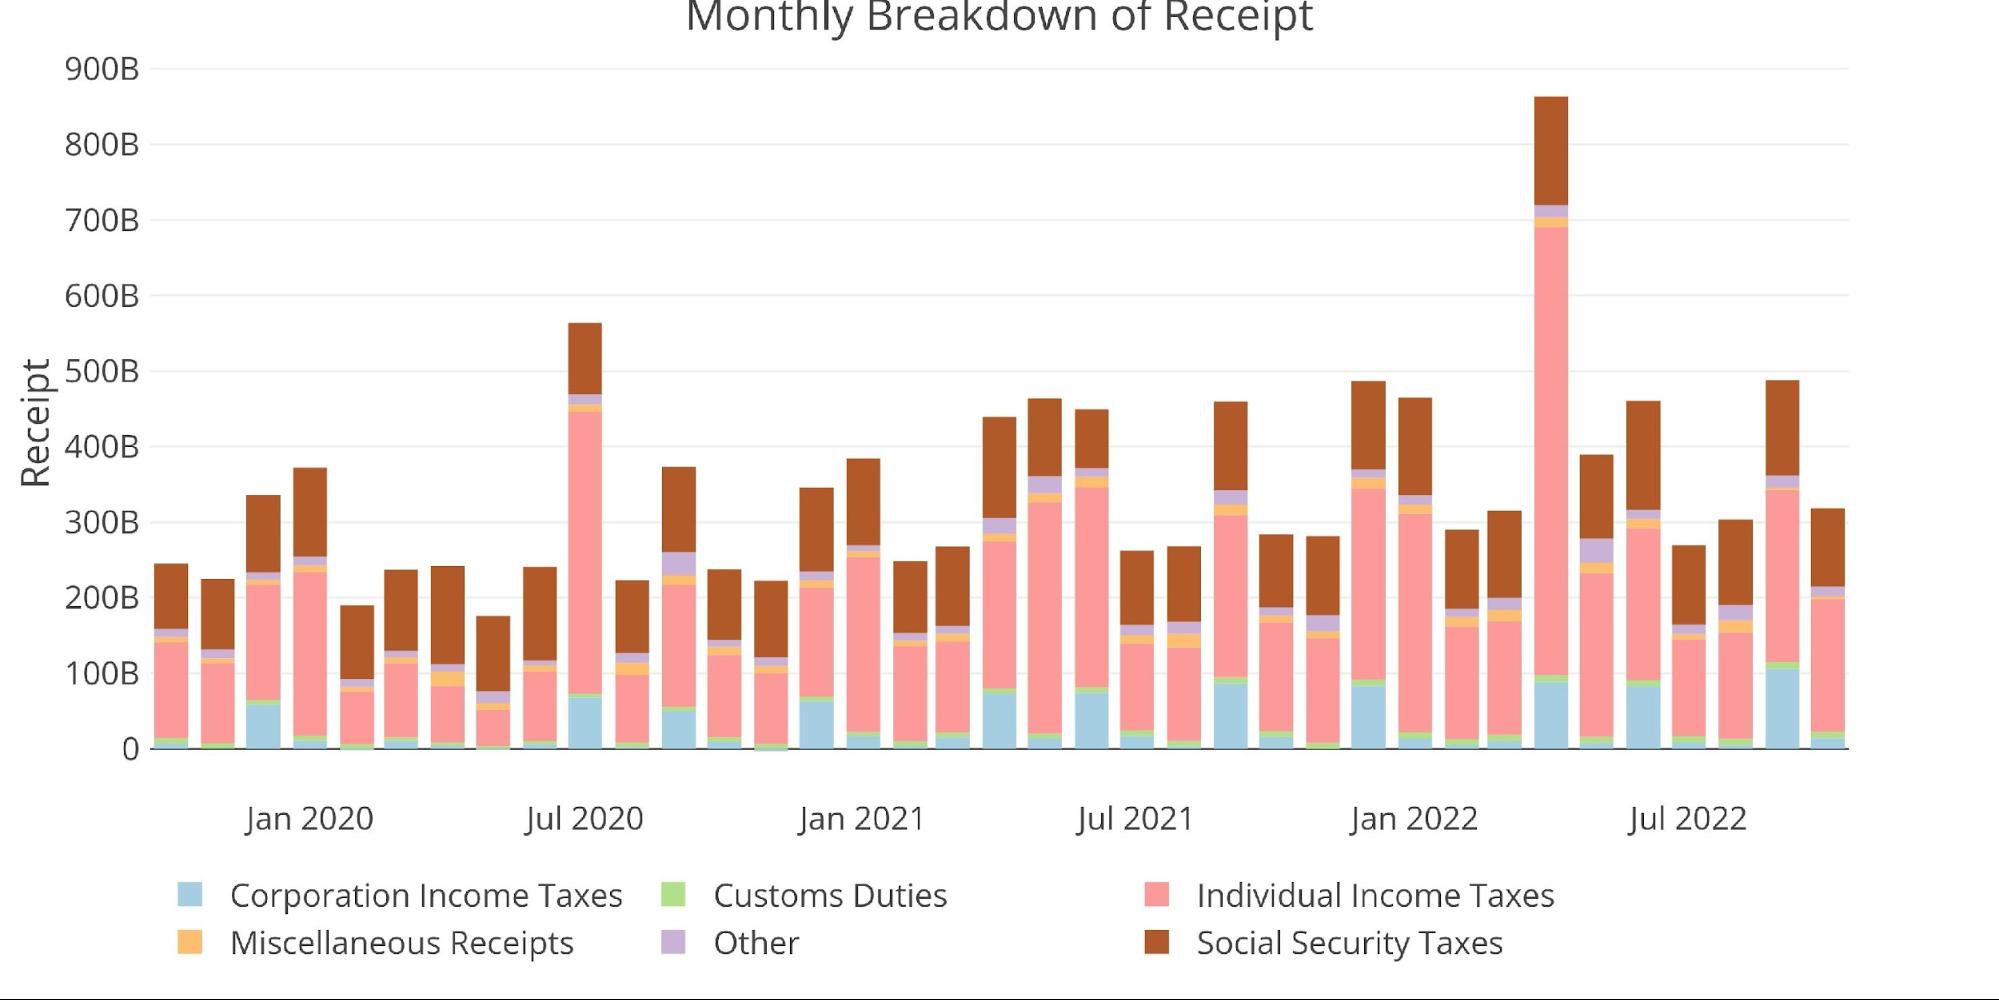
Figure: 6 Monthly Receipts
Total Expenses fell quite a bit this month, even compared to August and other months in 2022. October was the smallest expenditure month since January, and the second smallest going back to November 2020.
Ignoring the September Education expense, the fall in Spending this month was primarily driven by a drop in Medicare (-$103B in September vs -$18B this month) and Veterans Benefits (-$35B to -$11B).
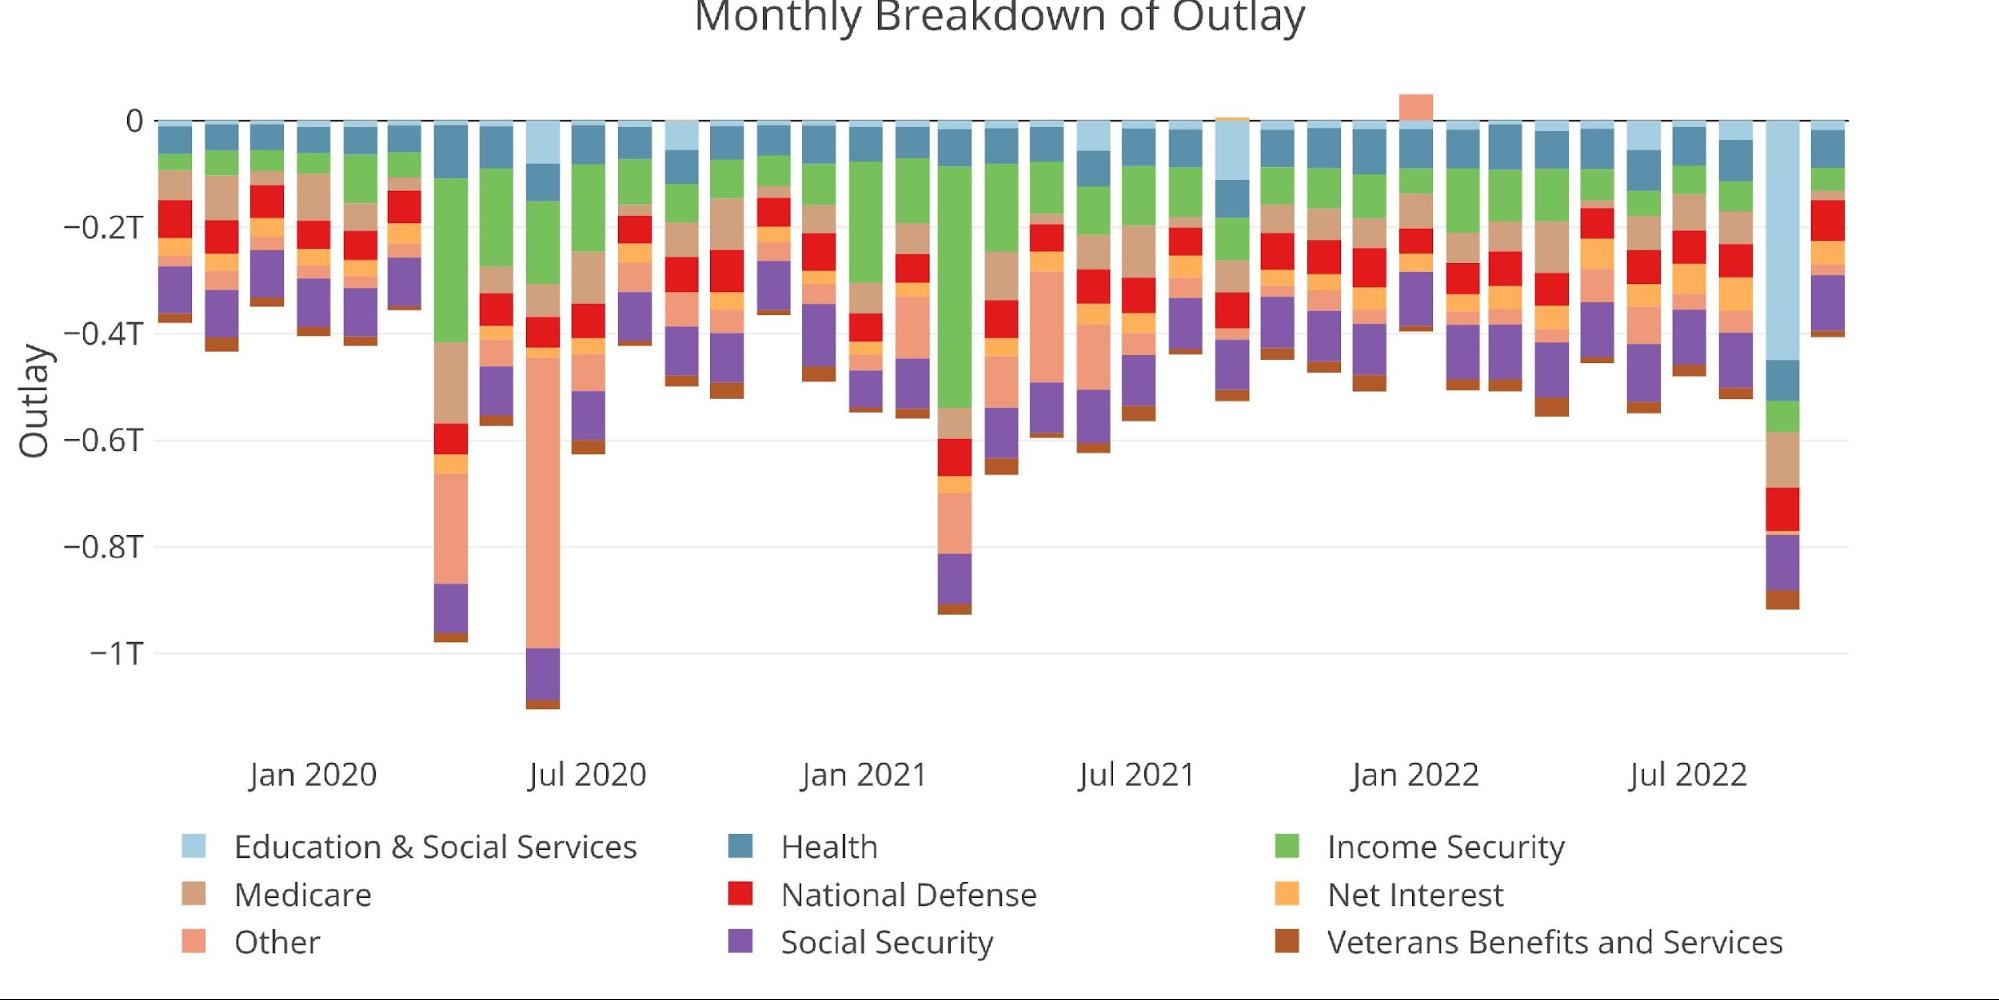
Figure: 7 Monthly Outlays
As mentioned above, the real issue facing the Federal Government right now is the massive increase in Interest Expense. The chart below shows the TTM total Net Interest expense. TTM expenses increased $12B since last month and are up an incredible $139B since last October or 40%.
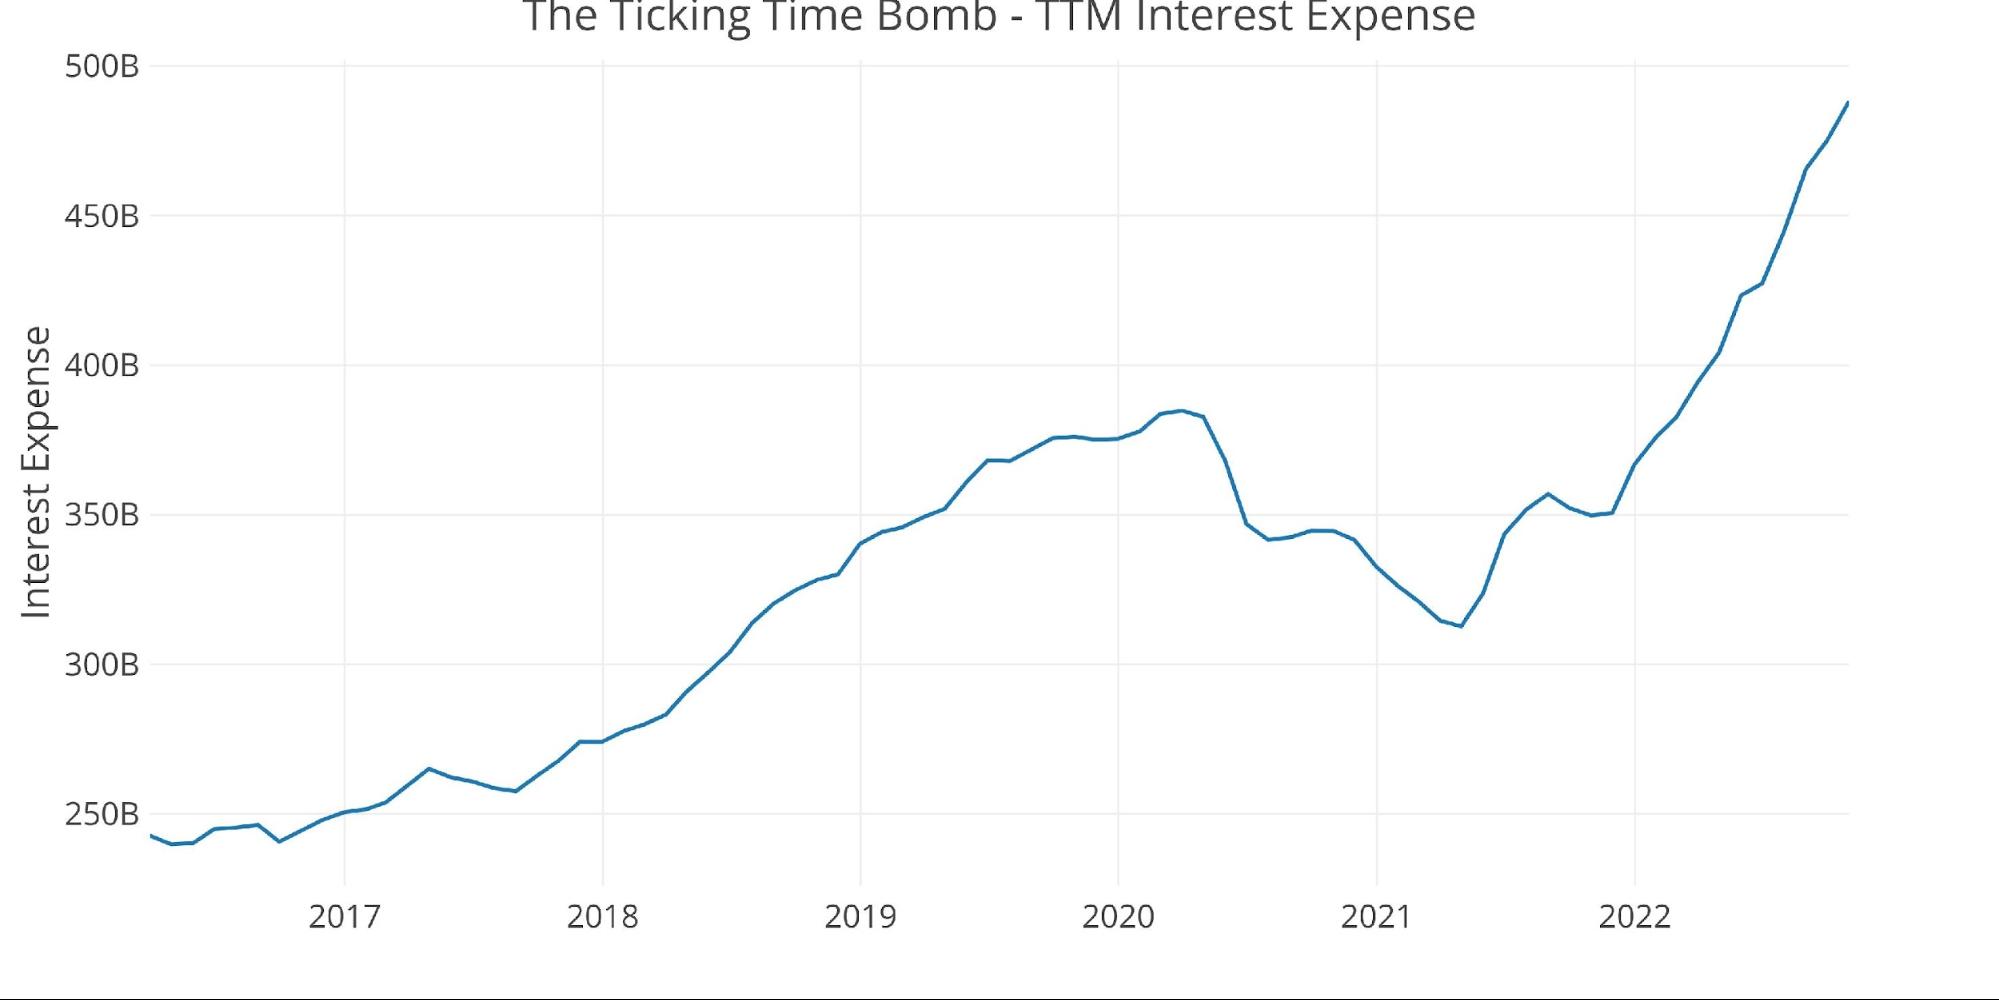
Figure: 8 TTM Interest Expense
The table below goes deeper into the numbers of each category. The key takeaways from the charts and table:
Outlays
-
- Compared to the TTM average, most expenses were down in October except for Social Security (+2.2%), National Defense (+18.6%), and Net Interest (+5.7%)
- That said, compared to last October, most expenses have increased, specifically Net Interest which is up 43.8%
- On a TTM basis, most expenses are up quite significantly except for Income Security and Other
Receipts
-
- Most Receipts were up MoM, but all were down compared to the TTM Average
-
- This is most likely a result of the ongoing Recession
-
- on a TTM basis, Individual Tax Receipts are still up an incredible 28%
- Most Receipts were up MoM, but all were down compared to the TTM Average
Total
-
- The Total TTM Deficit was still $1.3T despite falling 51% since last year
- Receipts were up 20% on a TTM basis vs a fall in spending by 7.7%
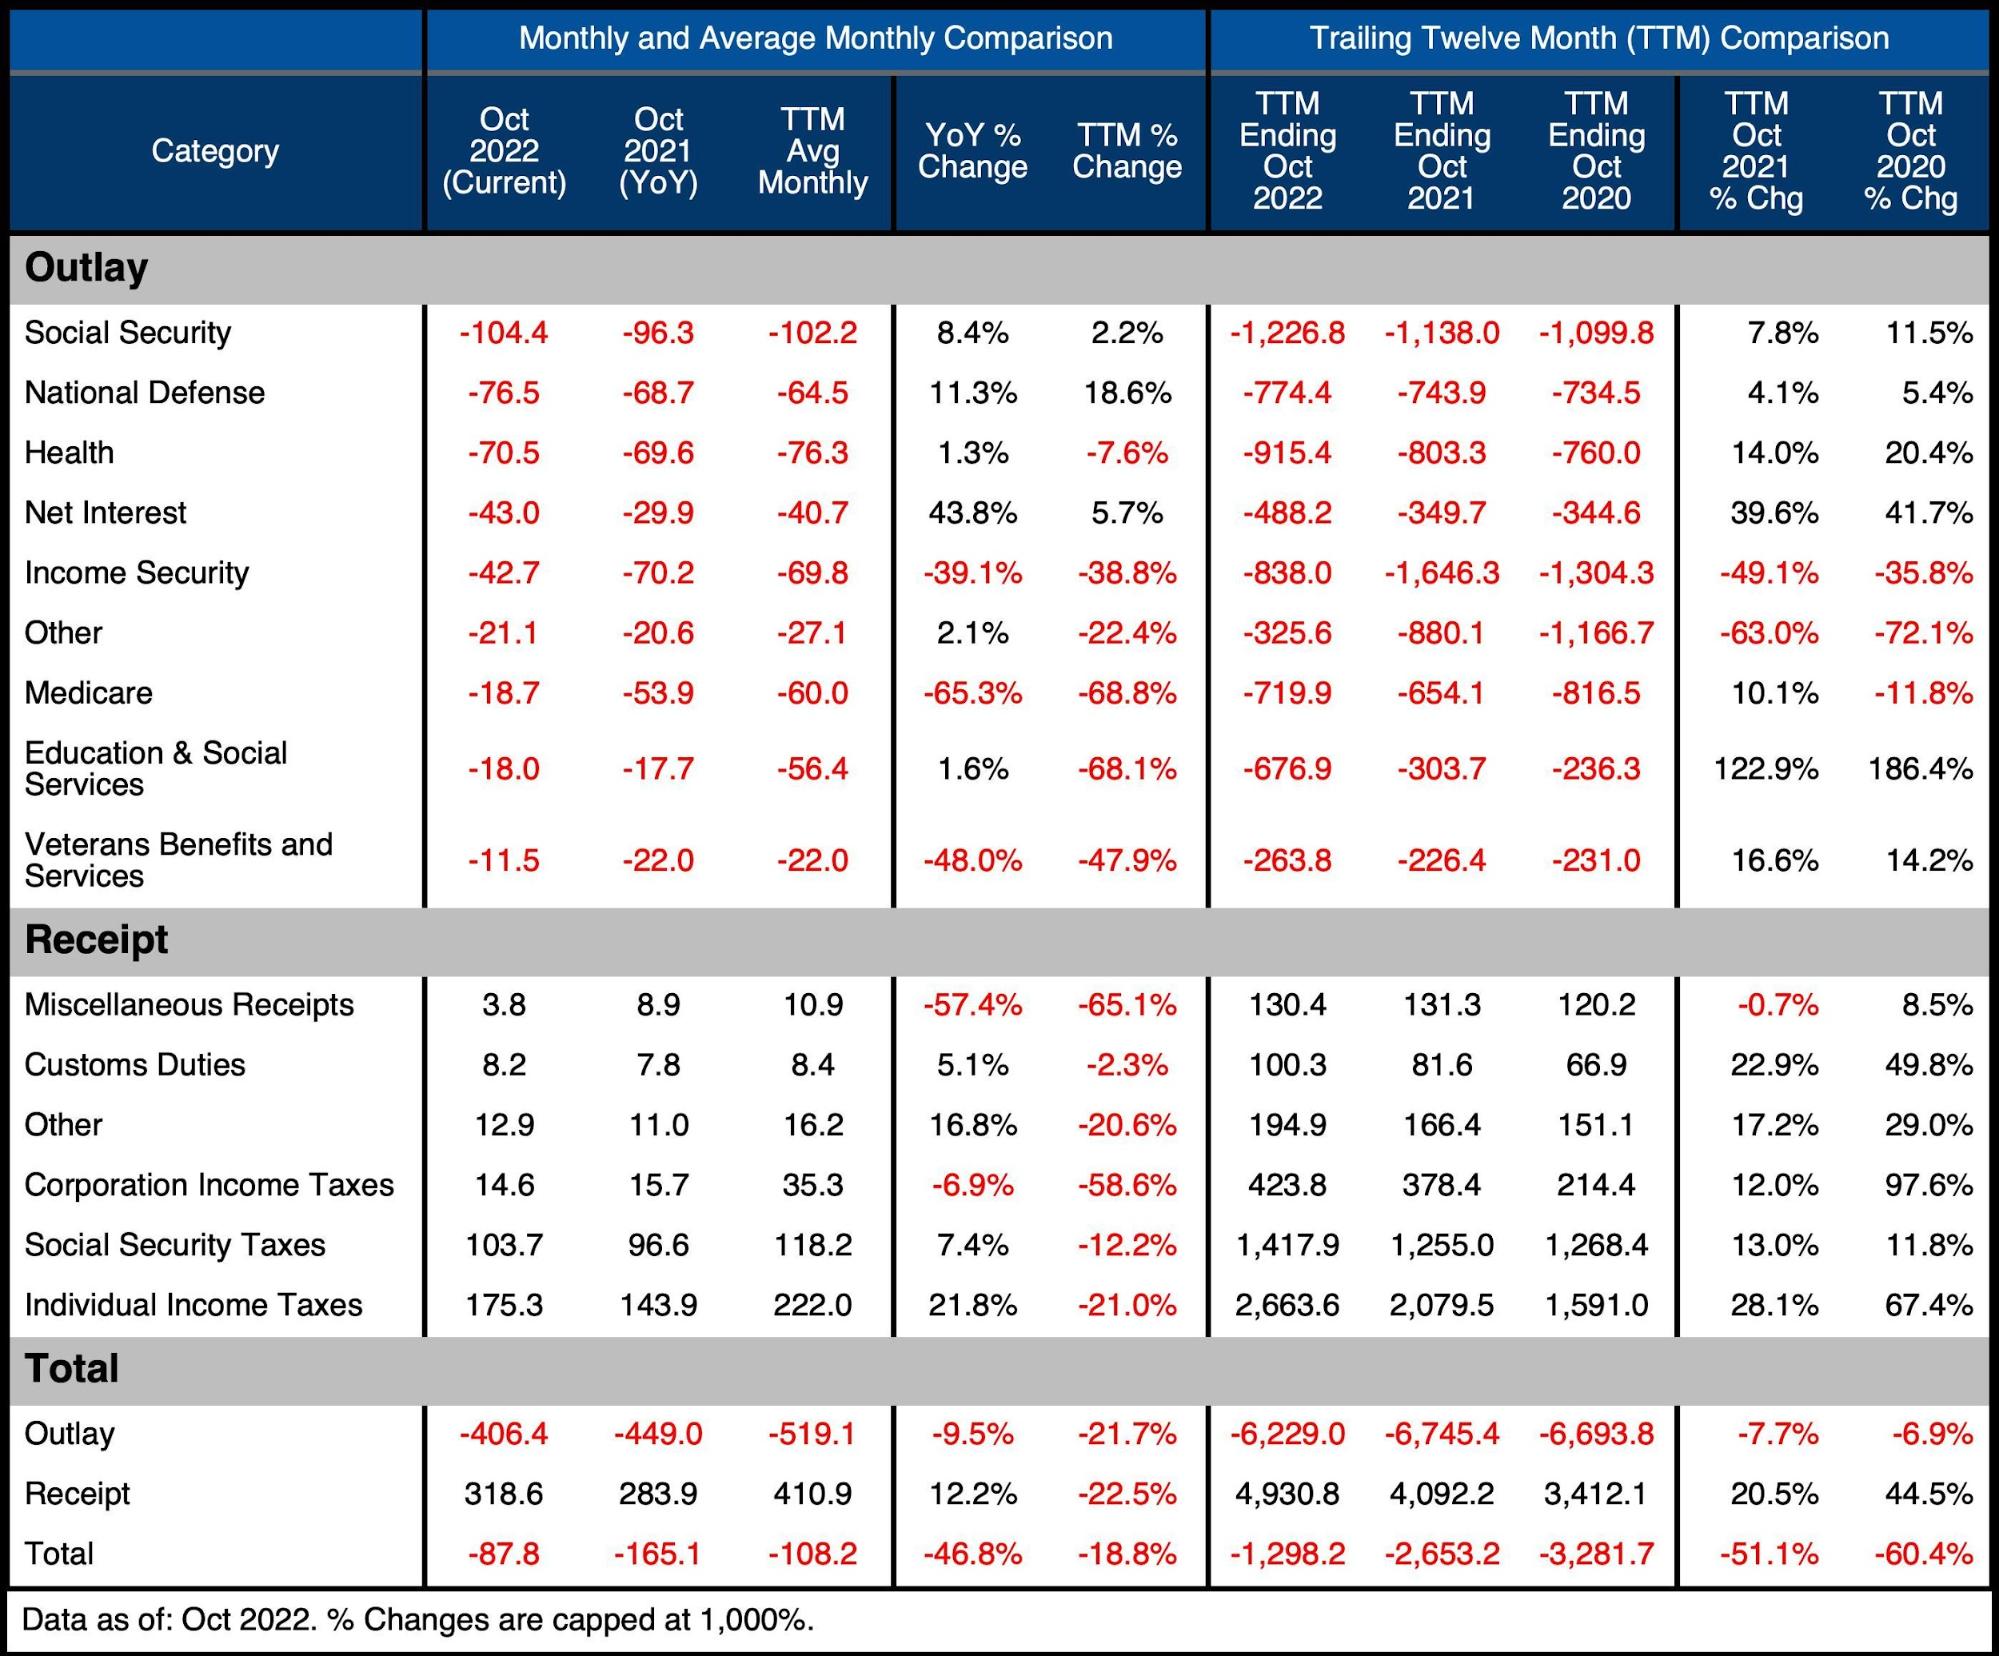
Figure: 9 US Budget Detail
Historical Perspective
Zooming out and looking over the history of the budget back to 1980 shows a complete picture. It shows how a new level of spending has been reached that is being supported by a major surge in tax revenues. What happens if these revenues evaporate in a recessionary environment?
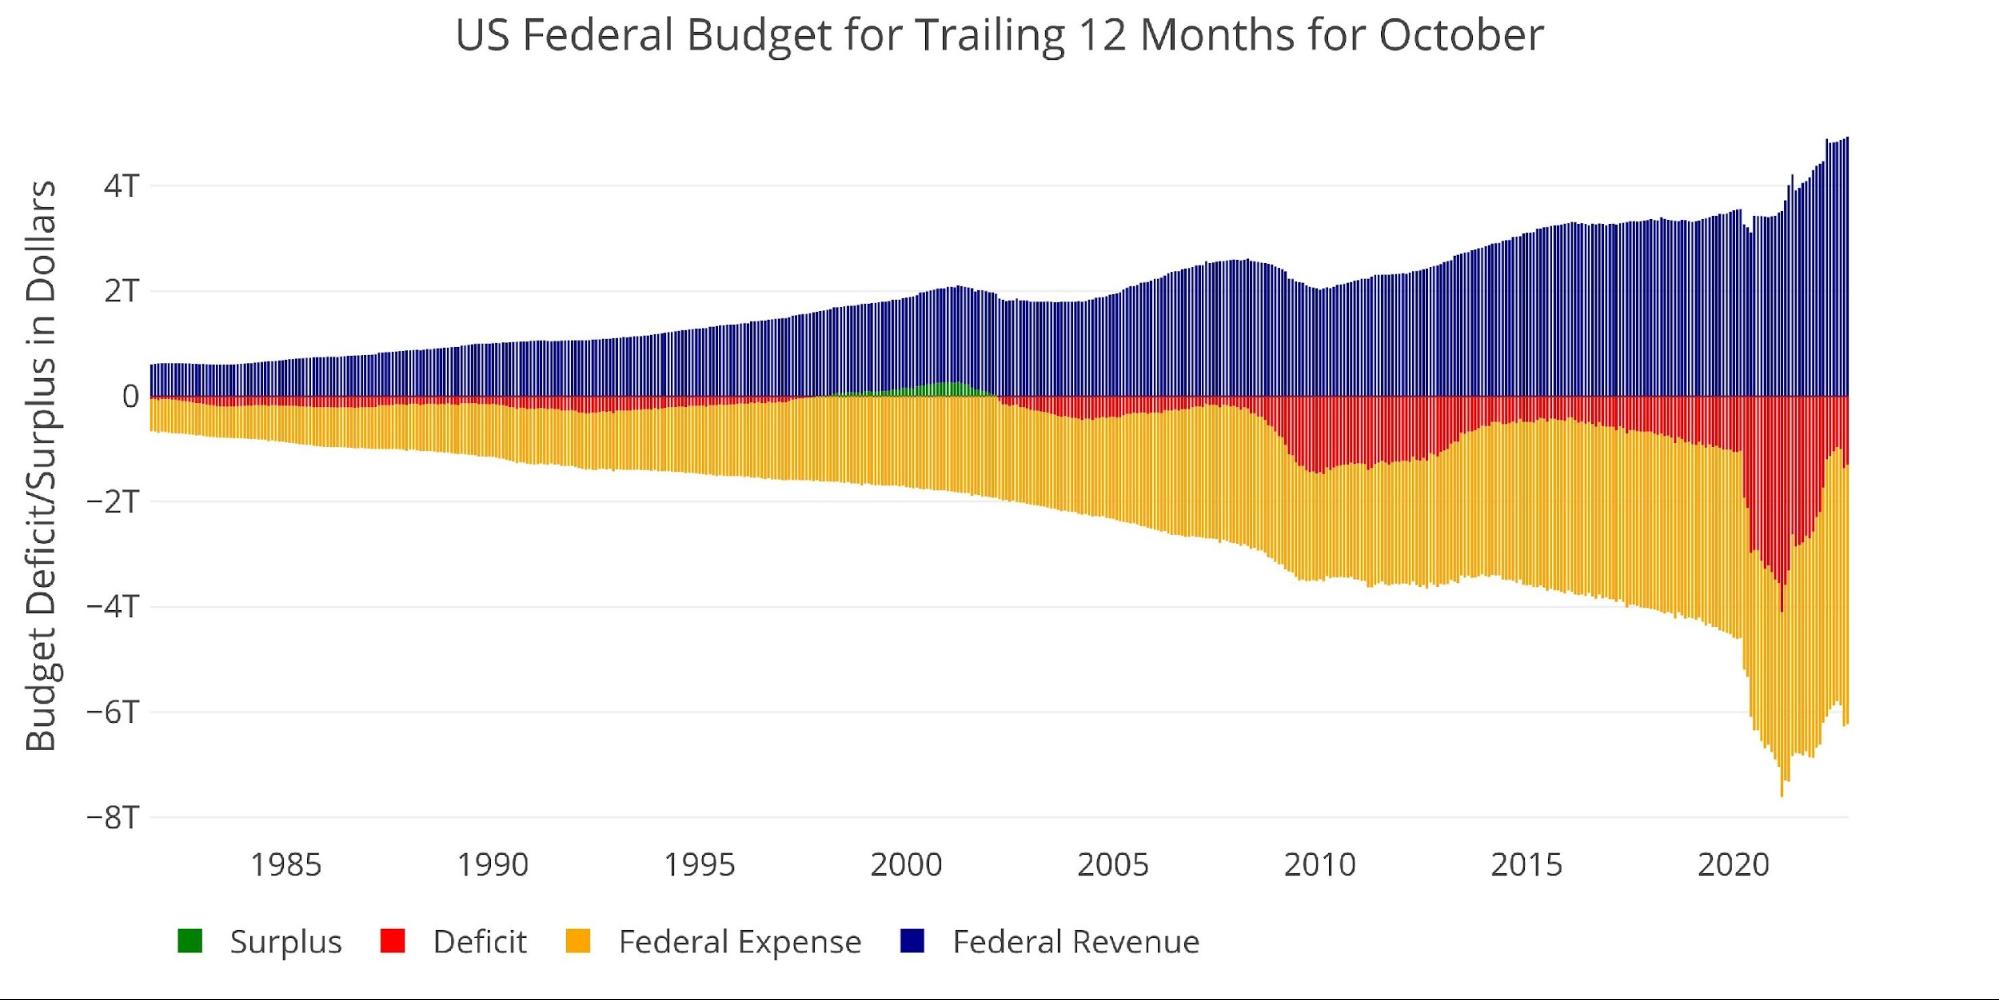
Figure: 10 Trailing 12 Months (TTM)
The next two charts zoom in on the recent periods to show the change when compared to pre-Covid.
As shown below, total Receipts have surged higher in recent years. The current 12-month period is $1.52T bigger than 2020. Individual Taxes make up the vast majority of the difference, with 2022 exceeding 2020 and 2019 by more than $1T.

Figure: 11 Annual Federal Receipts
Unfortunately, the major windfall from this tax revenue surge is being consumed by massive spending. The 2022 Spending was more than $2T larger than the 2018 spending!
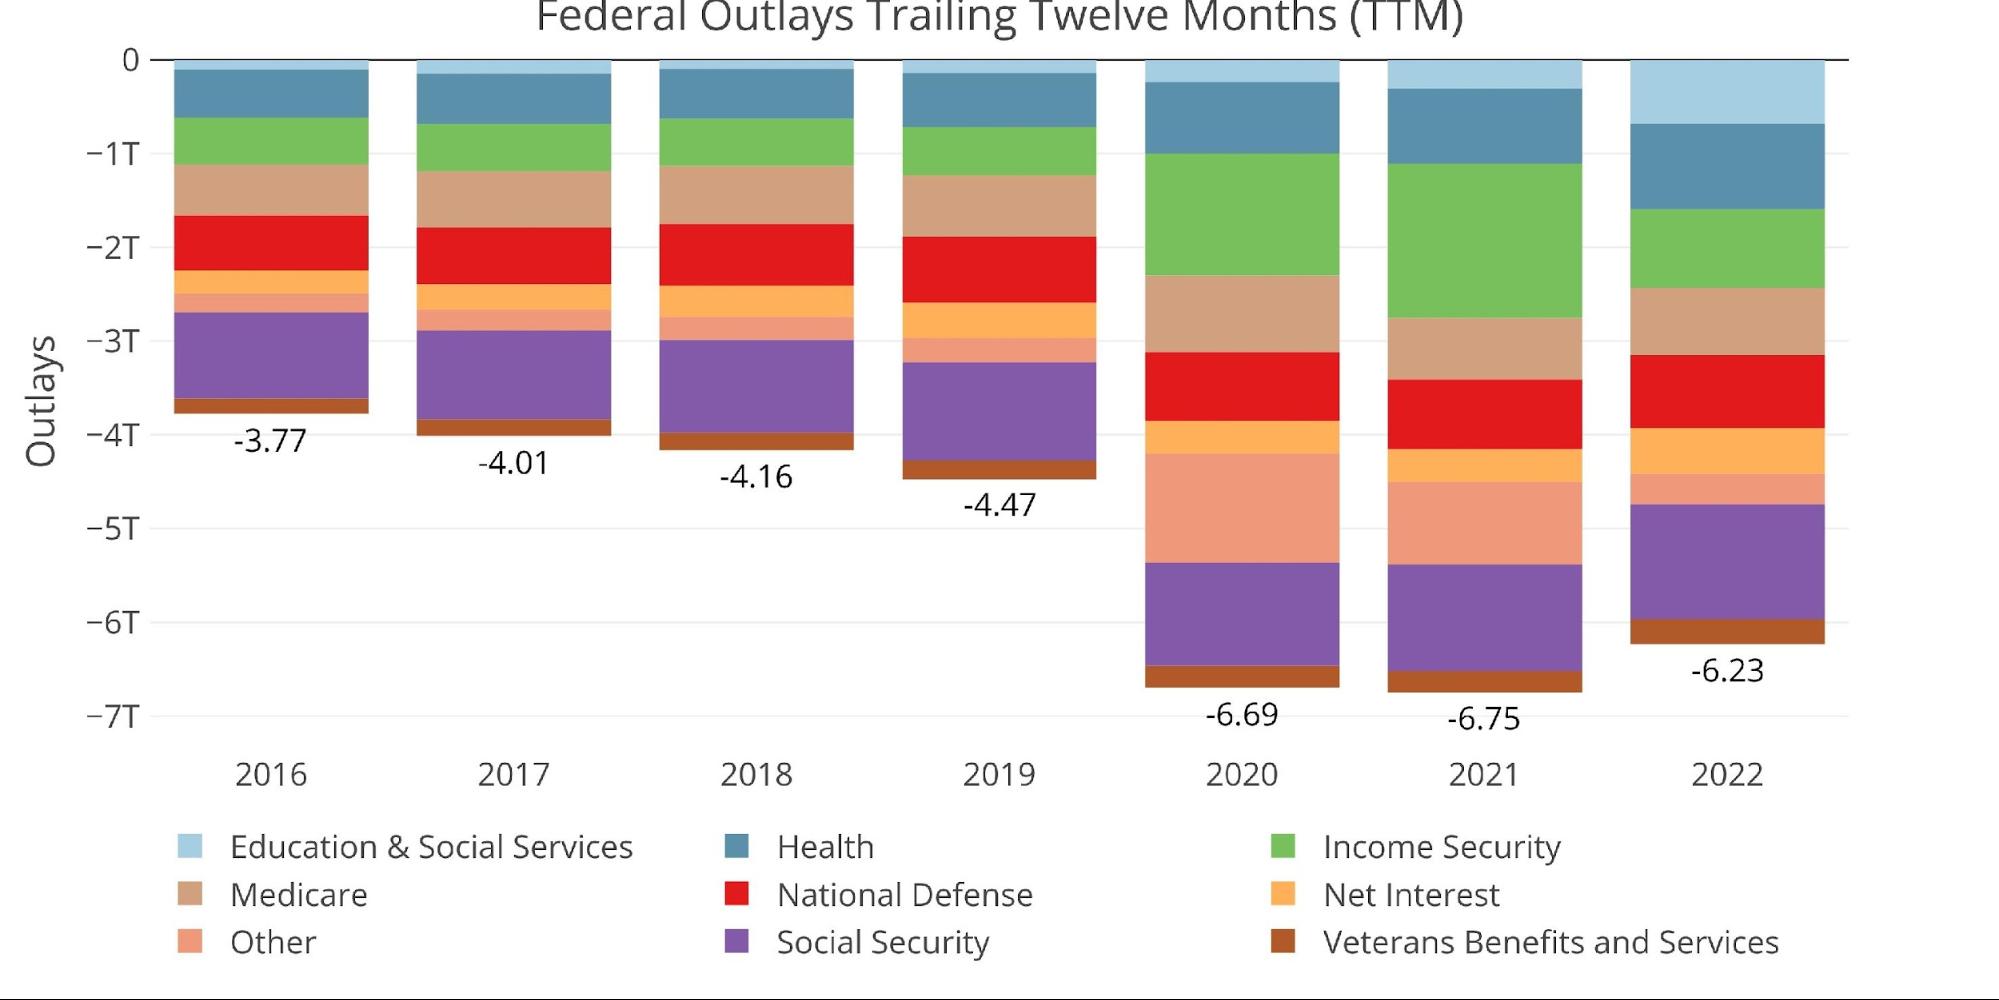
Figure: 12 Annual Federal Expenses
Despite massive expenditures driving huge deficits, the deficit is down YoY as mentioned above. This has brought the TTM Deficit compared to GDP down to pre-Covid levels of 5.1%.
Note: GDP Axis is set to log scale
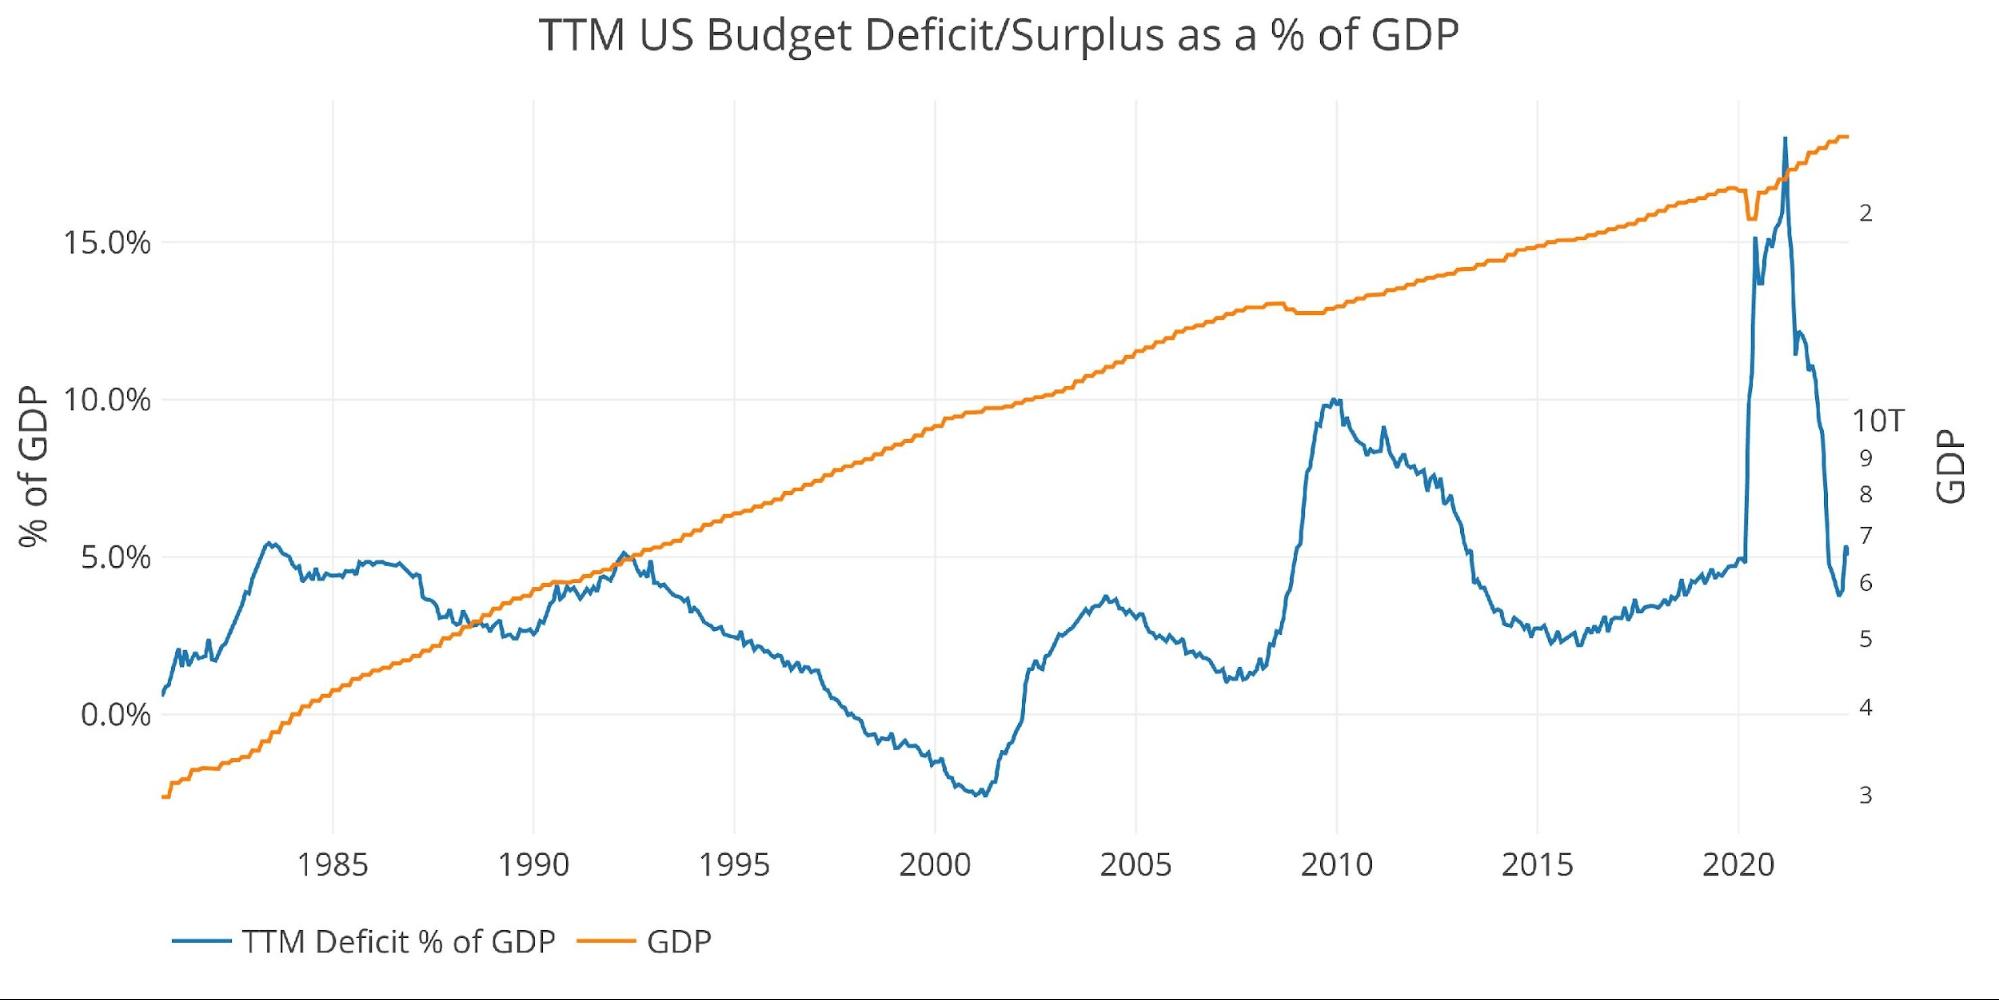
Figure: 13 TTM vs GDP
Finally, to compare the calendar year with previous calendar years (not fiscal budget years), the plot below shows the YTD numbers historically. The current year’s deficit sits only behind 2009, 2020, and 2021.
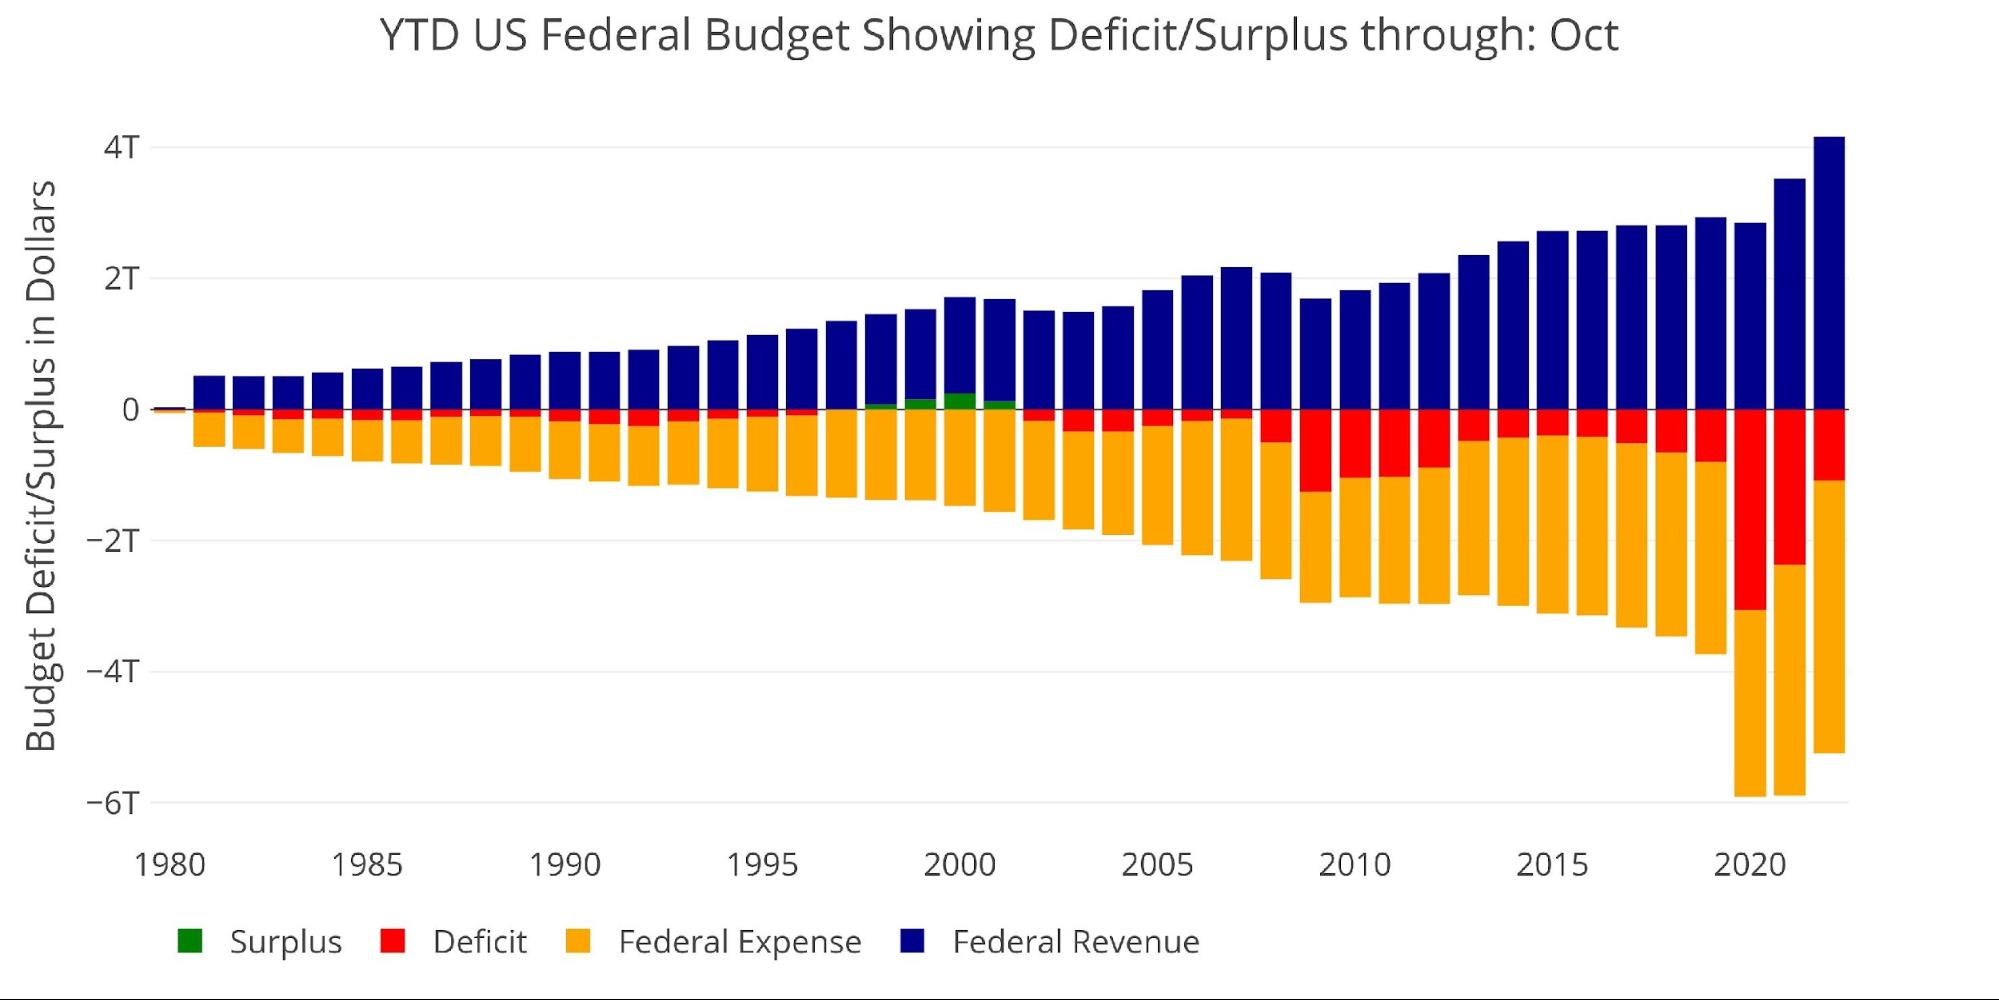
Figure: 14 Year to Date
Wrapping Up
The Treasury is hitting a perfect storm of bad outcomes right now. Tax Revenues have surged in recent years, but that windfall seems to be slowing or reversing as shown in the table above where Revenue is below the TTM average in every single category. This should be watched over the coming months as it could lead to huge deficits if the trend continues.
At the same time, the government has hit a new level of spending that is being made worse by surging costs on Net Interest. A deficit of $1.3T is massive! This has led to a large increase in debt issuance, reaching $1.6T YTD!
If tax revenues start to fall due to the recession as spending increases, the Treasury will quickly find itself running deficits that exceed $2T again. This is completely unsustainable if interest rates remain high. This is why the Fed will pivot. The recent inflation report is being interpreted as soft enough to give the Fed cover to begin the pivot. When this goes from speculation to fact, expect gold and silver to see another surge. Just in the past week, gold has seen three $40+ moves. This is a preview of what will be seen when the Fed does pivot. Make no mistake, given the current Federal Budget, it has no other choice.
Data Source: Monthly Treasury Statement
Data Updated: Monthly on eighth business day
Last Updated: Period ending Oct 2022
US Debt interactive charts and graphs can always be found on the Exploring Finance dashboard: https://exploringfinance.shinyapps.io/USDebt/

Call 1-888-GOLD-160 and speak with a Precious Metals Specialist today!
Buka akaun dagangan patuh syariah anda di Weltrade.
Source link