Please note: the CoTs report was published 12/02/2022 for the period ending 11/29/2022. “Managed Money” and “Hedge Funds” are used interchangeably.
Gold
On November 15th, Managed Money reversed back to a net long position of 25k contracts after spending 4 weeks net short. Since then, net longs have fallen some in the last two weeks to reach 14k in the most recent reporting period.
The reporting period occurred before the soft Powell pivot earlier this week which prompted a major push up in the price of gold to above $1800. It’s very likely that the COTs report next week will show a greater net long position in gold.

Figure: 1 Net Position by Holder
As shown in the chart below the Managed Money group continues to have complete control over this market, maintaining a correlation of price to a net position of 0.95 for 2022.
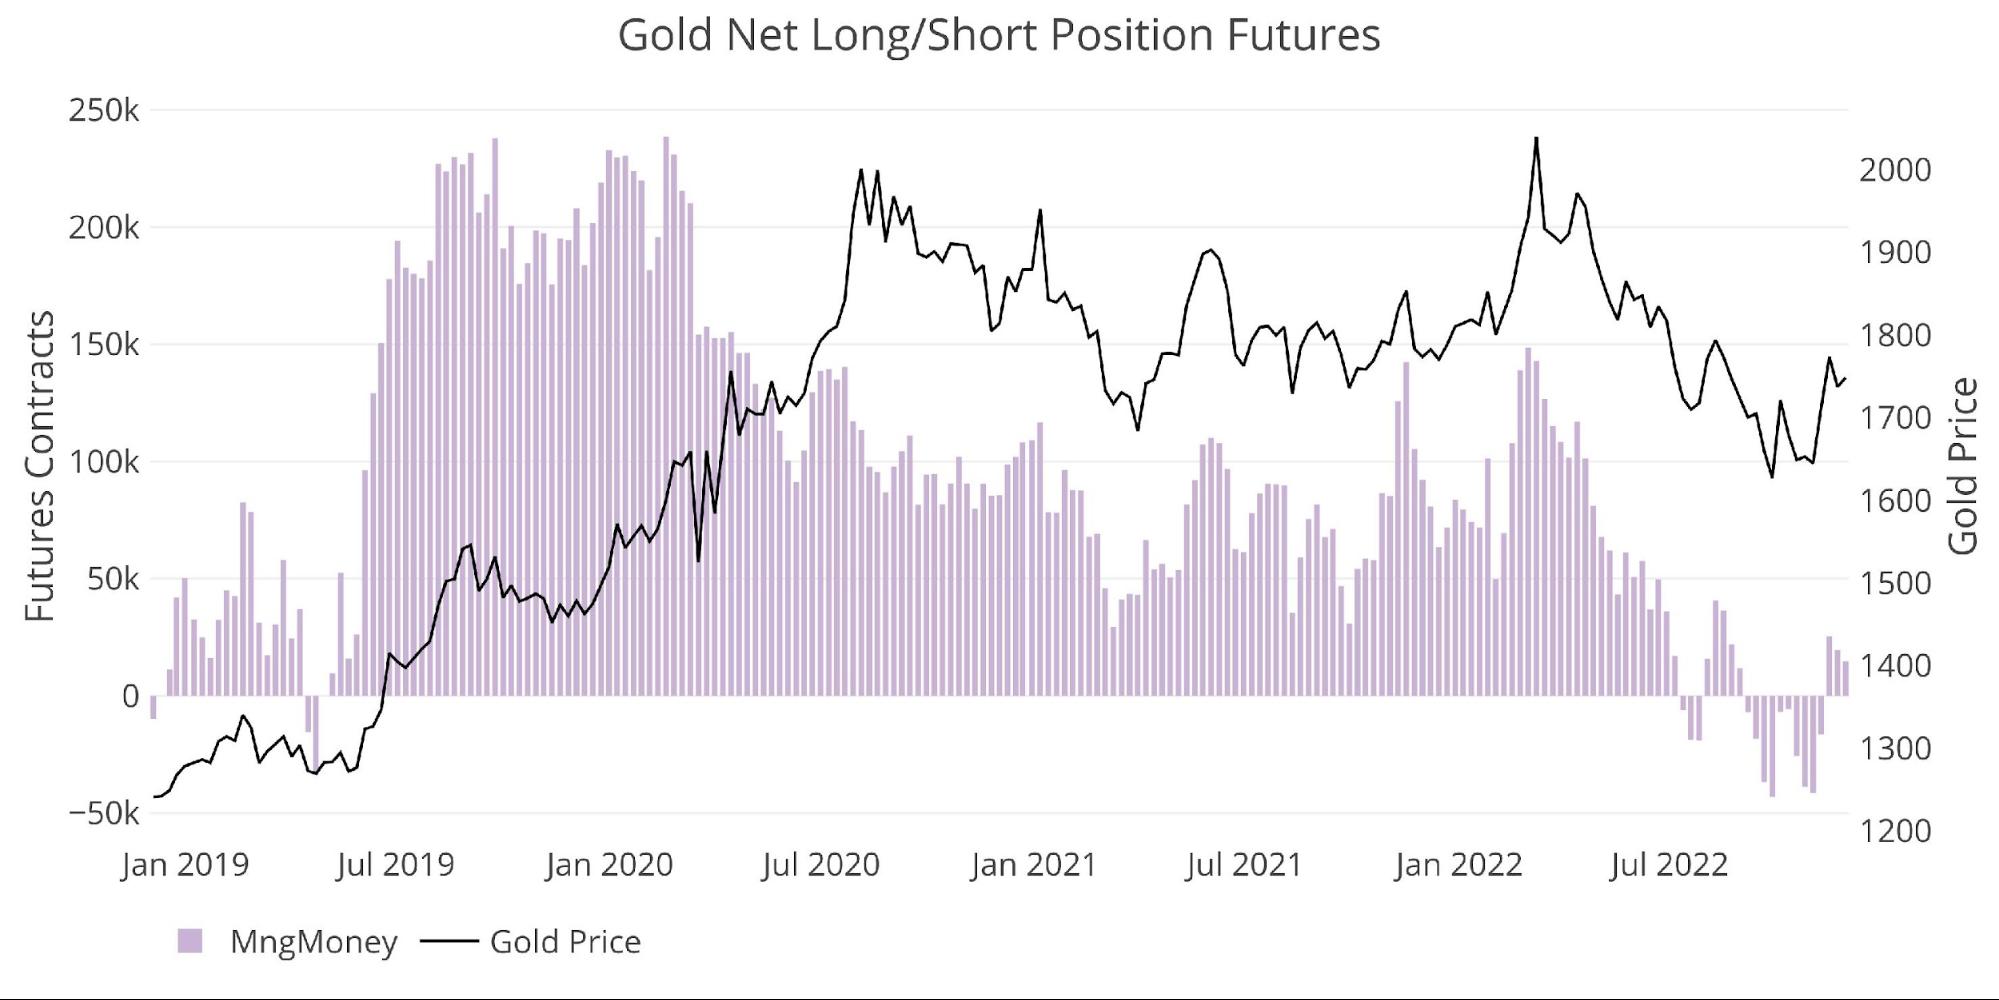
Figure: 2 Managed Money Net Position
Weak Hands at Work
The chart below shows the weekly data. The report last month highlighted the extreme selling of gold contracts by Managed Money, noting that only 8 of the previous 26 weeks had been net adds. Given the last two weeks shown below, it seems Managed Money is still a little hesitant to jump fully onto the bull side of this market.
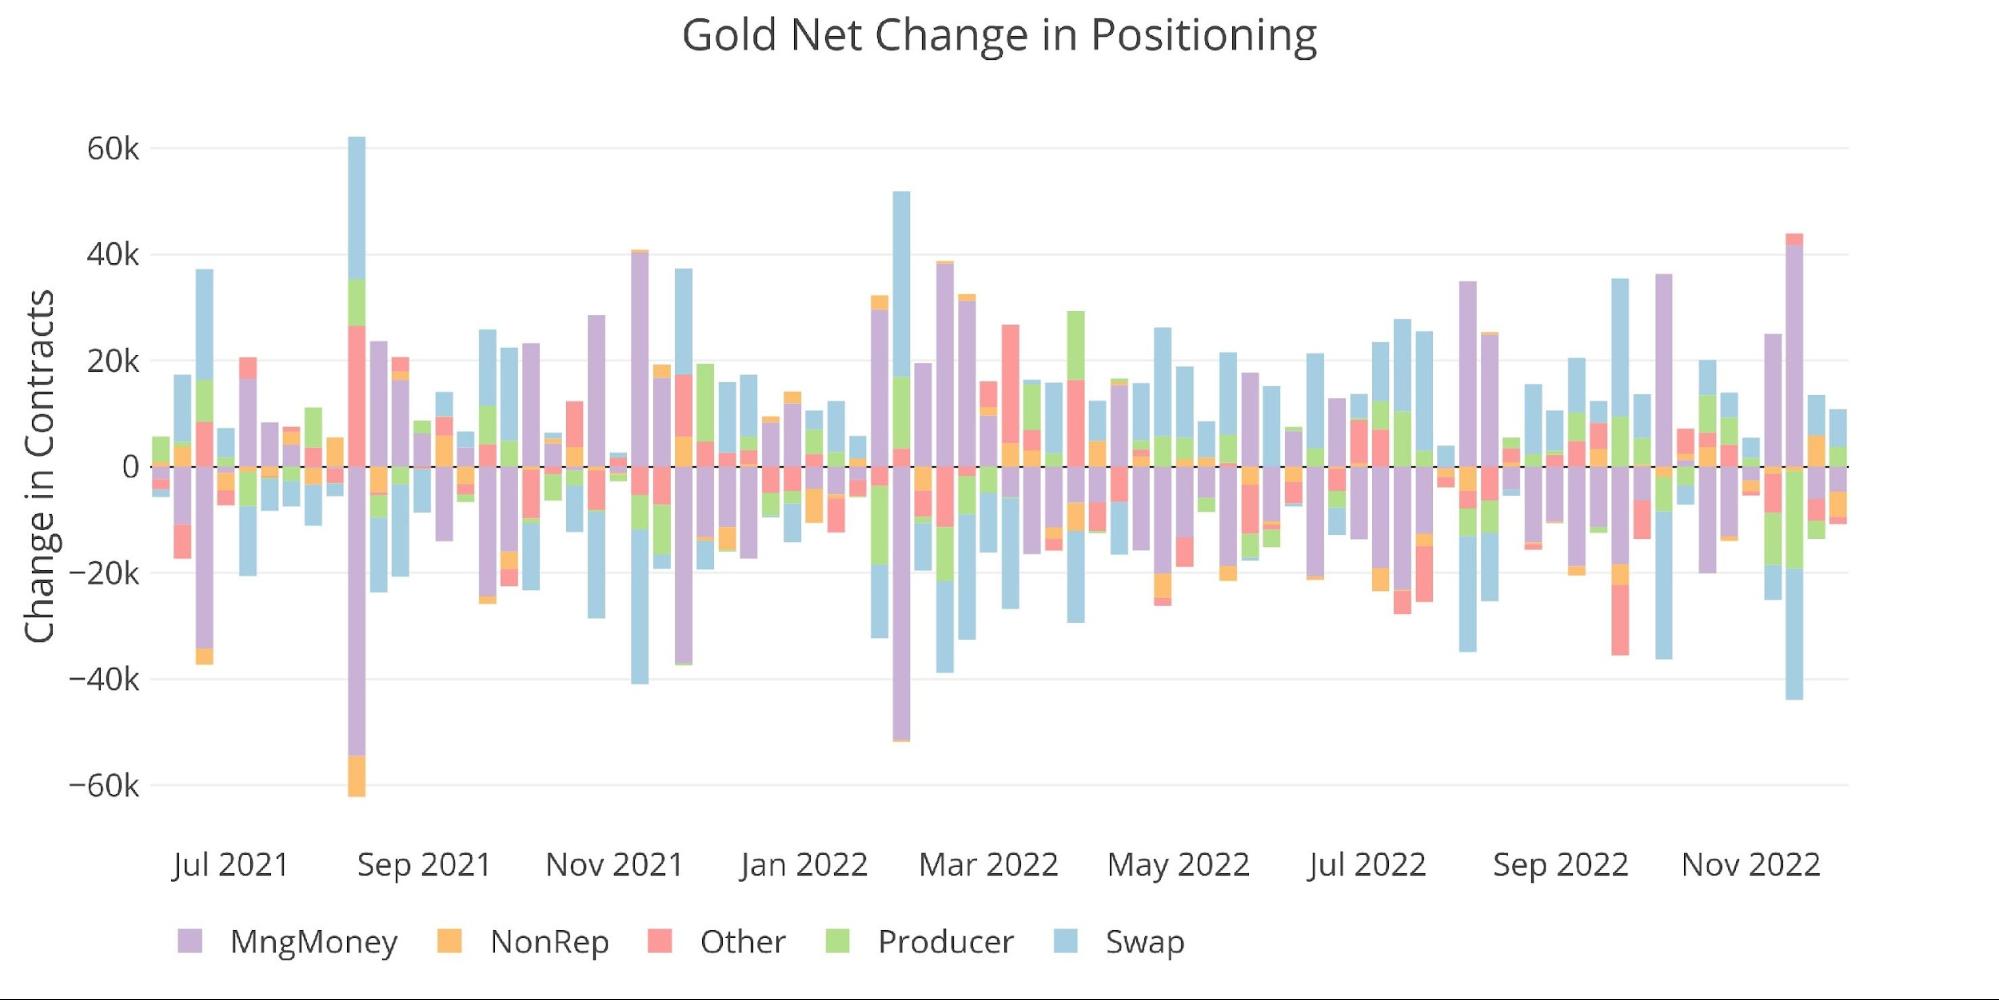
Figure: 3 Silver 50/200 DMA
The table below has detailed positioning information. A few things to highlight:
-
- Over the month, Managed Money change was driven on the long and short side
-
- Gross Longs increased 22% while Gross Shorts decreased 34%, getting back below 100k
-
- Over the last year, Gross Shorts are still larger by 61.5%
- Producers were on the other side of this trade, reducing Gross Longs by 32.6% and increasing Gross Shorts by 71.4%
- Over the month, Managed Money change was driven on the long and short side
One more thing to note is that every participant has reduced their net positioning significantly over the last year, ranging from 29% to 84%. This shows an overall waning interest in the gold market as there is simply less aggregate open interest outstanding.

Figure: 4 Gold Summary Table
The shrinking market can be seen below as well where net positioning continues to trend at the lowest level in years.

Figure: 5 Net Positioning
Historical Perspective
Looking over the full history of the CoTs data by month produces the chart below (values are in dollar/notional amounts, not contracts). The recent steep downward move in positioning has abated and reversed some.

Figure: 6 Gross Open Interest
The market had come under immense pressure as shown below. Such a dramatic move down would usually prompt a massive sell-off in gold, but the price did hold up pretty well. If the market has bottomed and turned then there is a ton of firepower that could propel gold to new highs.
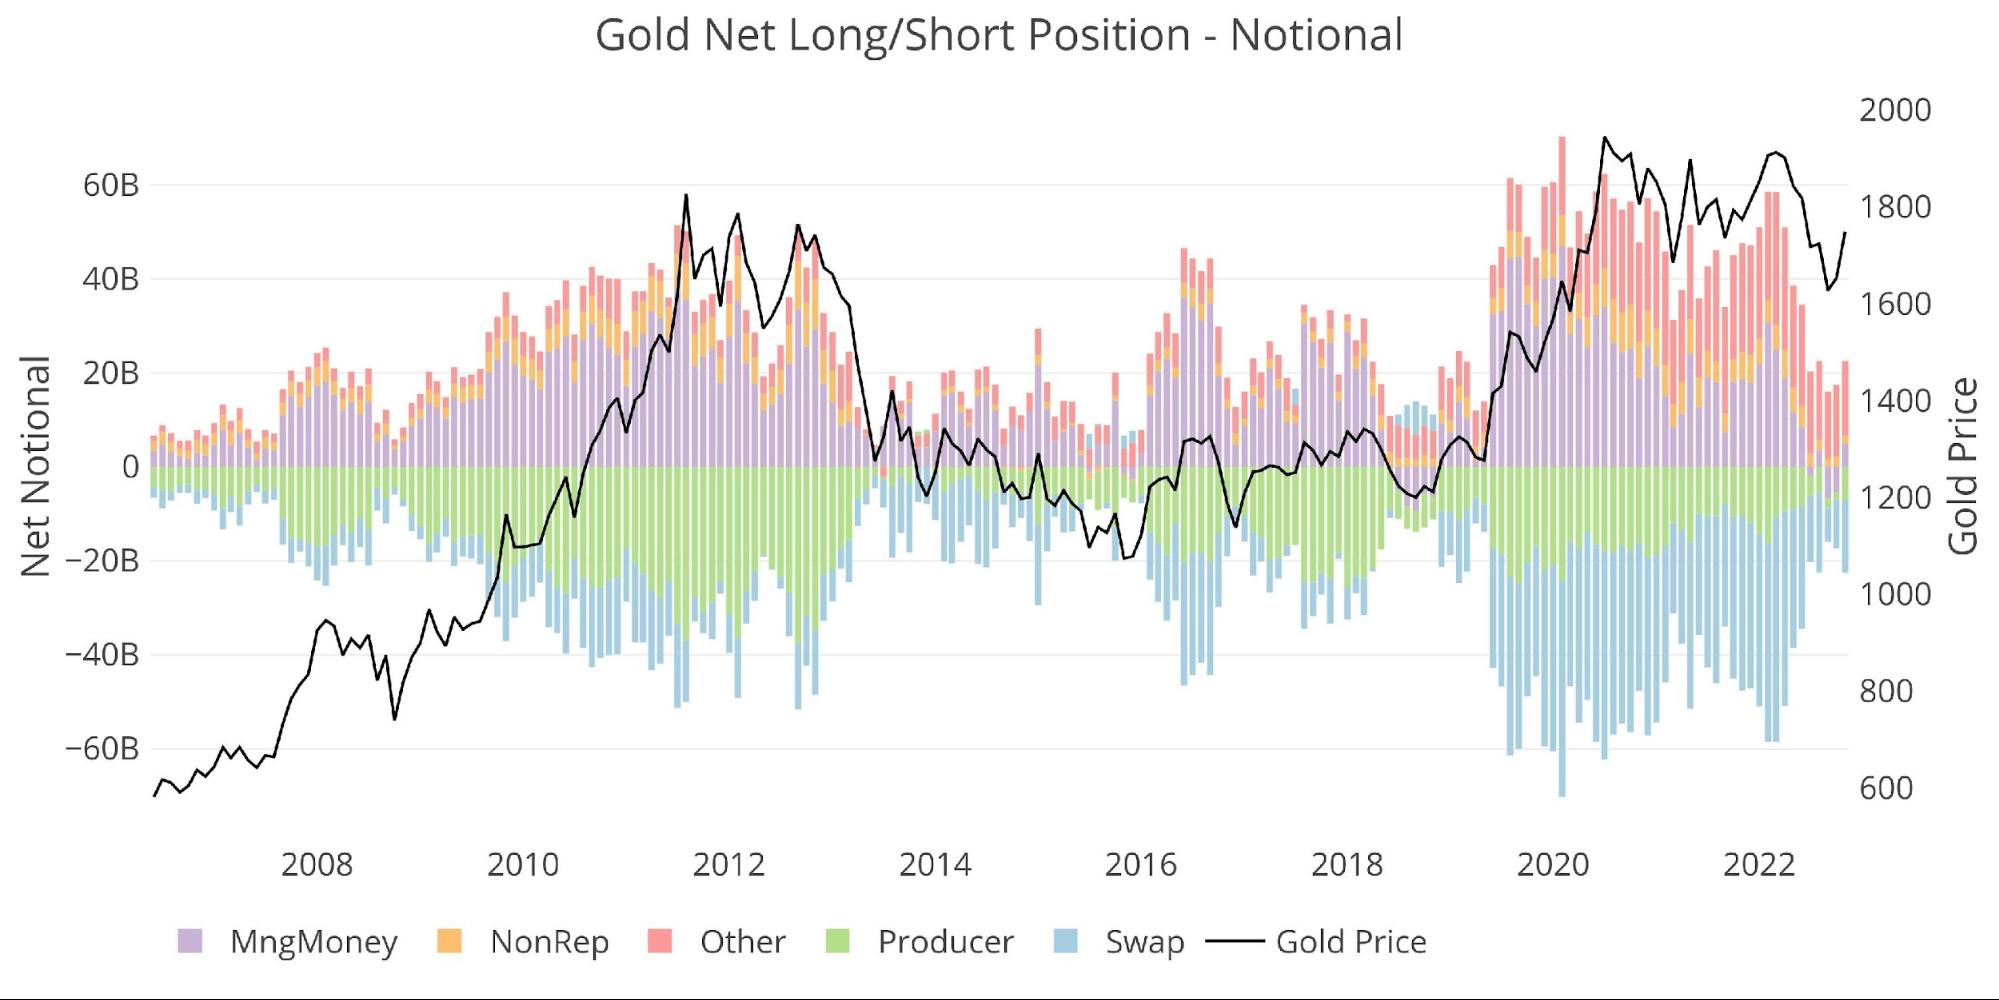
Figure: 7 Net Notional Position
Managed Money might be planning for such an event in the options market, with the highest Gross Long position since April of this year.
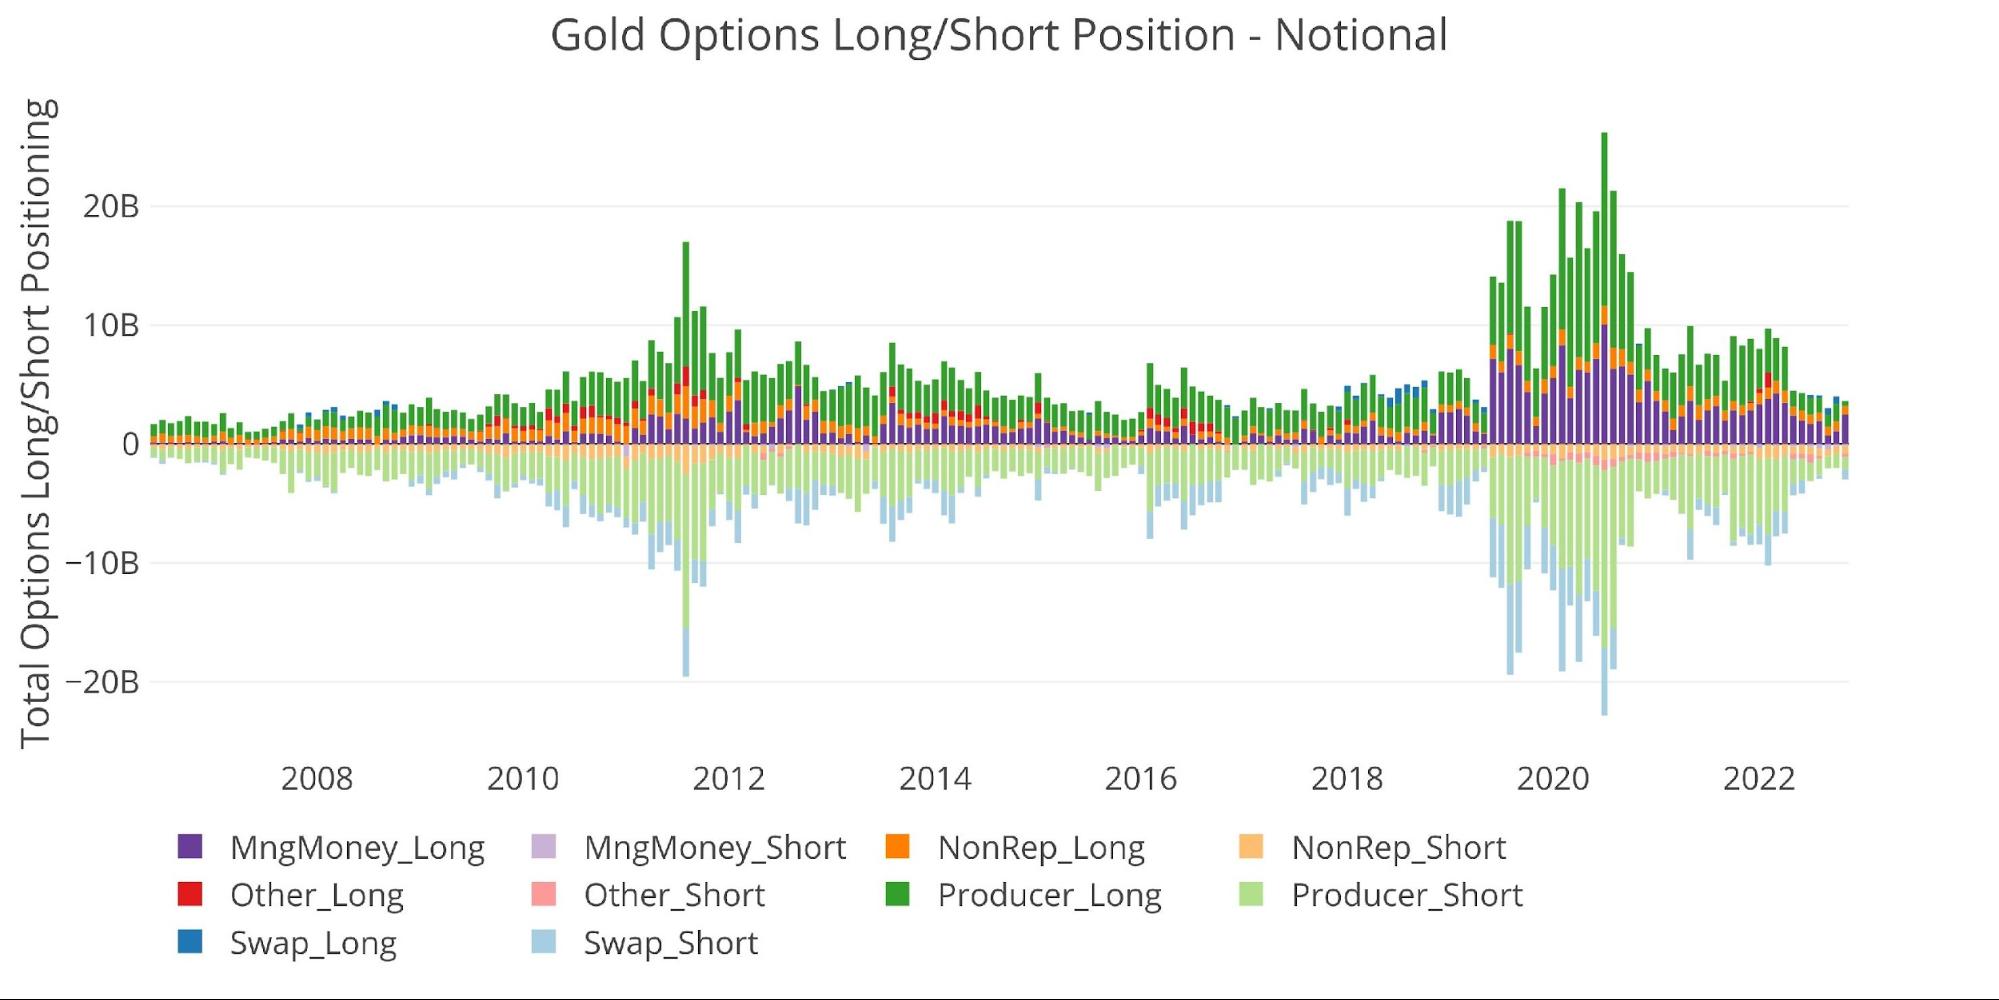
Figure: 8 Options Positions
Bottom line, the last time Managed Money got on board the long train was back in March before the massive demand for physical gold had taken hold. With physical supplies depleted, if Managed Money gets back on board the long side in the paper market it could act as a one-two punch that could blast gold to new all-time highs in a very short period of time.
Silver
Current Trends
Managed Money has returned to a net long position, which reached 13,593 contracts in the latest period. This is the largest net long position since May 3rd of this year. In fact, four of the five market participants are all net long at this point.

Figure: 9 Net Position by Holder
Similar to gold, Managed Money activity dominates the price with a correlation of 0.96 which is nearly a perfect correlation. This can be seen below.

Figure: 10 Managed Money Net Position
While the weekly activity is still quite choppy, it’s clear to see that the long side is seeing the bigger moves in recent weeks.
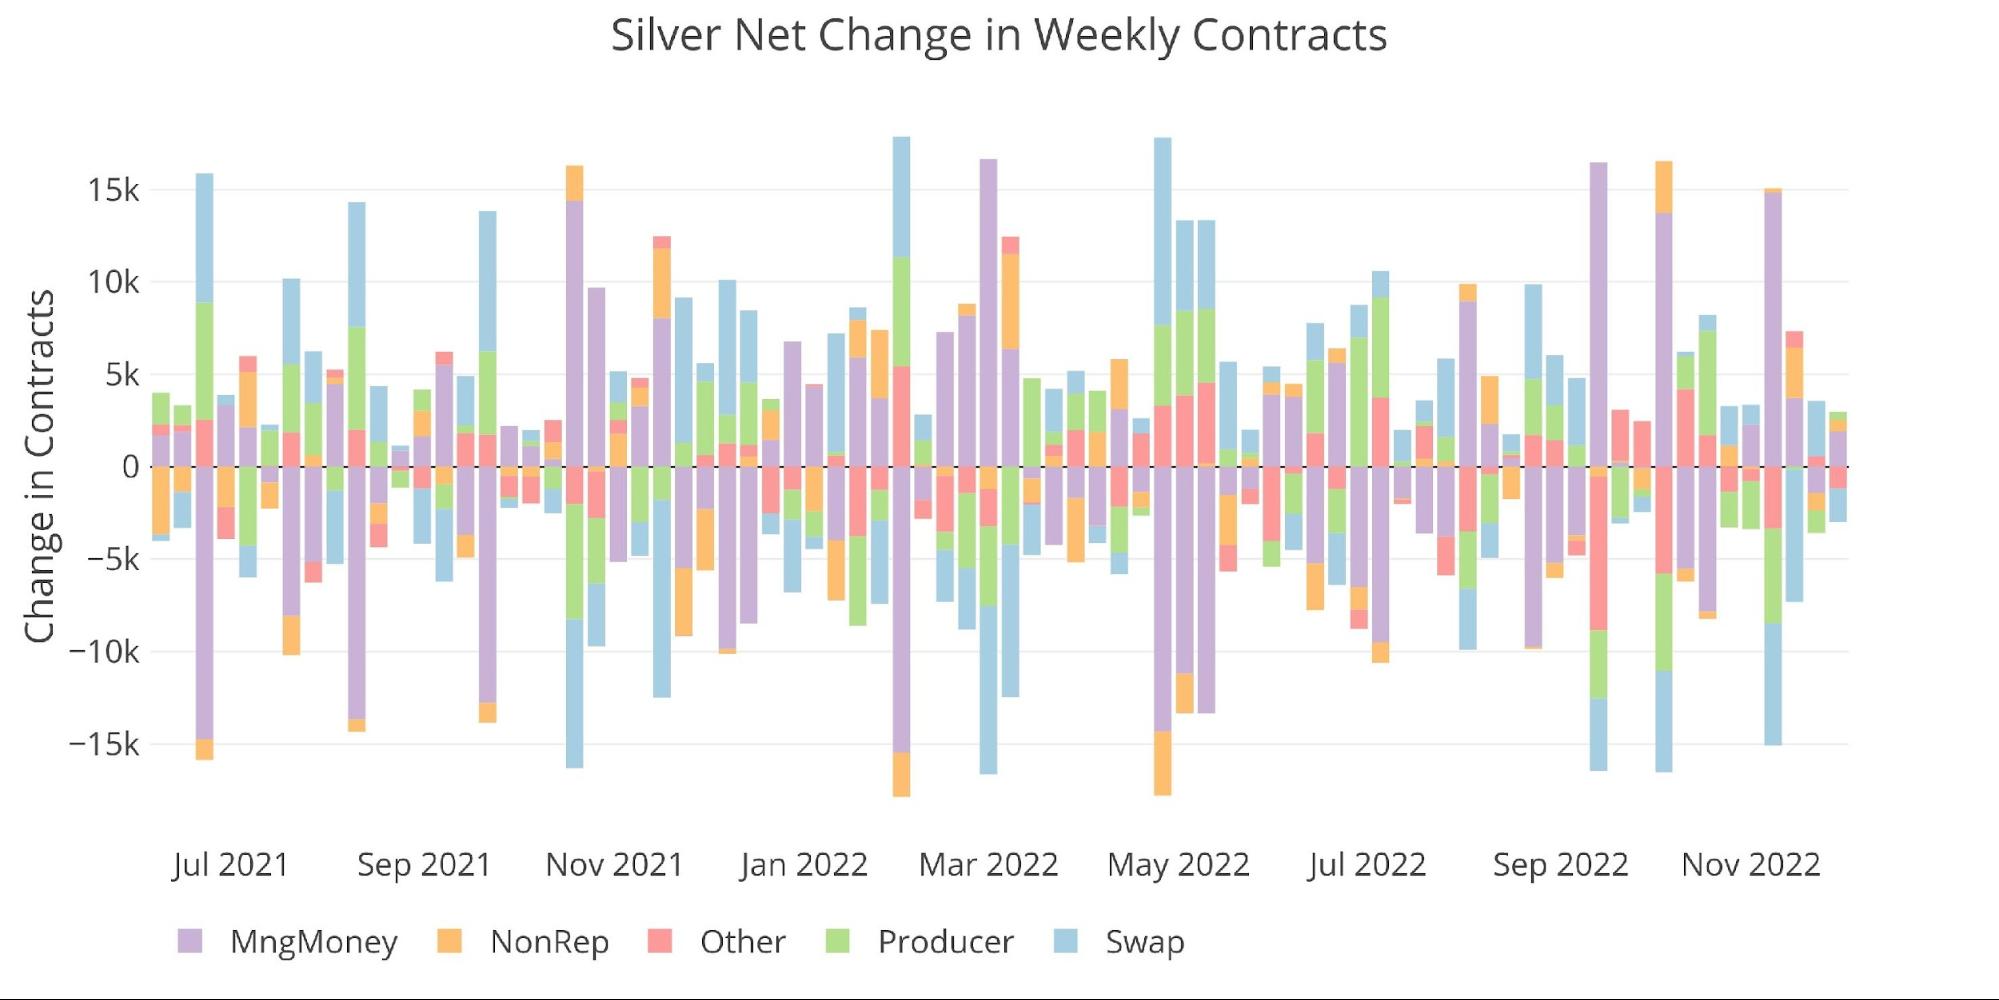
Figure: 11 Net Change in Positioning
The table below shows a series of snapshots in time. This data does NOT include options or hedging positions. Important data points to note:
-
- The change in Managed Money has mainly come from the Gross Shorts reducing their position
-
- Gross Shorts fell by 20k contracts or 46% over the last month
-
- Ironically, Managed Money was the only participant to increase Gross Longs over the last month, but this was an increase of less than 5%
- While Producers are currently the only participant Net Short, it should be noted that their Net Short position is down 21% since last year
- The change in Managed Money has mainly come from the Gross Shorts reducing their position
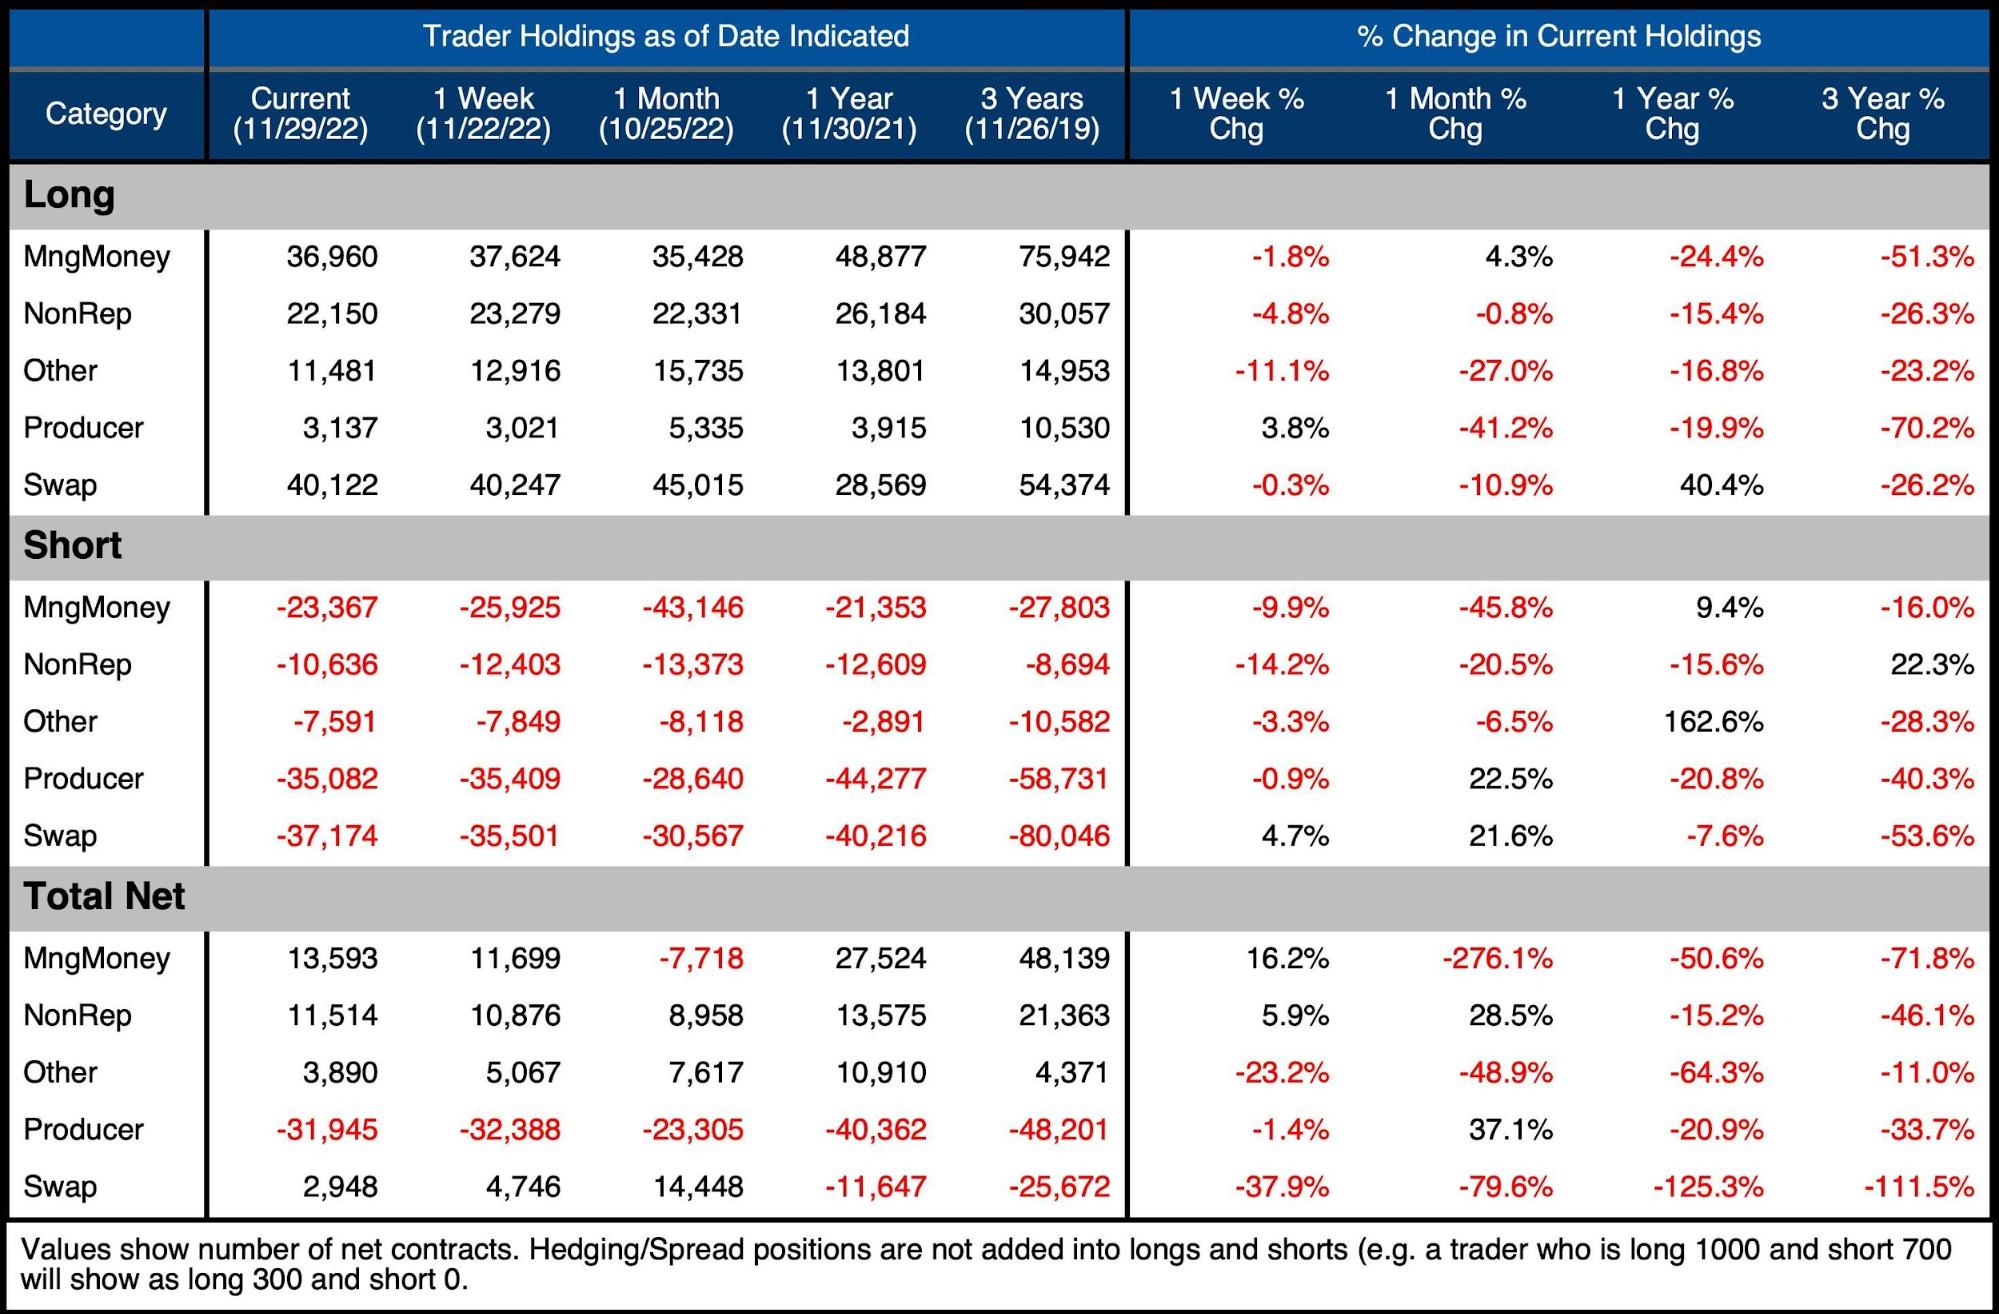
Figure: 12 Silver Summary Table
While net positioning in silver is still low relative to history, it has been creeping up in recent weeks. This is likely driven by more participants positioning on the long side of the market.

Figure: 13 Net Positioning
Historical Perspective
Looking over the full history of the CoTs data by month produces the chart below. The overall market has been contracting in recent months to multi-year lows but does seem to have bottomed in September.
Figure: 14 Gross Open Interest
Managed Money has reversed quickly from its Net Short position which lasted 4 full weeks. This is fairly normal as Managed Money has not maintained a Net Short position in silver for more than a few consecutive months.
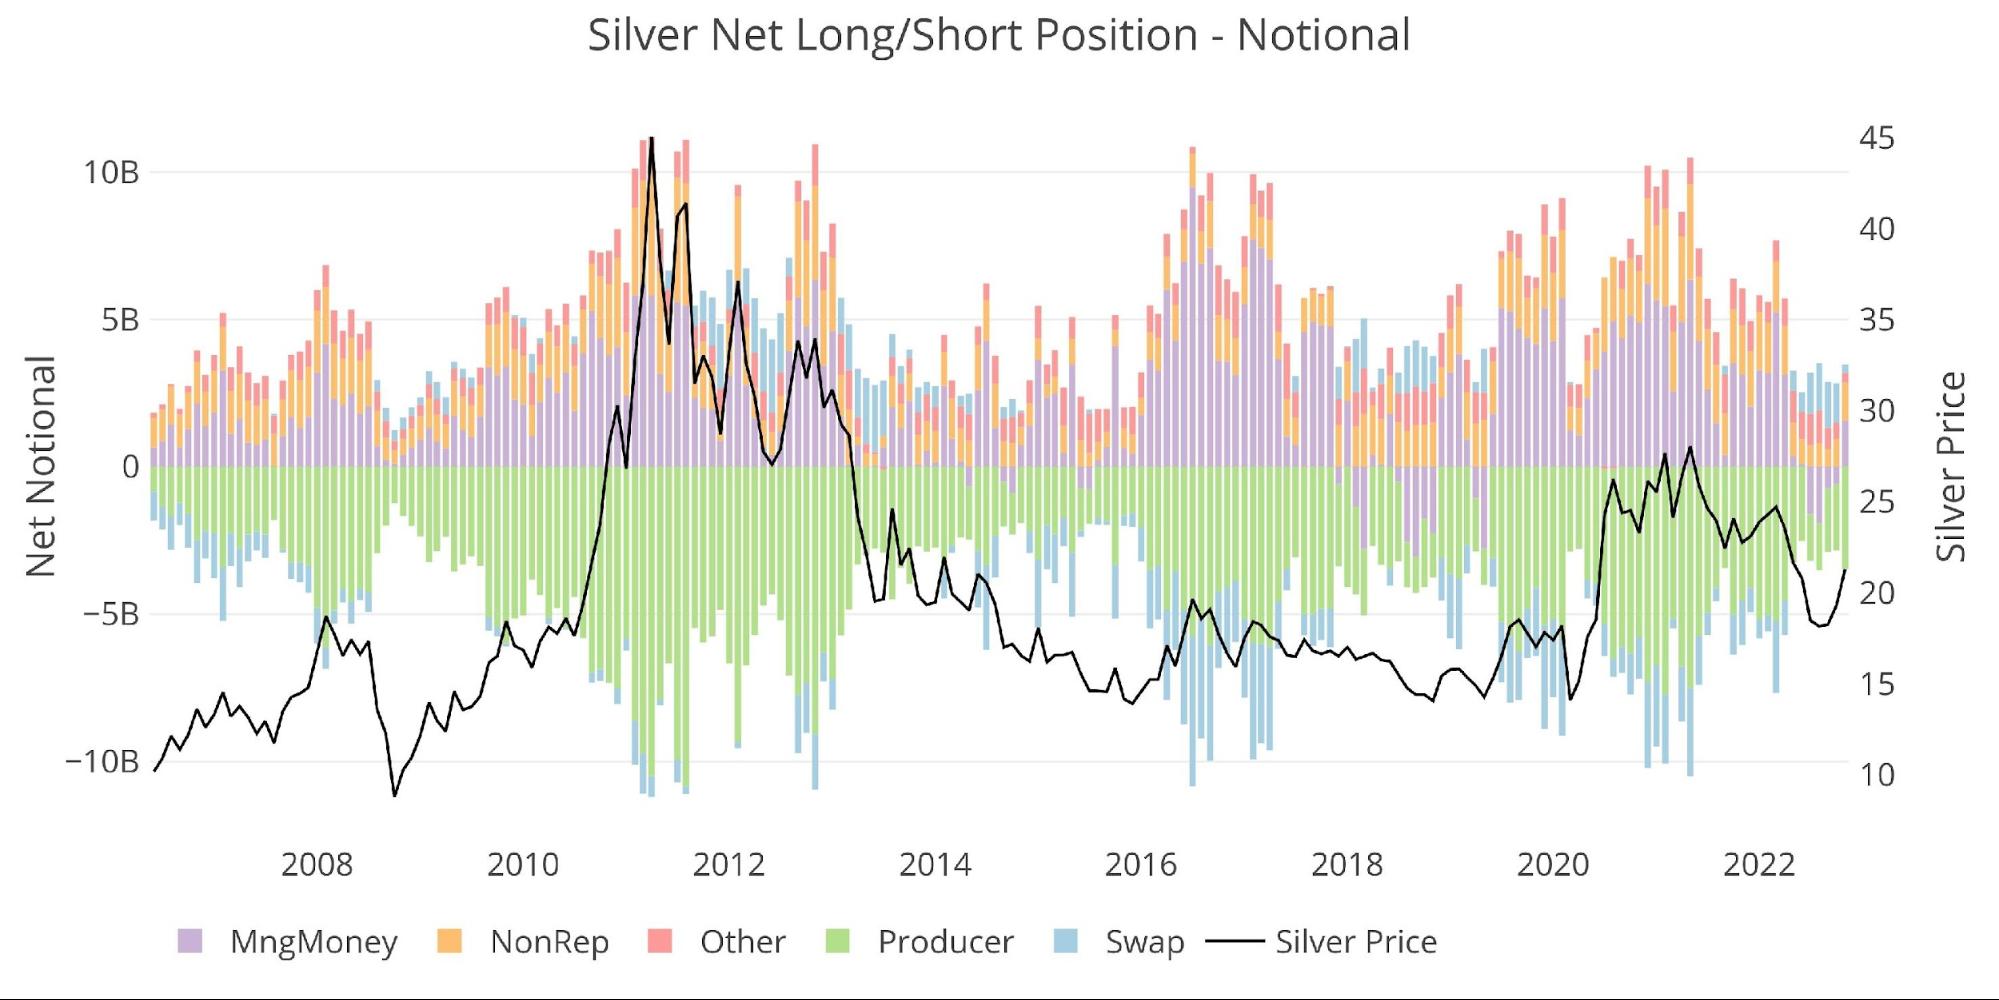
Figure: 15 Net Notional Position
While Managed Money has shown a slight uptick in the Gross Long position, it has dropped some from where it was in October. The options market still remains much smaller than it has been in the past.
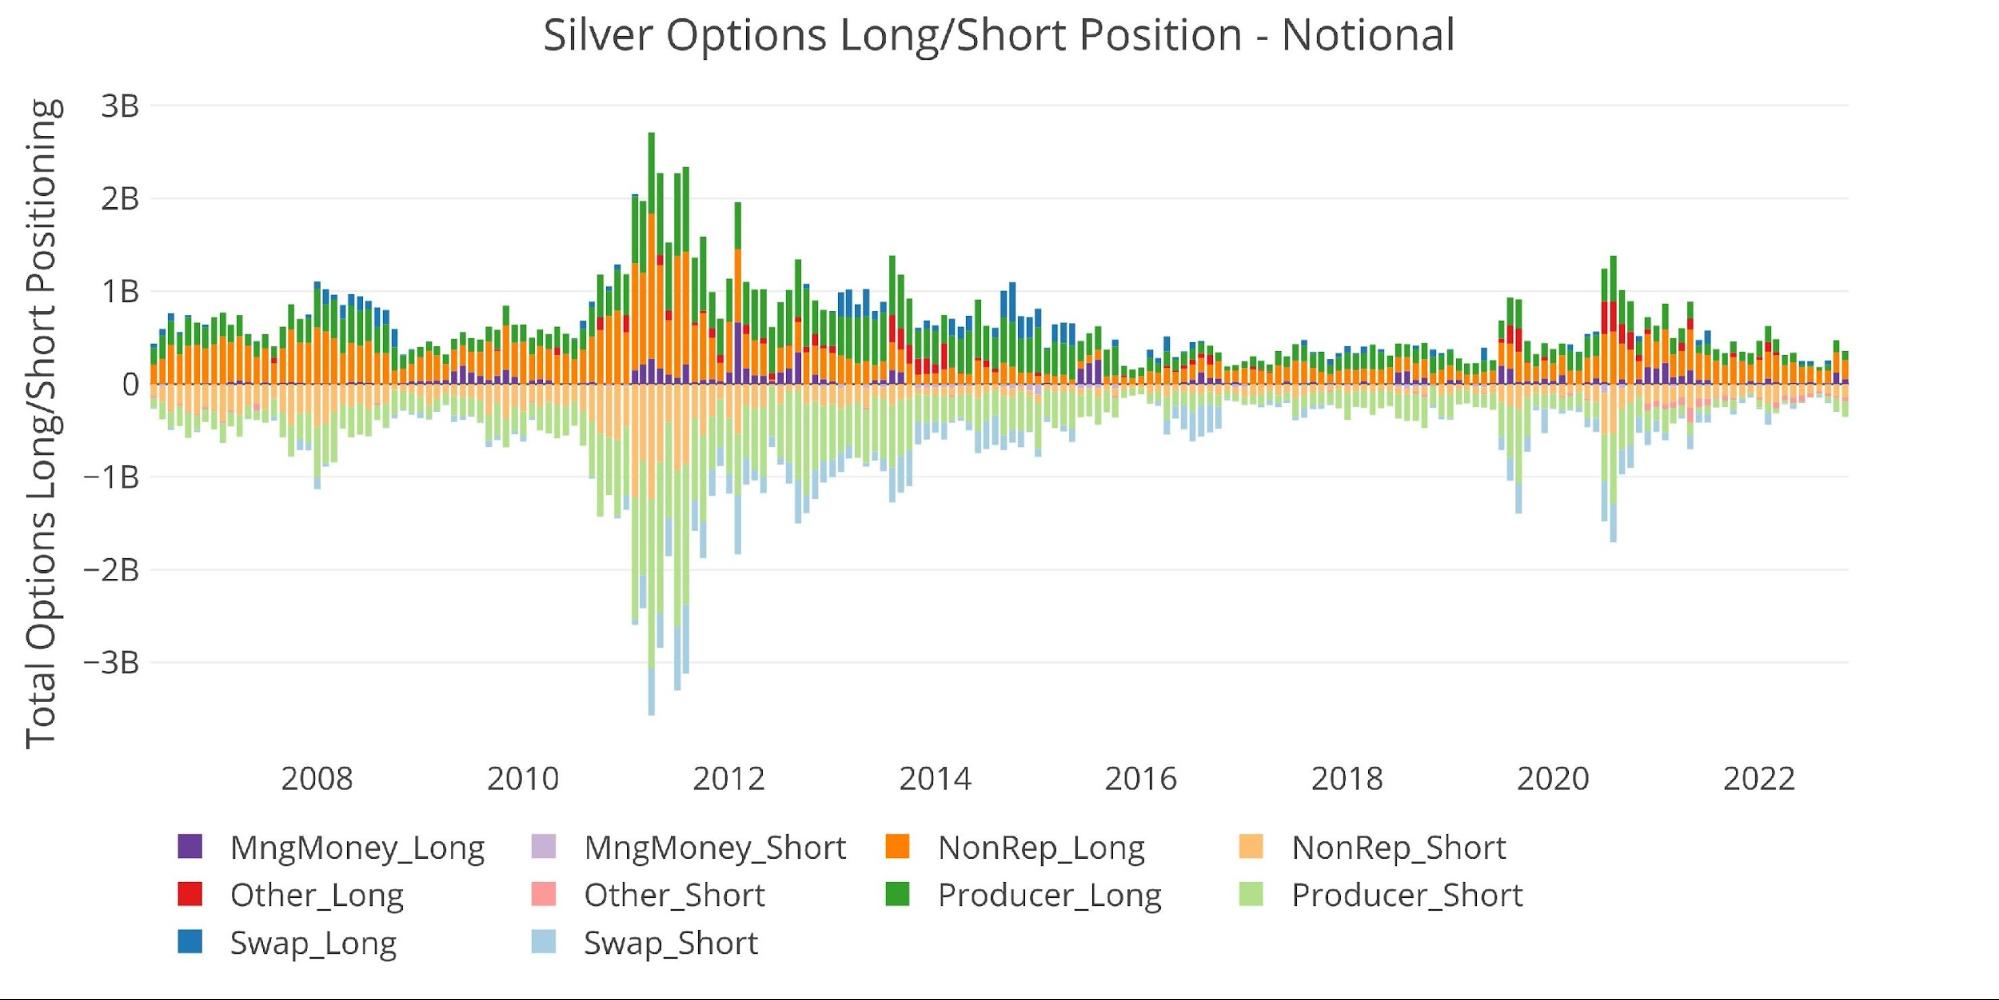
Figure: 16 Options Positions
Conclusion
Managed Money continues to dominate control over the market. Looking at the correlation table below shows gold at .95 and silver at an incredible .96. This is complete control over the market.
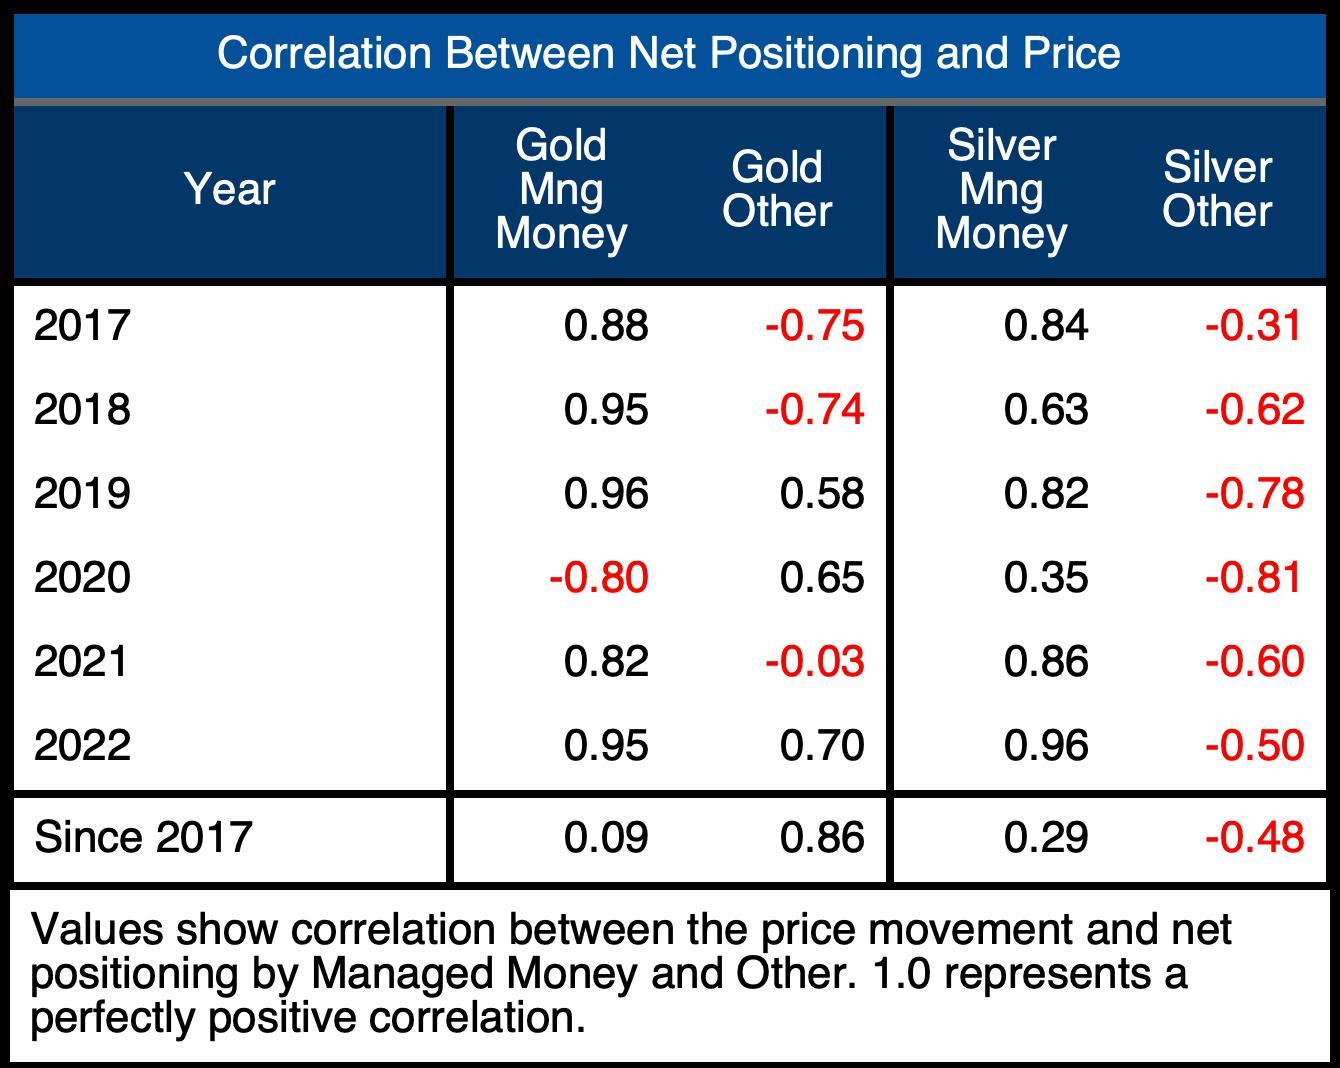
Figure: 17 Correlation Table
While the exodus of metal in the physical market should eventually appear in the price, if Managed Money buys into the bull move and starts going long in the paper market it could really blast both metals higher. Once the Fed officially pivots becomes more obvious in the weeks and months ahead, Managed Money will be positioned to ride the wave higher.
If there is not enough physical supply to meet the ongoing demand, it could really start to move the market as no one will want to be on the short side of a delivery contract.
Data Source: https://www.cftc.gov/MarketReports/CommitmentsofTraders/index.htm
Data Updated: Every Friday at 3:30 PM as of Tuesday
Last Updated: Nov 29, 2022
Gold and Silver interactive charts and graphs can be found on the Exploring Finance dashboard: https://exploringfinance.shinyapps.io/goldsilver/

Call 1-888-GOLD-160 and speak with a Precious Metals Specialist today!
Buka akaun dagangan patuh syariah anda di Weltrade.
Source link