
The CME Comex is the Exchange where futures are traded for gold, silver, and other commodities. The CME also allows futures buyers to turn their contracts into physical metal through delivery. You can find more details on the CME here (e.g., vault types, major/minor months, delivery explanation, historical data, etc.).
The data below looks at contract delivery where the ownership of physical metal changes hands within CME vaults. It also shows data that details the movement of metal in and out of CME vaults. It is very possible that if there is a run on the dollar and a flight into gold, this is the data that will show early warning signs.
Gold
Gold deliveries have increased steadily over the last several months, reaching the highest level since June 2023. Deliveries this February are more than 3,000 contracts higher than last February.
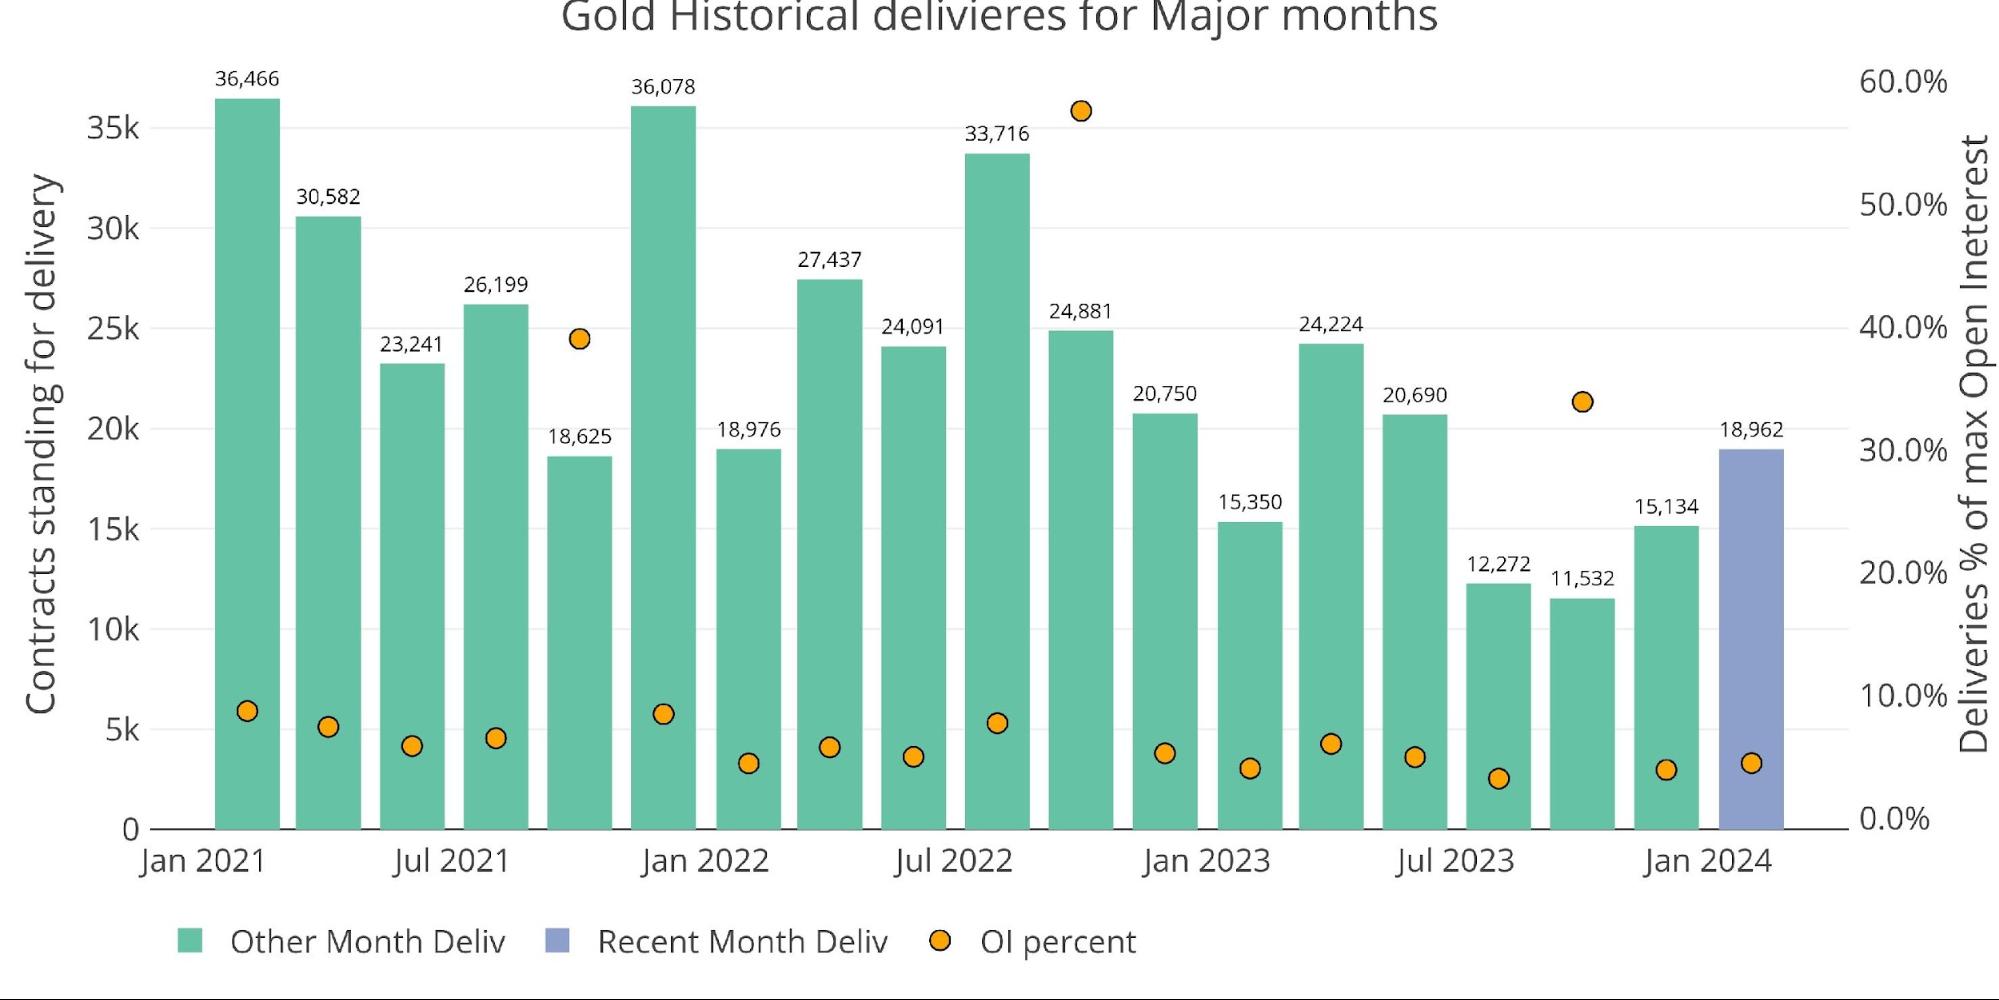
Figure: 1 Recent like-month delivery volume
Another important detail to note is the contracts that have been opened and delivered after the delivery period started. This shows the demand for immediate metal delivery. As shown below, this month has the second strongest post-close delivery volume in more than 2 years.
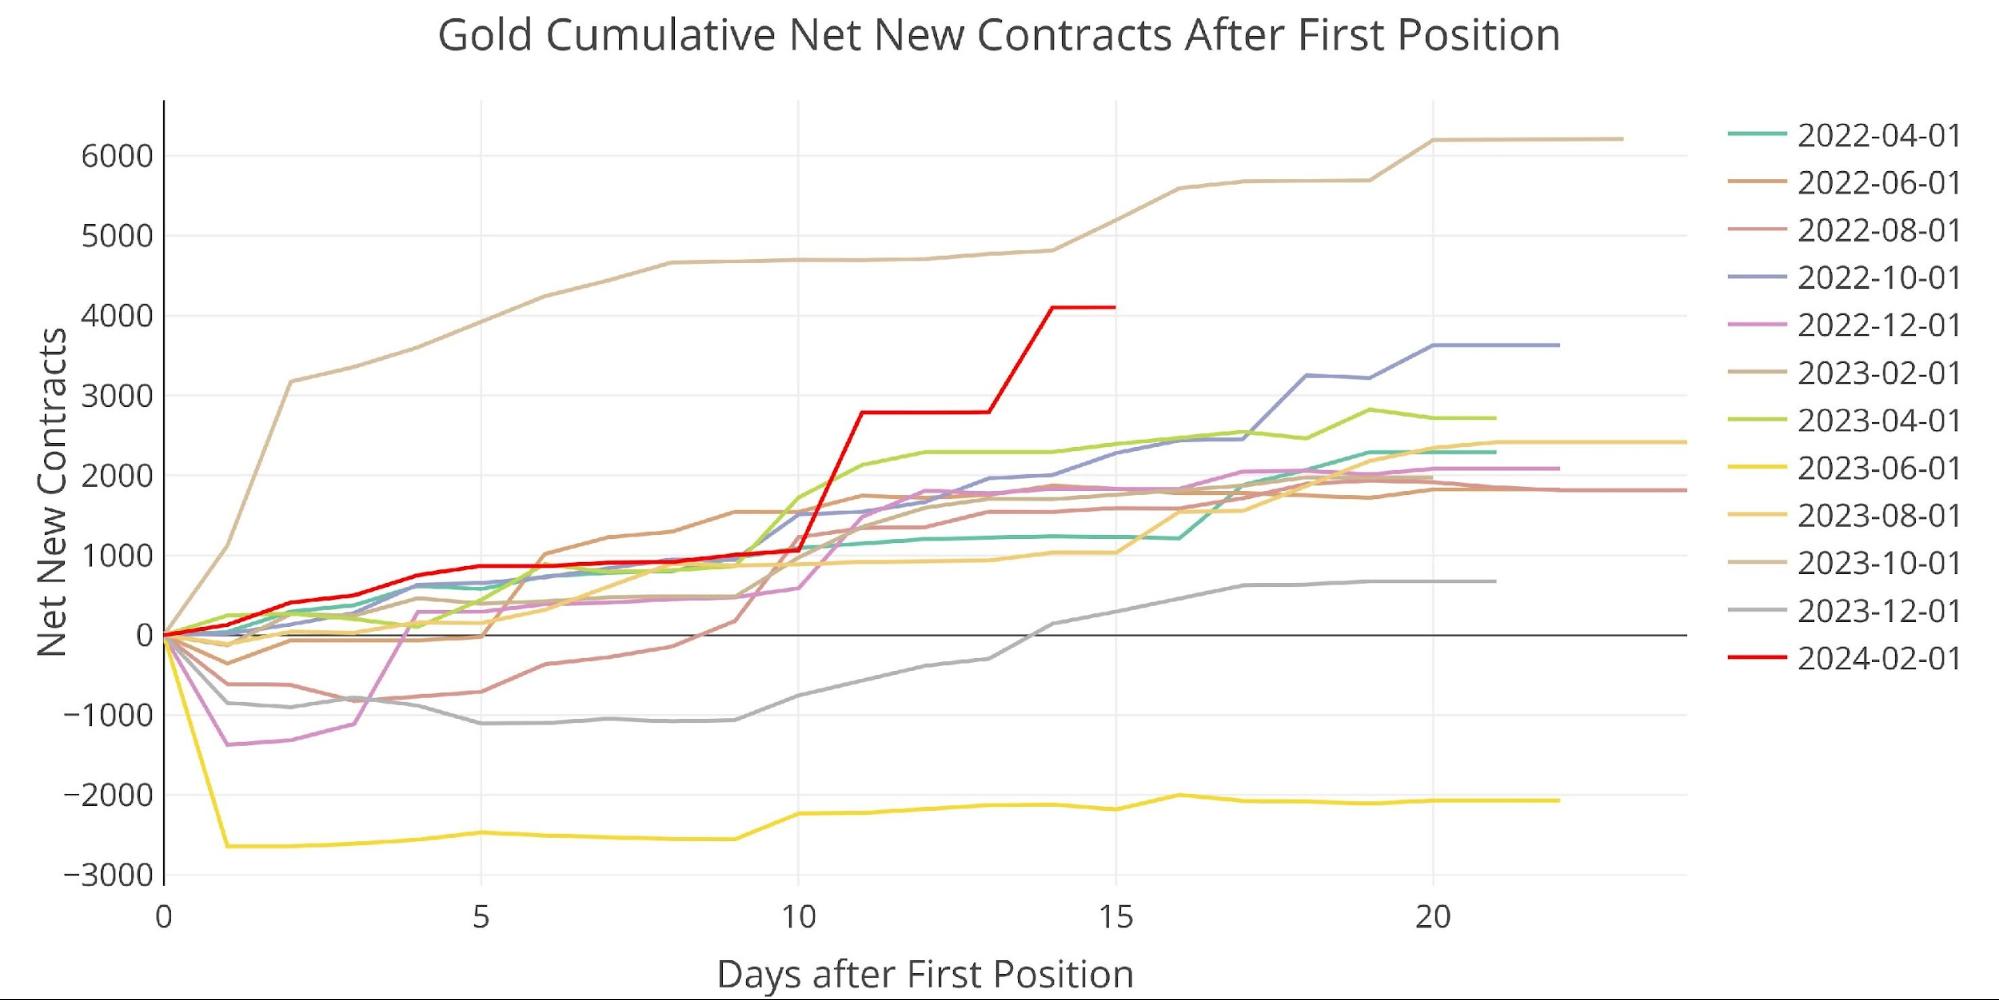
Figure: 2 Cumulative Net New Contracts
Inventory levels were significantly depleted throughout 2022 but then stabilized in 2023. So far in 2024, the biggest action has been to move metal from Registered (available for delivery) to Eligible (not available for delivery).
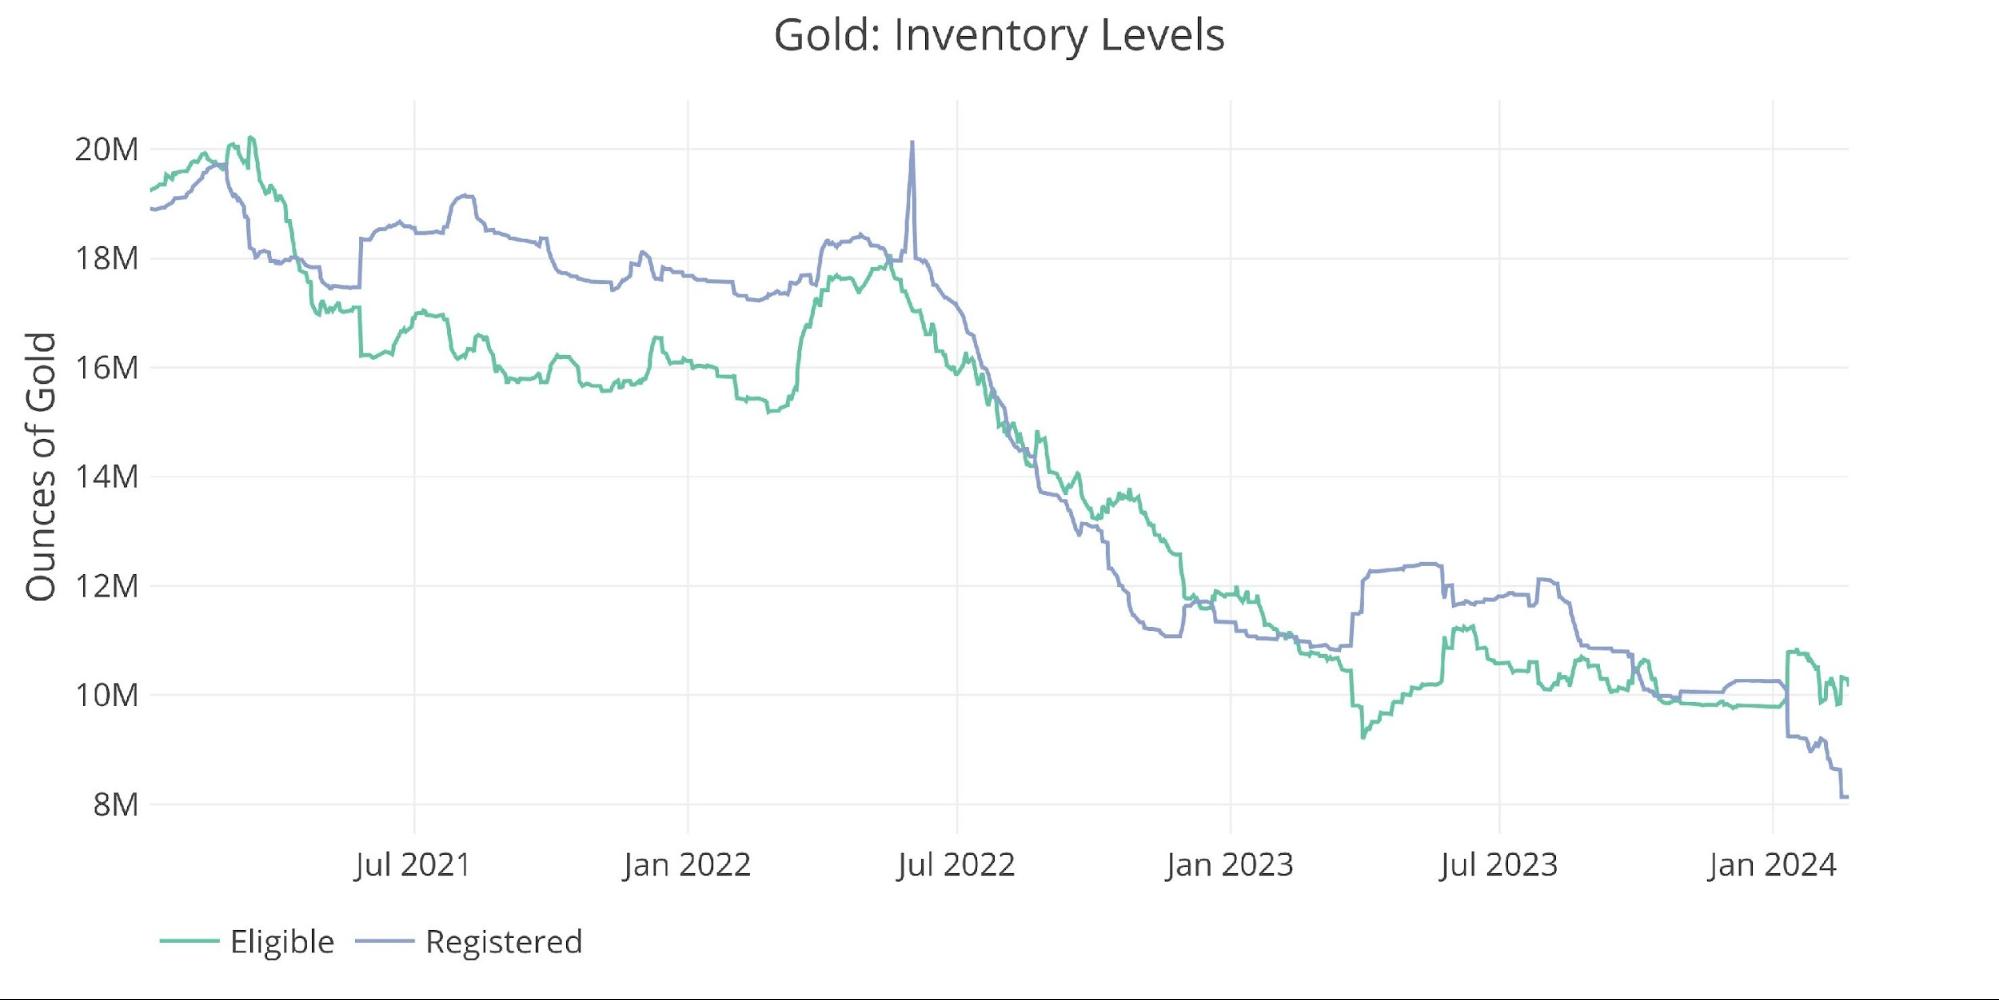
Figure: 3 Inventory Data
For gold, March is a minor delivery month. As we approach the delivery window, you can see that interest has climbed on the contract to one of the highest levels in recent years.
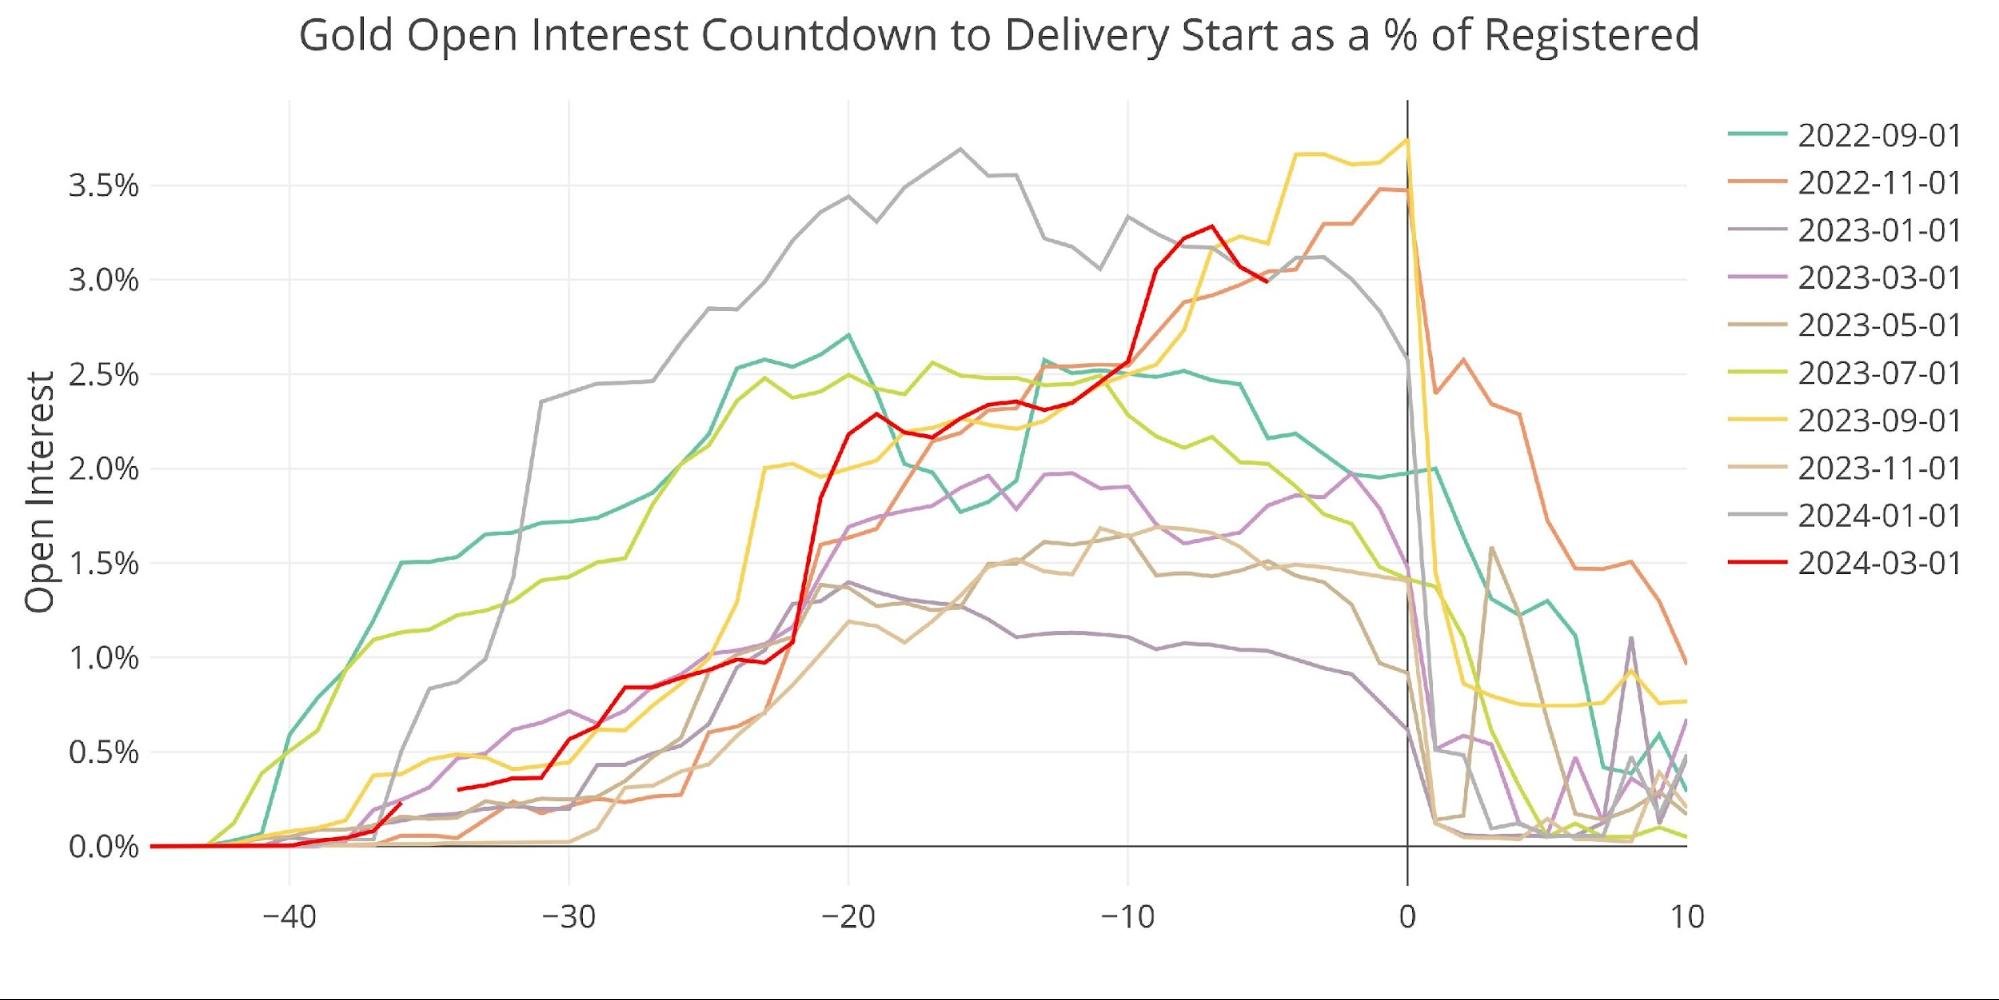
Figure: 4 Open Interest Countdown Percent
Silver
Silver delivery has been climbing some in recent months for minor delivery periods. The last two months have been at the highest levels since 2022.
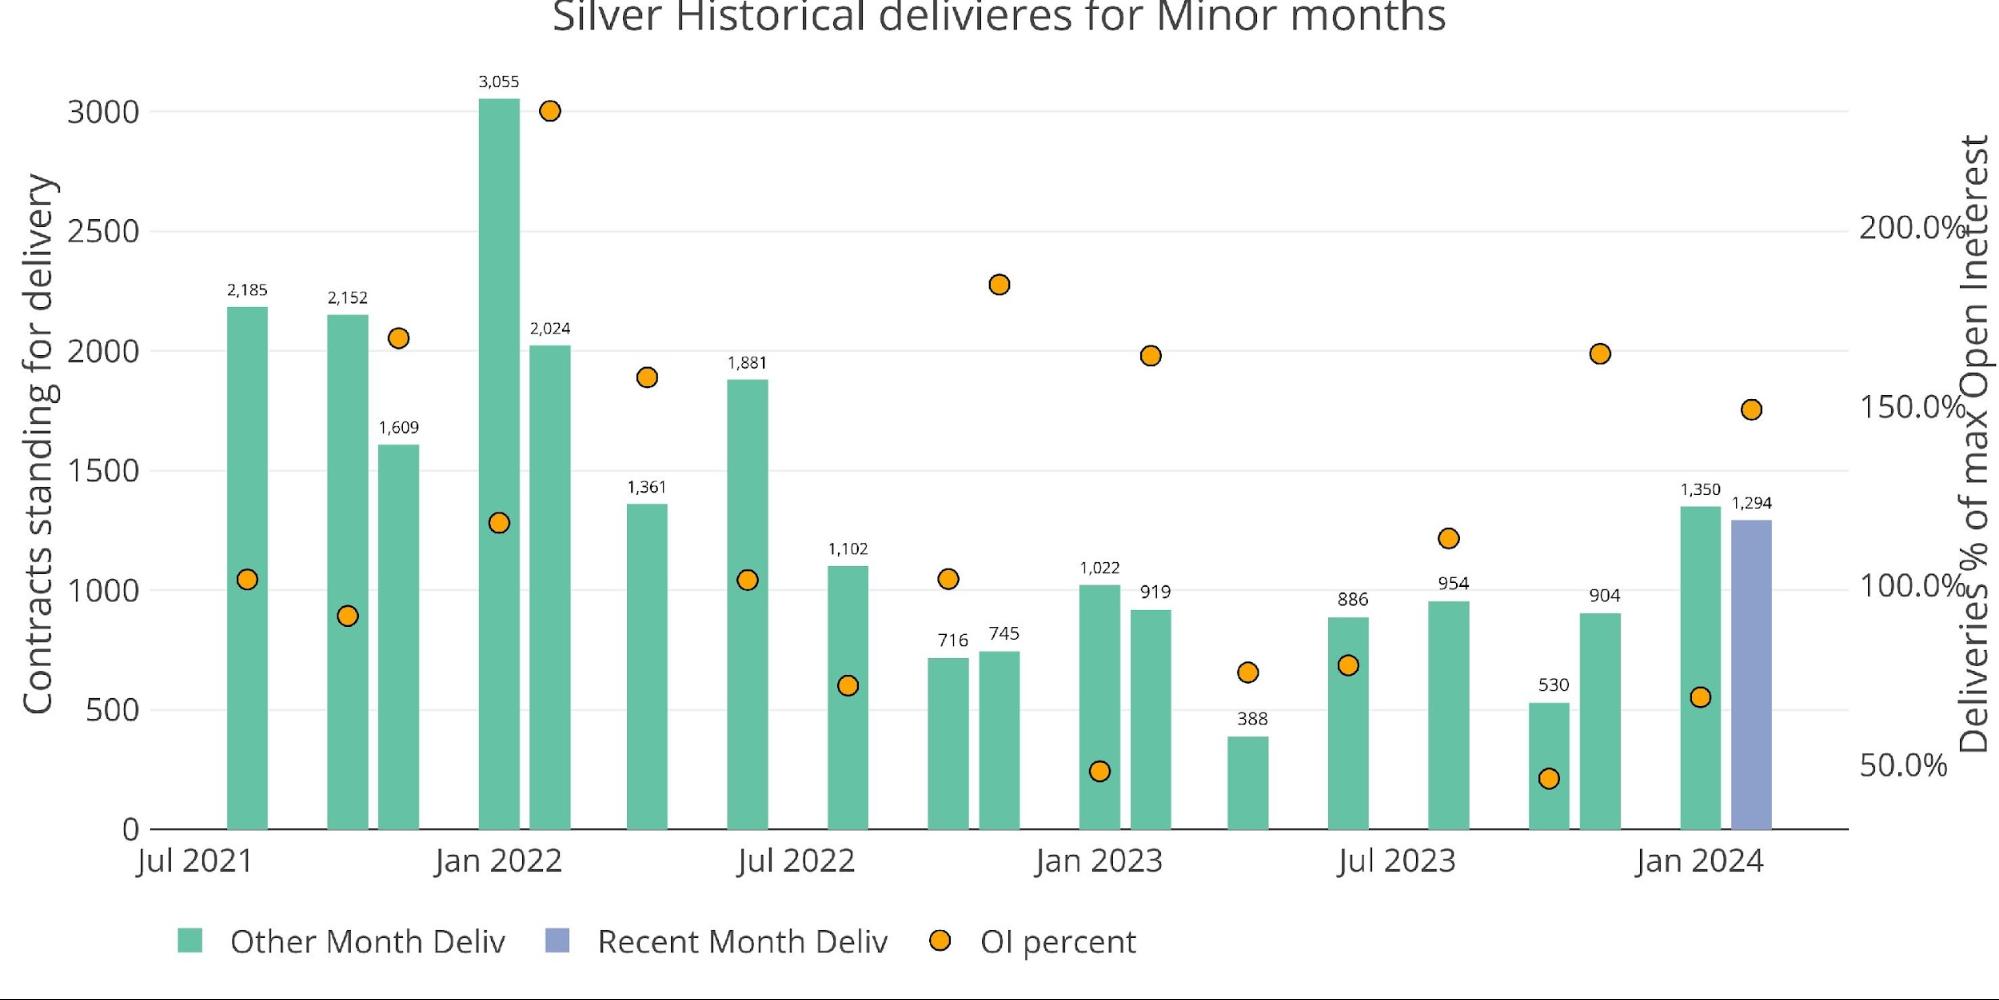
Figure: 5 Recent like-month delivery volume
Net new contracts also saw a large surge at the beginning of the delivery cycle.
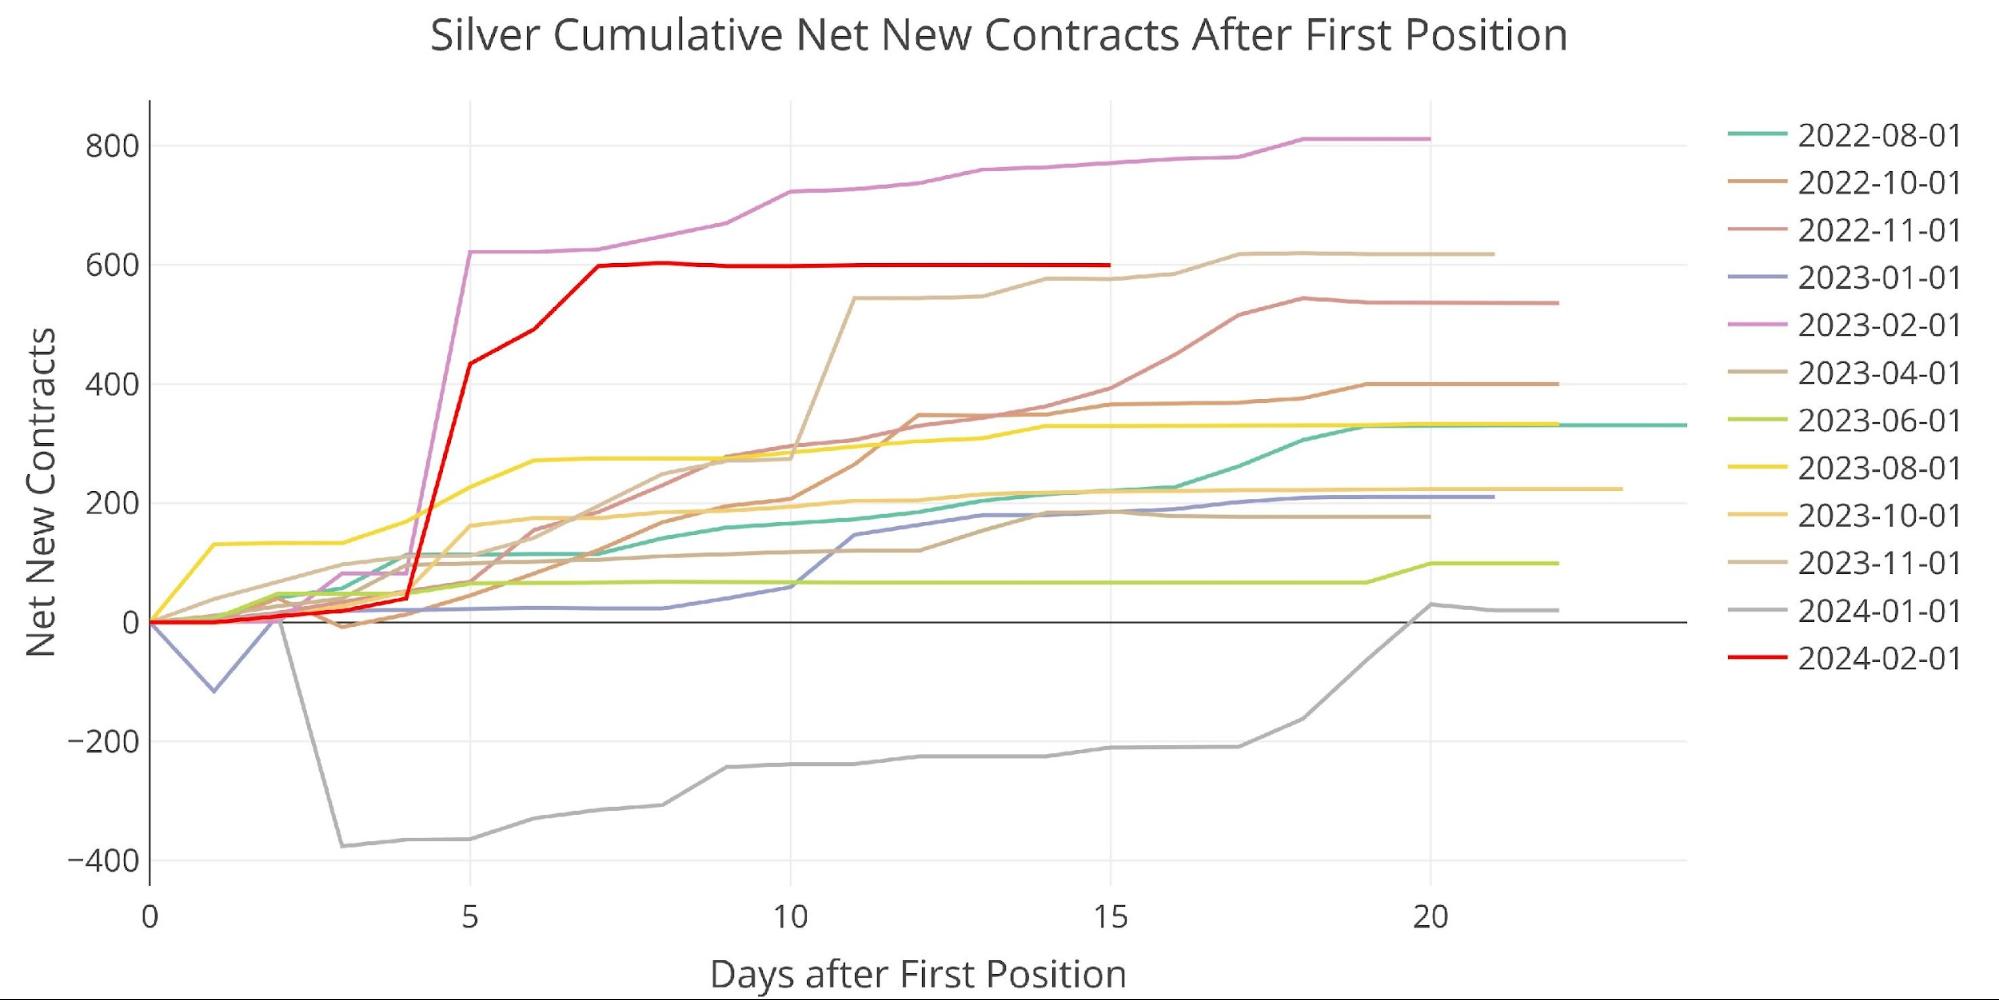
Figure: 6 Cumulative Net New Contracts
Similar to gold, silver saw a big drop in inventory in 2022 and then steadied some in 2023. There has been some increase in inventory since then, but levels are still very low compared to history.
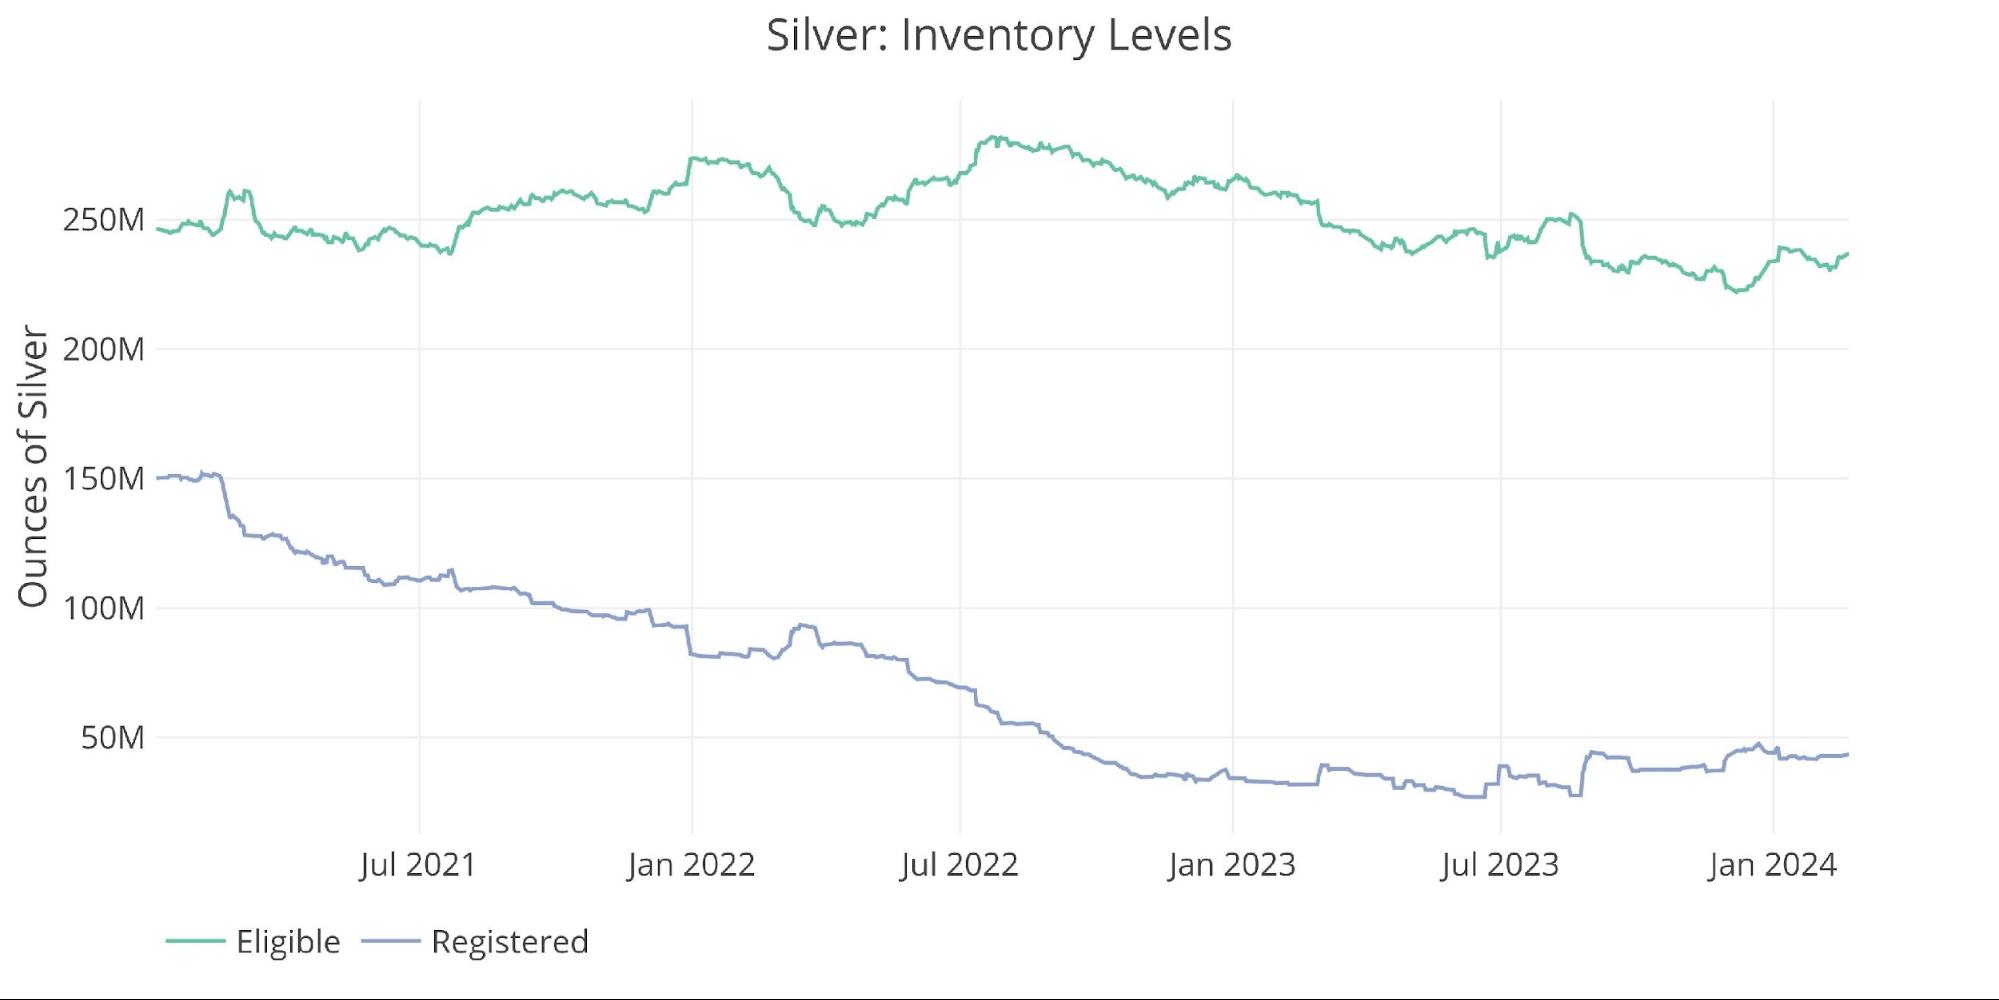
Figure: 7 Inventory Data
As silver approaches the major delivery month of March, you can see that open interest is about the middle of the pack. It started much lower than in recent months but has stayed elevated into the contract roll period.
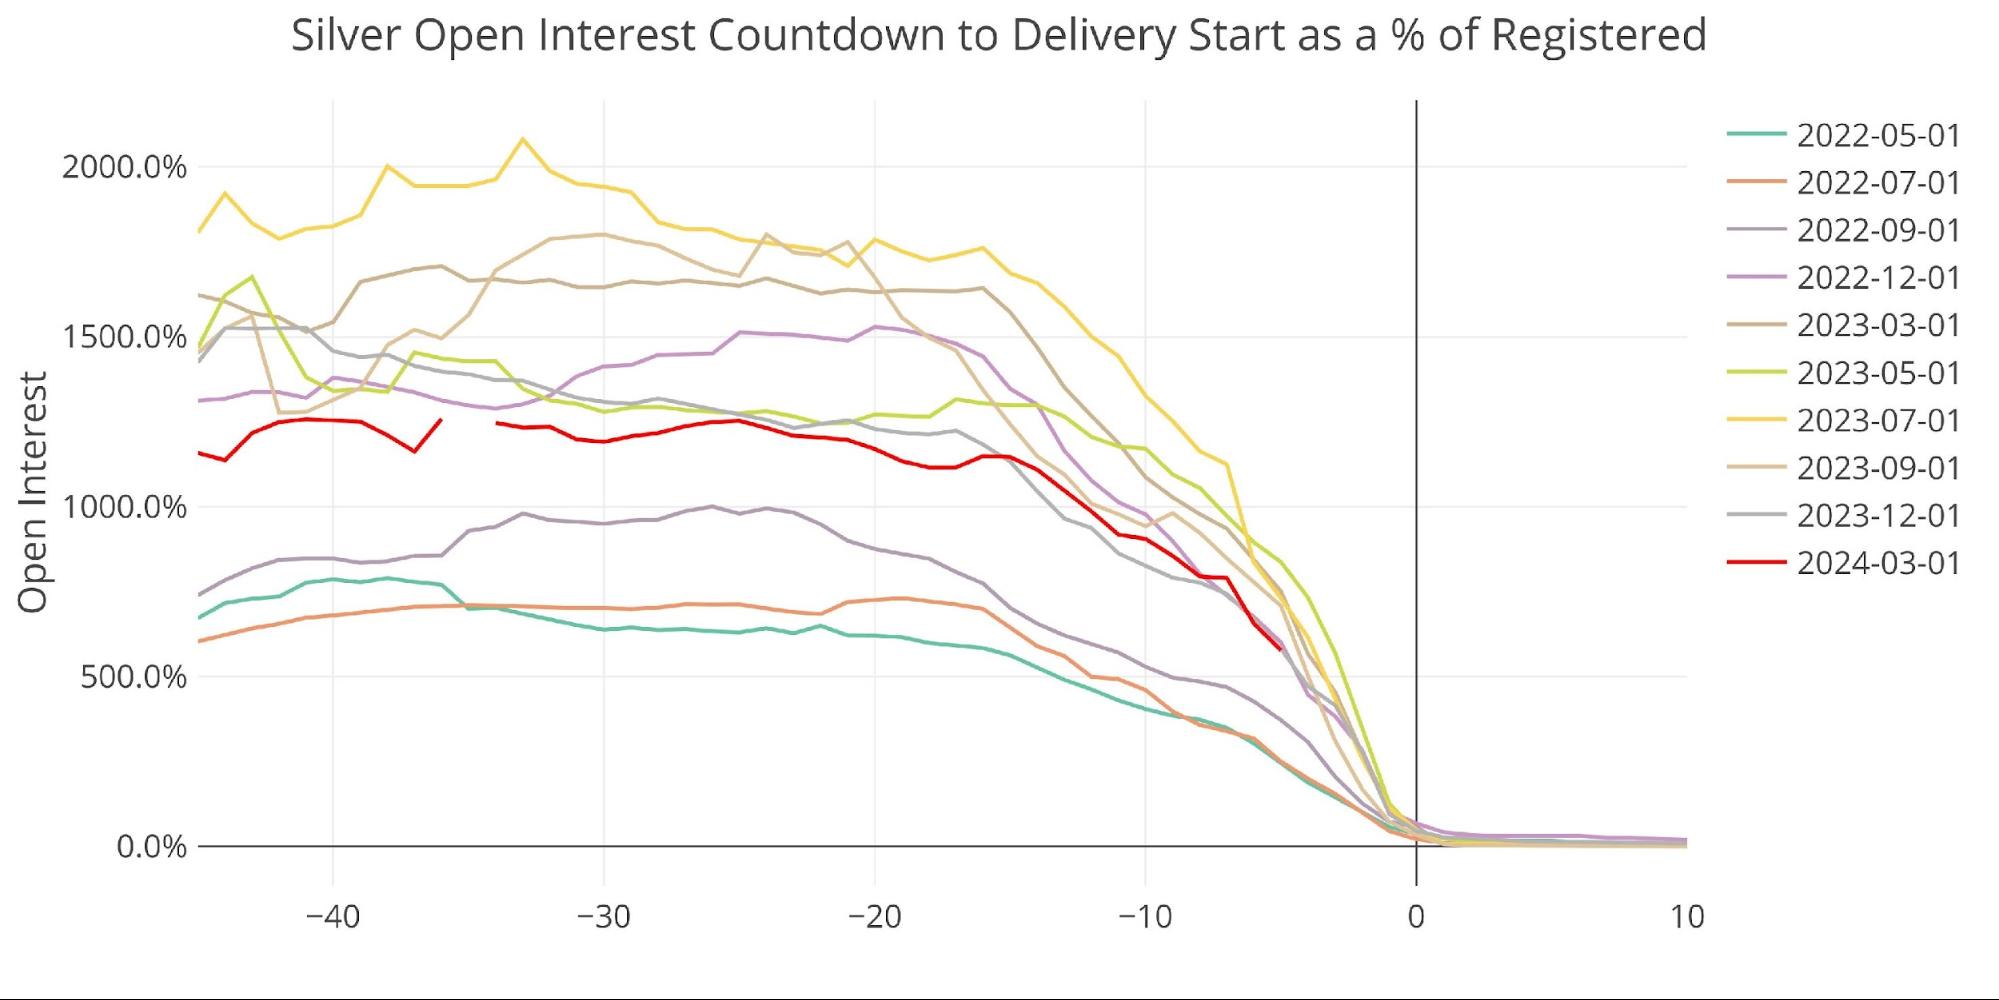
Figure: 8 Open Interest Countdown Percent
You can track this data daily using the dashboard below.
Data Source: https://www.cmegroup.com/
Data Updated: Nightly around 11 PM Eastern
Last Updated: Feb 21, 2024
Gold and Silver interactive charts and graphs can be found on the Exploring Finance dashboard: https://exploringfinance.shinyapps.io/goldsilver/

Call 1-888-GOLD-160 and speak with a Precious Metals Specialist today!
Buka akaun dagangan patuh syariah anda di Weltrade.
Source link