In the realm of institutional asset management, the copper/gold ratio (blue line) has served as a key indicator for some, providing insights into the potential trajectory of 10-year Treasury yields (red line).
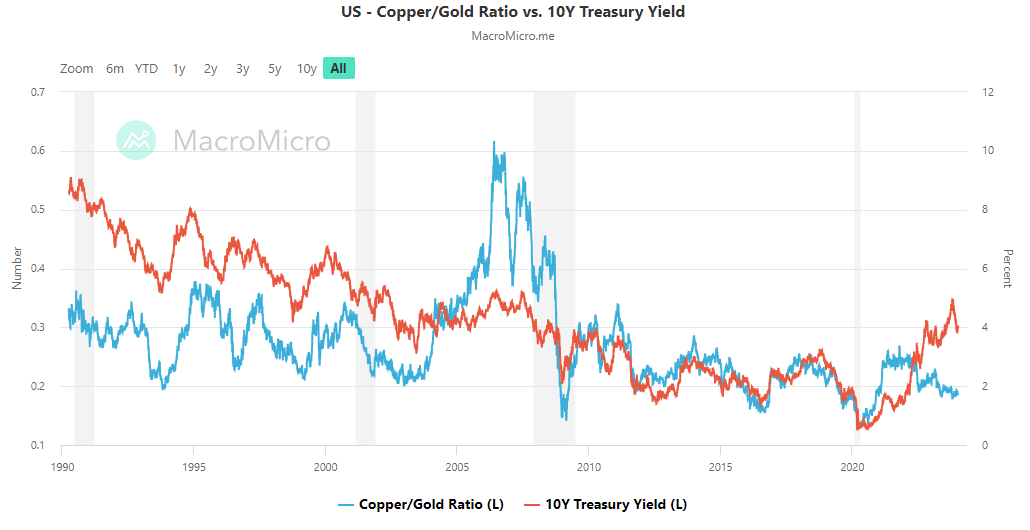
Link to live chart from MacroMicro here
There are unique dynamics at play between these two metals, with copper being an industrial necessity and gold serving as a stable safe-haven.
While the absolute level of the copper/gold ratio may not be crucial, its directionality holds significance. Broadly speaking, the copper/gold ratio becomes an indicator of the market’s risk appetite versus the perceived safety of Treasuries.
Some experts use this ratio as a leading indicator, offering valuable insights into the potential direction of the 10-year U.S. Treasury yield.
Historically, when divergences surface between 10-year yields and the copper/gold ratio, the 10-year yields tend to follow the trend indicated by the copper-gold ratio.
During the third quarter of 2022, a substantial divergence emerged. Yields started moving higher, while the copper-gold ratio moved lower.
This divergence has continued to grow throughout 2023, an unusual occurrence given their typically high correlation. The current divergence implies a potentially significant downward move in Treasury yields within the next 6-12 months.
Interestingly, this aligns with observations within monetary policy circles. The latter half of 2023 has witnessed a discernible shift toward a more dovish stance at the Fed policy-making table.
This transformation is driven by mounting evidence indicating a softening of price pressures and a cooling labor market, despite the Fed’s series of rate hikes from March 2022 to July 2023.
Even previously hawkish policymakers, including Fed Governor Christopher Waller, have stepped back from their earlier support for rate increases.
Deutsche Bank’s Brett Ryan highlighted this shift, stating, “Everybody is a hawk when you are fighting inflation. As the upside risks to inflation have diminished, they have changed their view.”
Following the decision to keep rates steady at 5.25%-5.50% a few weeks ago, Fed Chair Jerome Powell acknowledged that the timing of rate cuts would be the Fed’s “next question,” causing bond yields to drop and markets to factor in the anticipation of swift policy rate reductions starting as early as March, according to the Fedwatch indicators.
The intricate dance between the copper-gold ratio and 10-year Treasury yields reveals a compelling narrative. The ongoing divergence, particularly evident since the end of 2022, suggests a potentially significant downward shift in Treasury yields sometime this year.
For those still undecided on the trajectory of interest rates, the historical reliability of the copper/gold ratio suggests a strong signal—a downward trajectory in the coming year. An outcome that is likely to align with a response to the next significant economic disaster.

Call 1-888-GOLD-160 and speak with a Precious Metals Specialist today!
Buka akaun dagangan patuh syariah anda di Weltrade.
Source link