

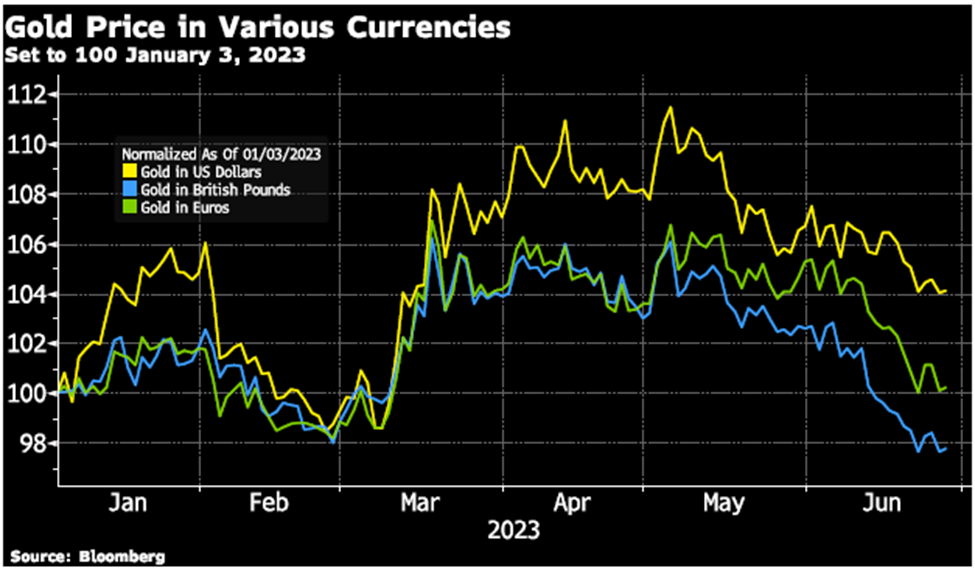
Gold and silver prices have declined in recent weeks as central banks have once again turned more ‘hawkish’ than was expected at the beginning of the year. But, as with anything, these things don’t happen in a vacuum. As we describe below, monetary policy is causing major trouble across a number of sectors, who can tell where the biggest crack will appear first. But, when it does, you’ll be pleased you chose to hold gold and silver during times like these.
Tightening policy, at such a rapid pace is causing stress in every sector of the economy, especially the financial, real estate, and household sectors. See our post on April 13 Has the IMF Told the World to Buy Gold? which outlines key fault lines that have been exposed by the rapid interest rate increases.
Any one of these fault lines could erupt into a major ‘storm’ and most likely it will be a combination of defaults and restructuring of debt as we discussed in the post on June 1 Global Debt Crisis: Pretend and Extend? Central banks will once again fire up the printing presses to save select banks, companies, and governments, further devaluing their currencies in the process. For investors, it is a gamble as to which will be saved, and which will be let default or restructured to the detriment of current investors.
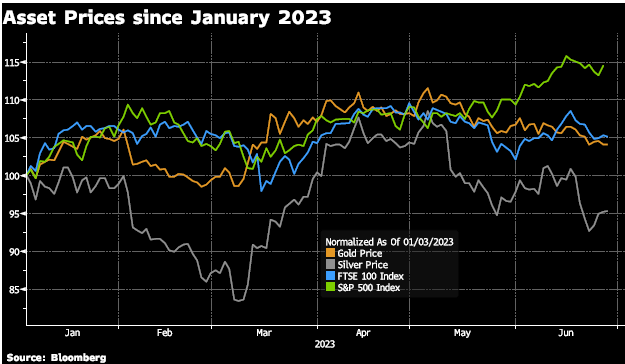
It’s not only gold and silver prices that have faced challenges, but the equity, bond, and housing markets have all seen value declines in recent weeks. The chart below shows gold and silver prices along with two sample equity market indices performance since the beginning of the year.
The major exception in the chart below is the S&P 500 index which has risen sharply in recent weeks on the back of the largest seven companies in the index.
Mid-year update
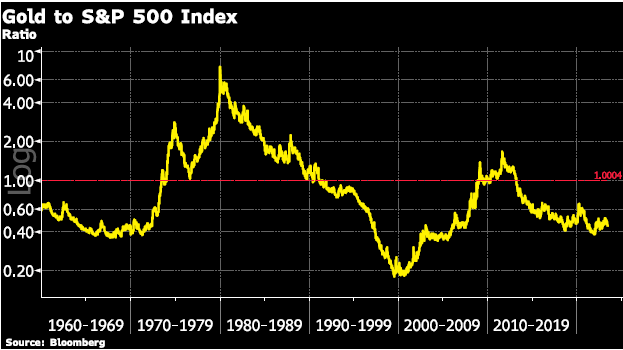
The start of a recession is one time when both gold and equity prices decline at the same time, but in general gold rallies as central banks scramble to cut rates and restore financial/market stability.
The chart below is the long-term look at the gold to S&P 500 ratio. The peaks in the ratio signaled a peak in the gold price and the bottom of 1999-2000 signaled a peak in the S&P 500. The ratio appears to have set a low in December 2021 and set to explode higher as gold rallies during the next fiat currency printing cycle.
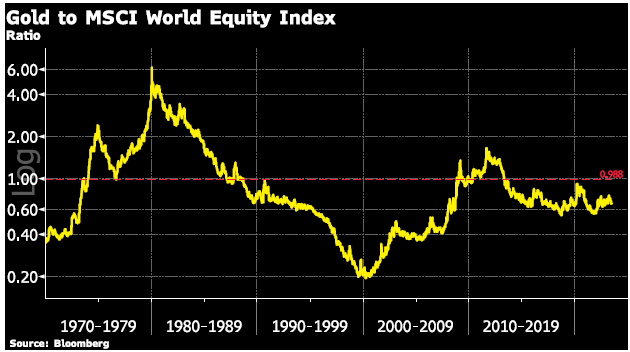
The gold price ratio to the broader MSCI World Equity Index shows a very similar pattern as the ratio between the gold price and the S&P 500.
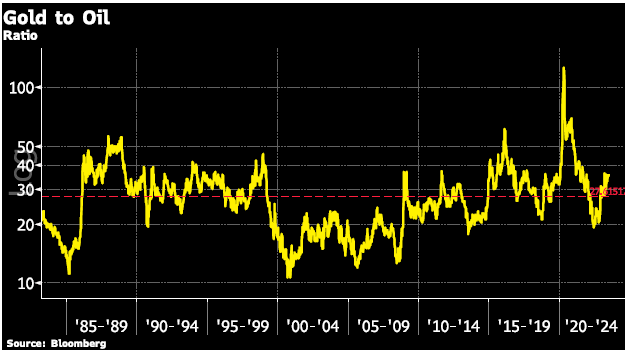
The gold to oil price doesn’t show a clear long-term relationship – however, over the coming months as economic weakness sets in we can expect gold to rise sharply in terms of oil.
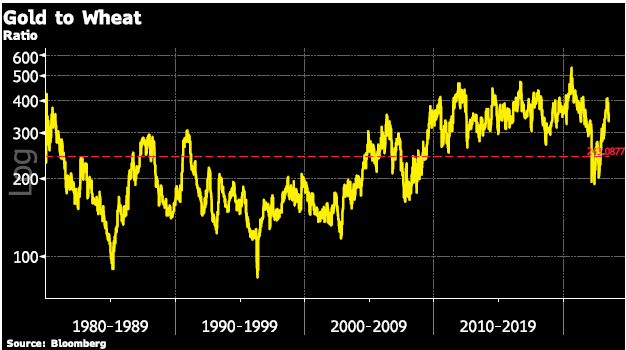
The ratio of the gold price to wheat declined sharply in 2021 when wheat prices surged due to the supply shortage, however, the ratio has reverted to the longer-term average.
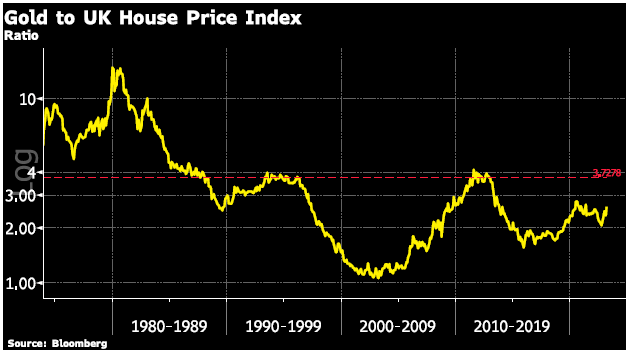
The last chart in this section is the gold price to UK house prices. The relationship between gold and house prices is surprisingly similar to that of gold with the S&P 500 and MSCI. Historically, house prices have been a good store of value, which in the long-run will likely continue. However, in the short-run house prices are likely to decline further as the effects of higher interest rates weigh on homeowners and buyer affordability.
Holding physical gold and silver is a proven ‘insurance’ vehicle for when the coming financial/economic storm hits. No counterparty risk or devaluation from the printing of fiat currency!
For those new to investing in gold and silver – Our recent podcast The Case For Gold and How to Buy It, featuring GoldCore CEO, Stephen Flood will walk you through the details.
GOLD PRICES ( AM/ PM LBMA FIX– USD, GBP & EUR )
| USD $ AM |
USD $ PM |
GBP £ AM |
GBP £ PM |
EUR € AM |
EUR € PM |
|
|---|---|---|---|---|---|---|
| 28-06-2023 | 1909.85 | 1908.40 | 1503.43 | 1509.74 | 1743.88 | 1745.42 |
| 27-06-2023 | 1923.95 | 1918.90 | 1512.61 | 1505.19 | 1760.22 | 1751.19 |
| 26-06-2023 | 1930.55 | 1922.90 | 1516.06 | 1512.17 | 1771.86 | 1762.15 |
| 23-06-2023 | 1919.35 | 1930.70 | 1510.53 | 1519.27 | 1768.30 | 1773.54 |
| 22-06-2023 | 1927.95 | 1920.05 | 1509.01 | 1505.51 | 1753.08 | 1748.59 |
| 21-06-2023 | 1935.25 | 1925.65 | 1521.11 | 1514.33 | 1771.14 | 1762.74 |
| 20-06-2023 | 1953.85 | 1930.45 | 1528.11 | 1516.75 | 1787.38 | 1767.91 |
| 19-06-2023 | 1954.35 | 1951.15 | 1525.37 | 1524.63 | 1789.01 | 1786.86 |
| 16-06-2023 | 1964.10 | 1959.75 | 1535.34 | 1527.43 | 1794.40 | 1790.04 |
Buy gold coins and bars and store them in the safest vaults in Switzerland, London or Singapore with GoldCore.
Learn why Switzerland remains a safe-haven jurisdiction for owning precious metals. Access Our Most Popular Guide, the Essential Guide to Storing Gold in Switzerland here
Receive Our Award Winning Market Updates In Your Inbox – Sign Up Here
Source link


