

Seasonally Adjusted Money Supply in May increased $131B. This is the first growth in adjusted M2 since last July and the largest increase since December 2021.
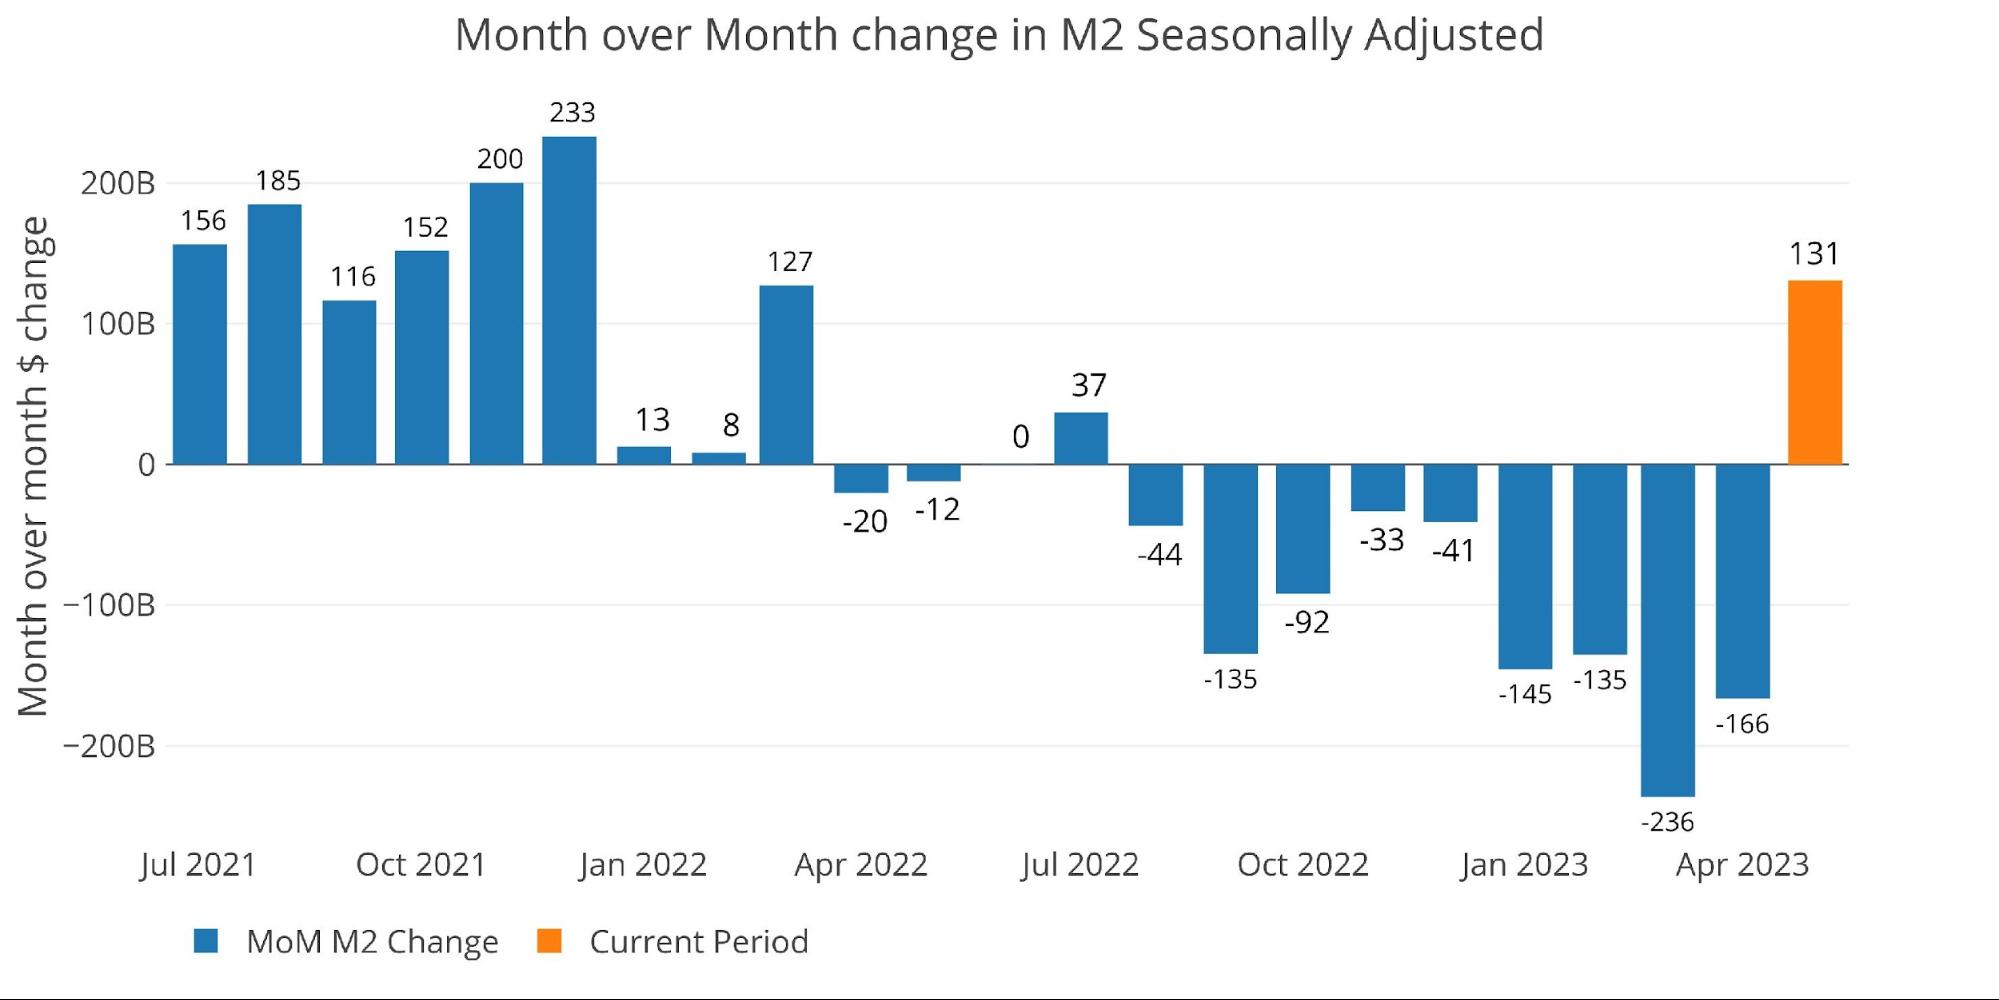
Figure: 1 MoM M2 Change (Seasonally Adjusted)
Below are the unadjusted raw numbers which are slightly ahead of the adjusted numbers. The orange bar aligns with the same time period as the orange bar above. May came in as an increase of $84B with an increase of $105B so far in June (data as of June 5th). The beginning of the month always looks positive, so it is too early to tell if June will end up as a positive growth month.
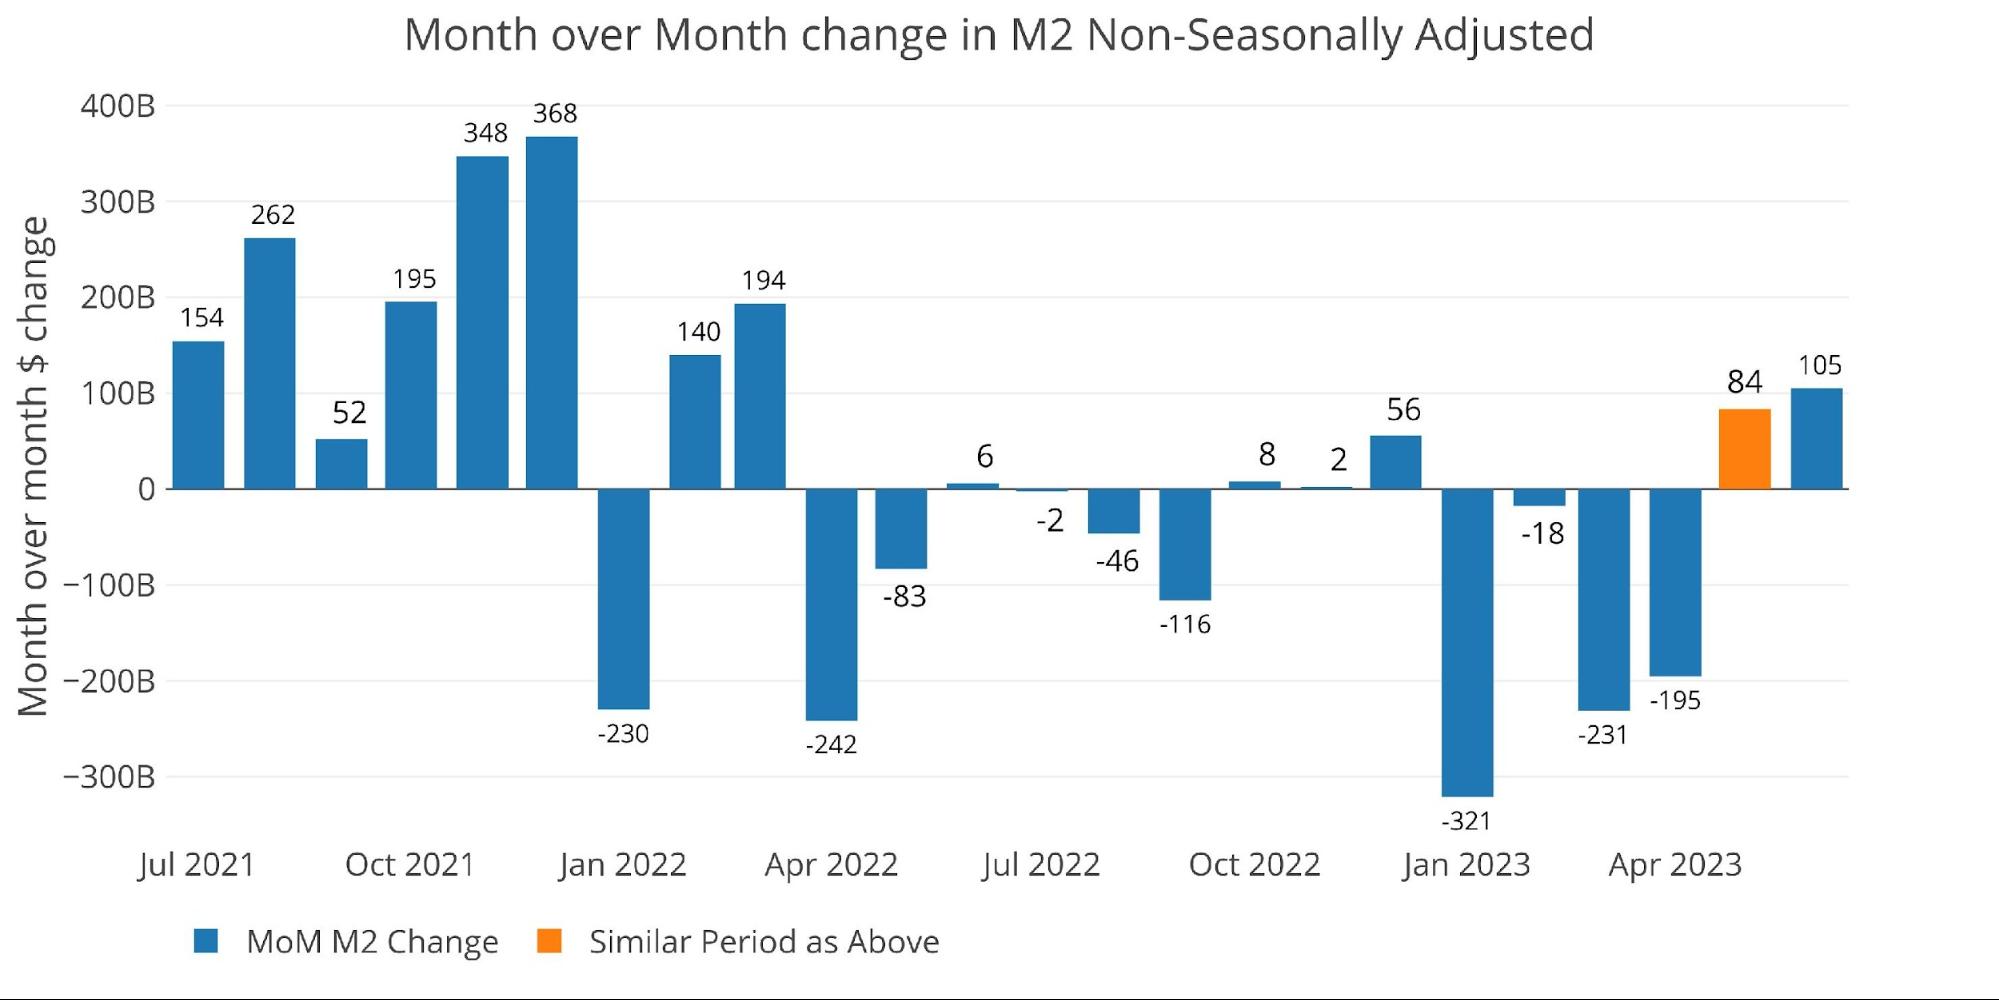
Figure: 2 MoM M2 Change (Non-Seasonally Adjusted)
Looking at the seasonally adjusted numbers show that this month increased the Money Supply by 7.9% annualized which is well above the 6-month, 1-year, and 3-year trend.
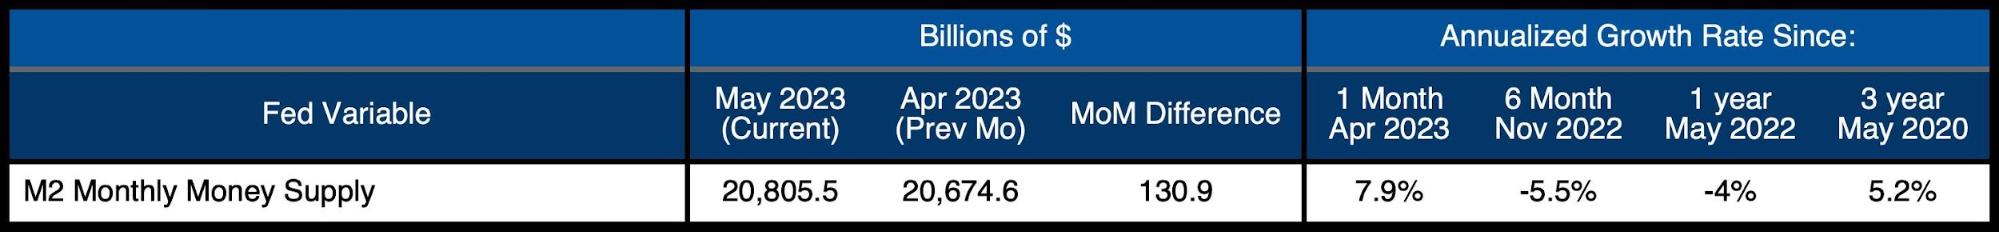
Figure: 3 M2 Growth Rates
The average for May (pre-Covid) was 6.2% which means that this latest month is above the historic average from 2010-2019.
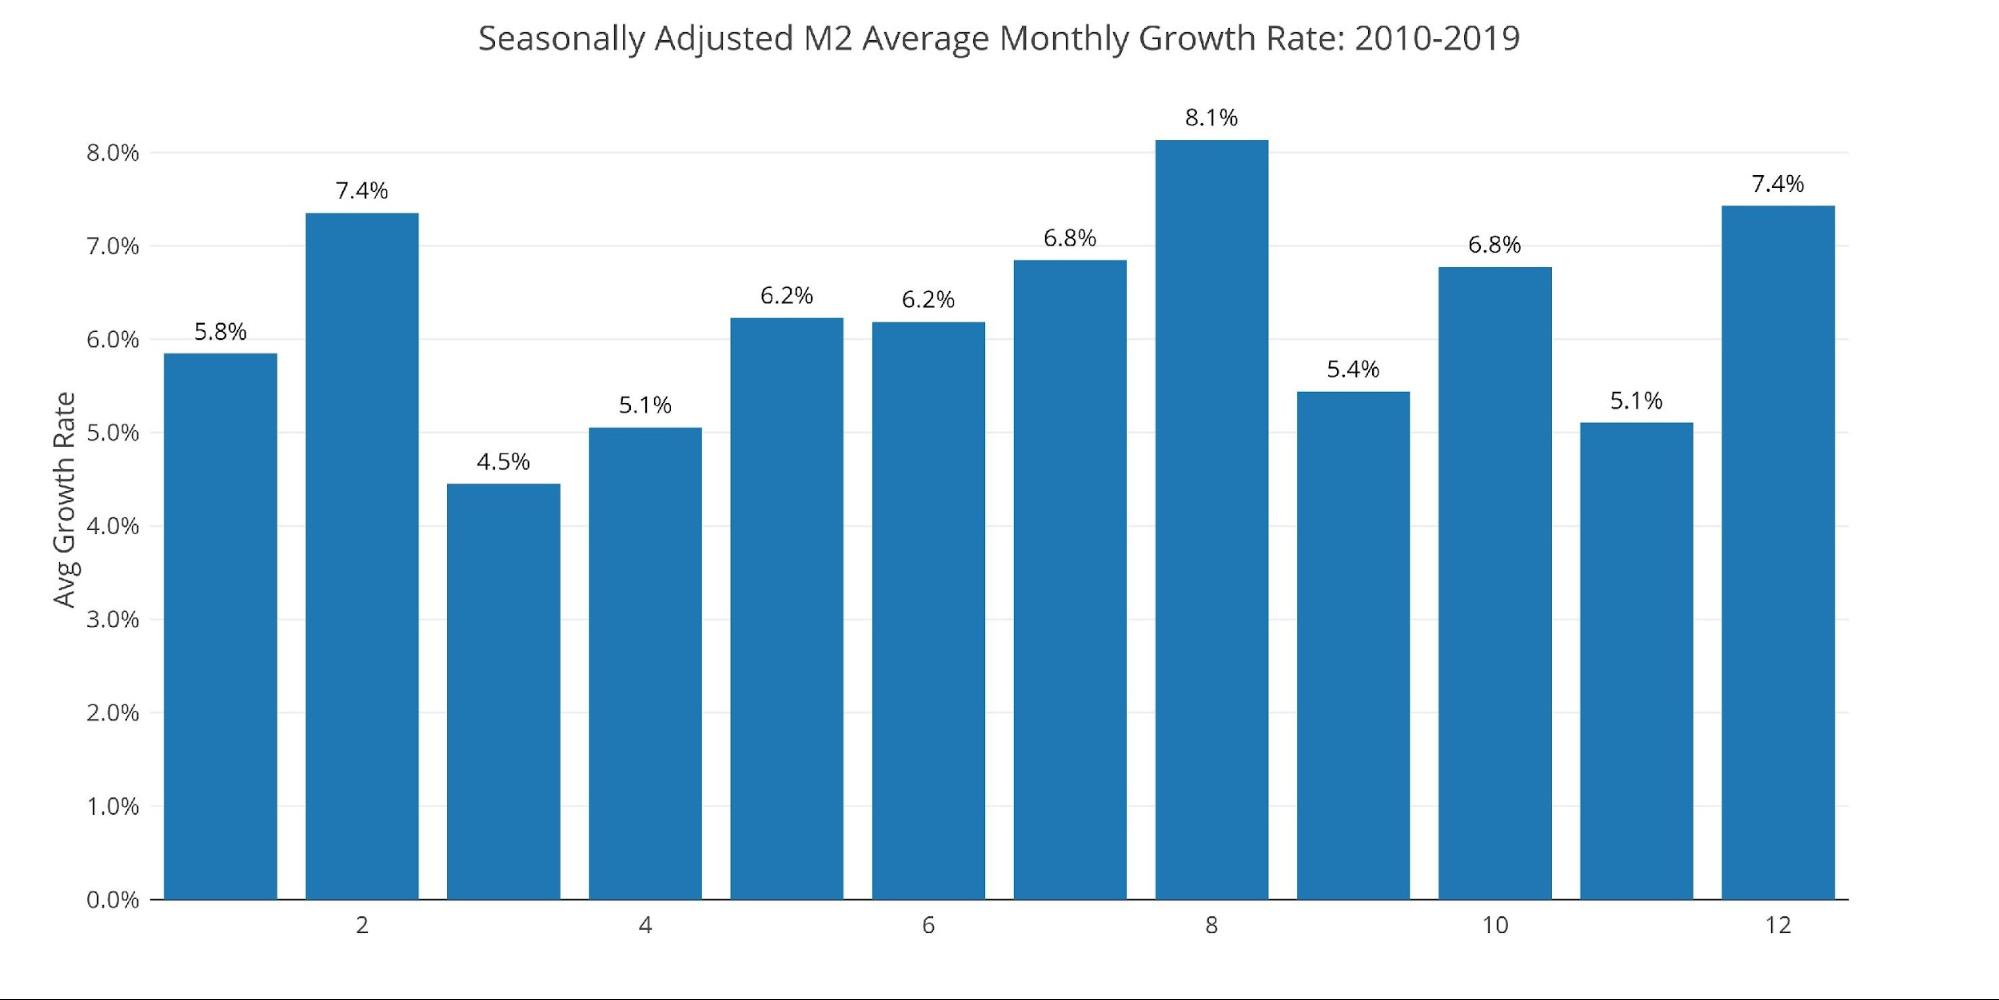
Figure: 4 Average Monthly Growth Rates
The weekly data below shows the activity over the last month in unadjusted money supply. May was positive more as a result of missing negative numbers rather than strong positive numbers. While the positive jumps are slightly larger than what has been seen over the last year, the jumps are still well below the increases seen in 2020 and 2021.
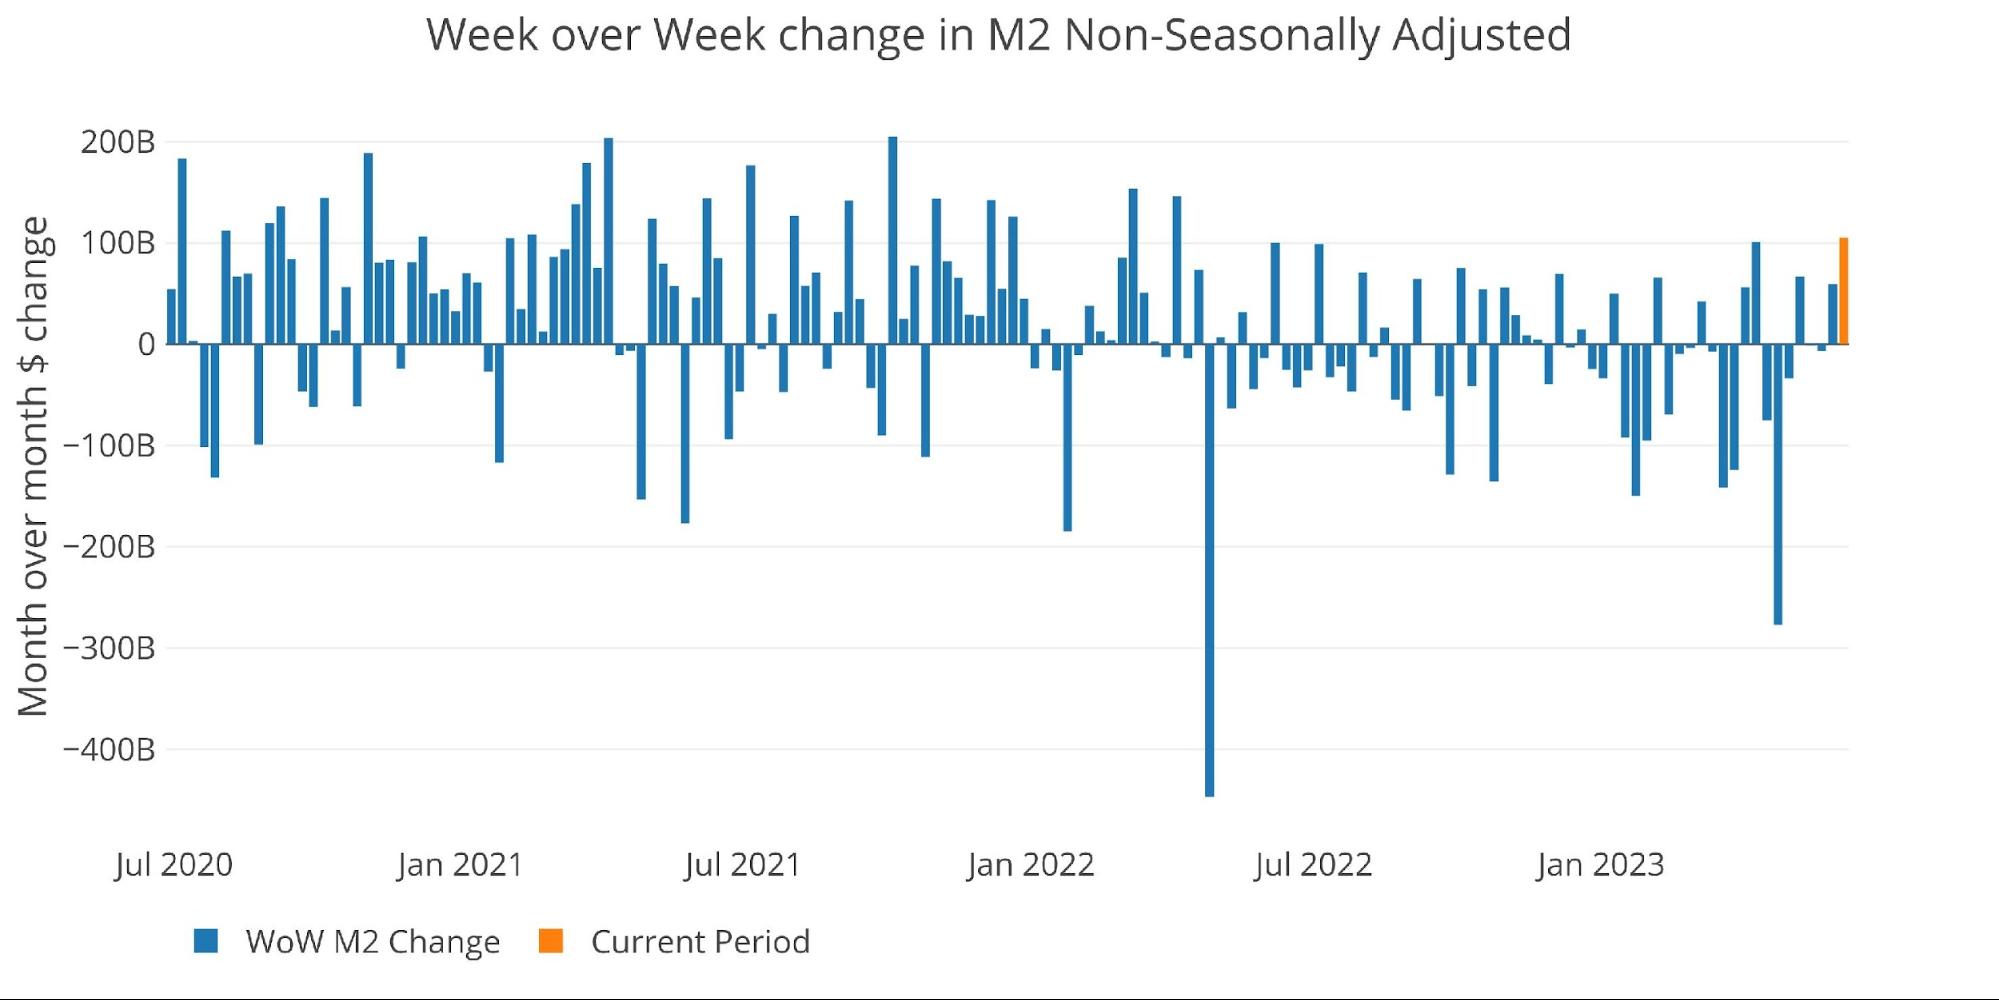
Figure: 5 WoW M2 Change
The “Wenzel” 13-week Money Supply
The late Robert Wenzel of Economic Policy Journal used a modified calculation to track Money Supply. He used a trailing 13-week average growth rate annualized as defined in his book The Fed Flunks. He specifically used the weekly data that was not seasonally adjusted. His analogy was that in order to know what to wear outside, he wants to know the current weather, not temperatures that have been averaged throughout the year.
The objective of the 13-week average is to smooth some of the choppy data without bringing in too much history that could blind someone from seeing what’s in front of them. The 13-week average growth rate can be seen in the table below. Decelerating trends are in red and accelerating trends in green.
The 13-week average reached an all-time low of -7.9% in the last week of May before rebounding slightly to -7.87% in the first week of June. This is still the second-largest contraction in Money Supply ever and only slightly above the record set the week before.
Bottom line, Money Supply is still incredibly weak. The change in Money Supply has been in negative territory for 50 weeks. It is hard to explain how unprecedented this change in Money Supply really is. Hopefully, the charts below can paint the picture.
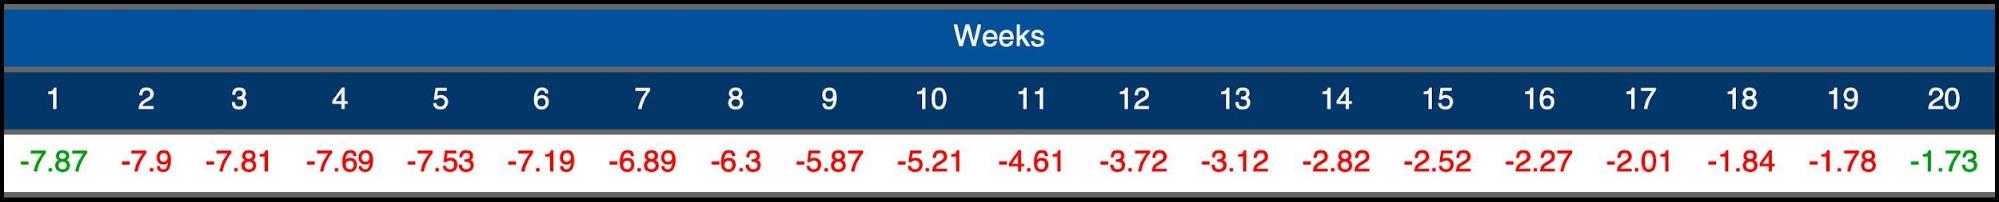


Figure: 6 WoW Trailing 13-week Average Money Supply Growth
The plot below shows how this year compares with previous years. You can see when Money Supply first went negative around the same time last year. The uptick in the latest week is actually fairly common for Money Supply around this time of year before another drop occurs later in the summer. If Money Supply does end up dropping further by August, then it could drag the growth rate down below -10% which would be an incredible reversal from 3 years ago when Money Supply was growing at over 60%.
Regardless of what happens, the Money Supply growth is at incredibly depressed levels. This is the impact of modest interest rate increases on an over-leveraged economy.
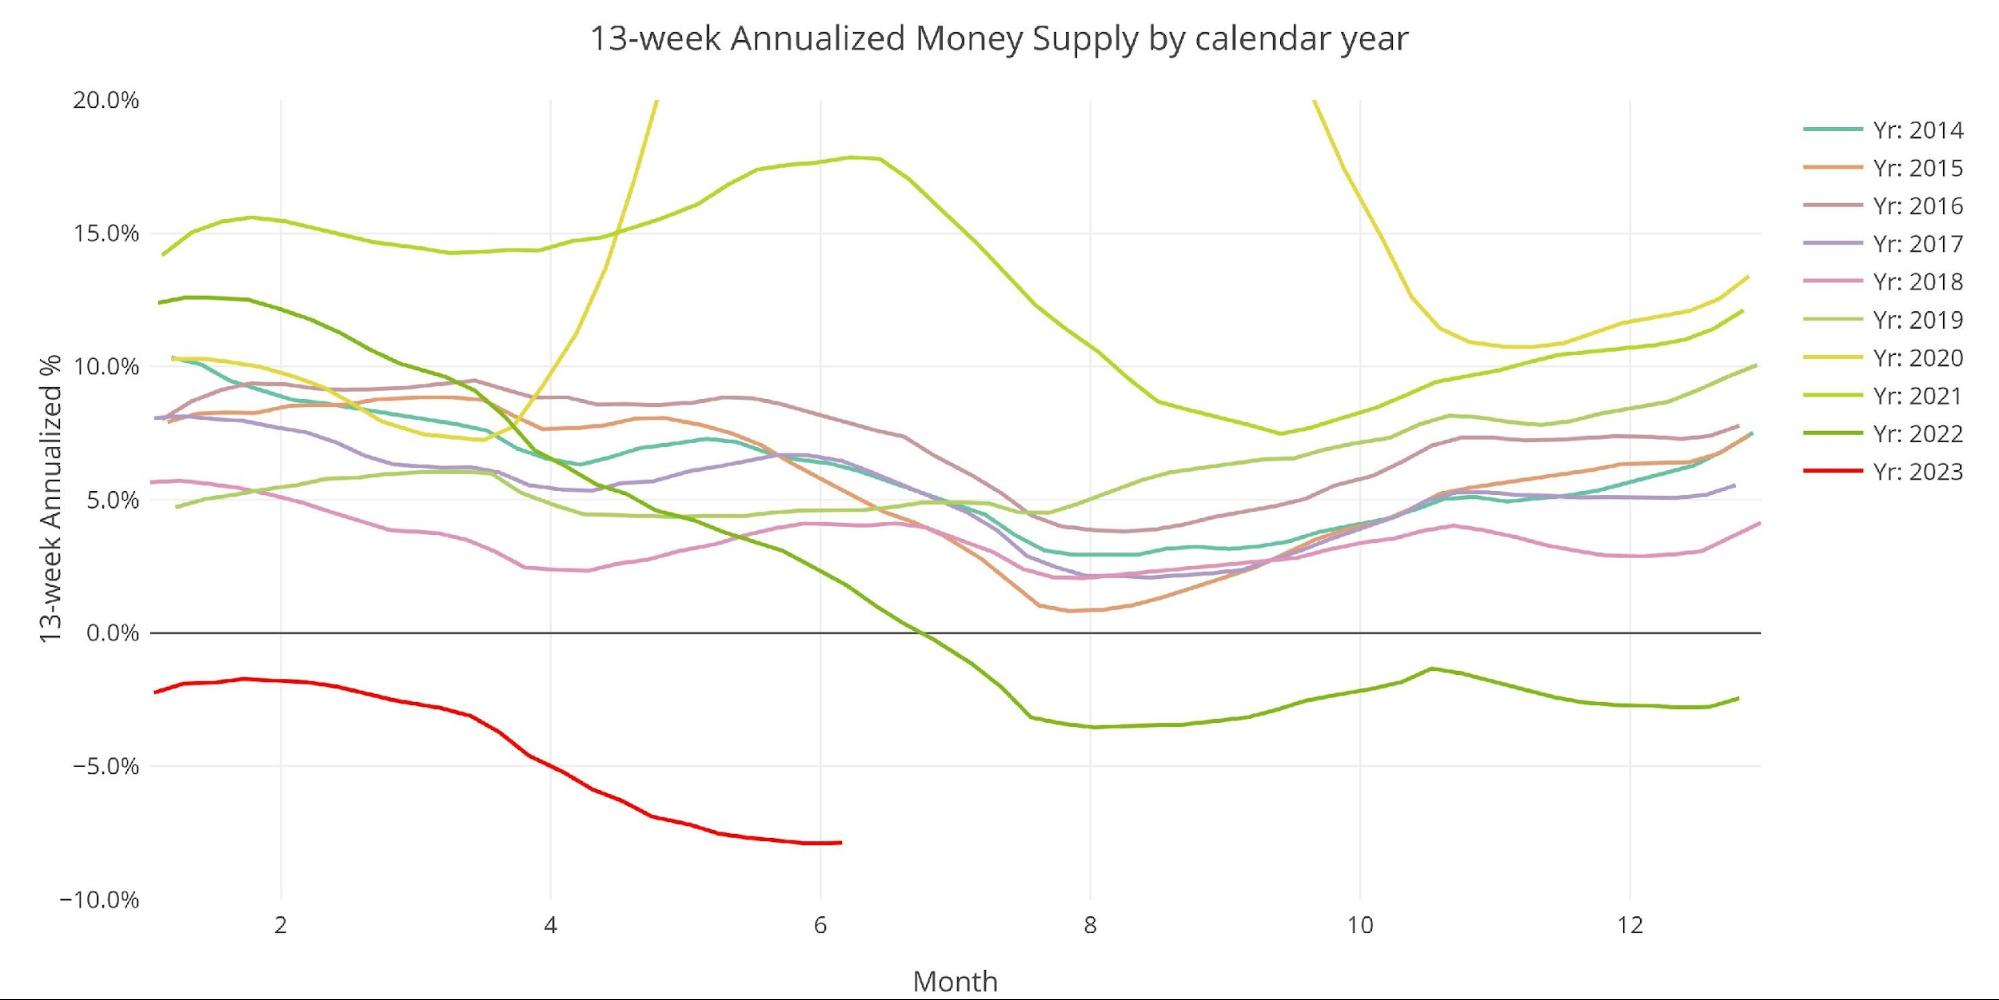
Figure: 7 Yearly 13-week Overlay
Finally Ahead of Inflation
It has taken over 2 years, but the Fed has finally gotten the Fed Funds rate above the rate of inflation. Because of the over-levered US economy, the Fed did not (and could not) raise rates above the rate of inflation at the outset. The modest increase in interest rates over the last year does not appear extreme when compared to history. However, the incredible drop in Money Supply shows the impact it has had and is further evidence that the economy is very different than it was in 2006 and even 2018 during the last rate hiking cycle.
An increase in interest rates has never created a Money Supply contraction like it has this time around. This is why the Fed cannot keep raising rates. Money Supply has already fallen enough to have catastrophic consequences. A further decline will only exacerbate the problems that lie ahead.
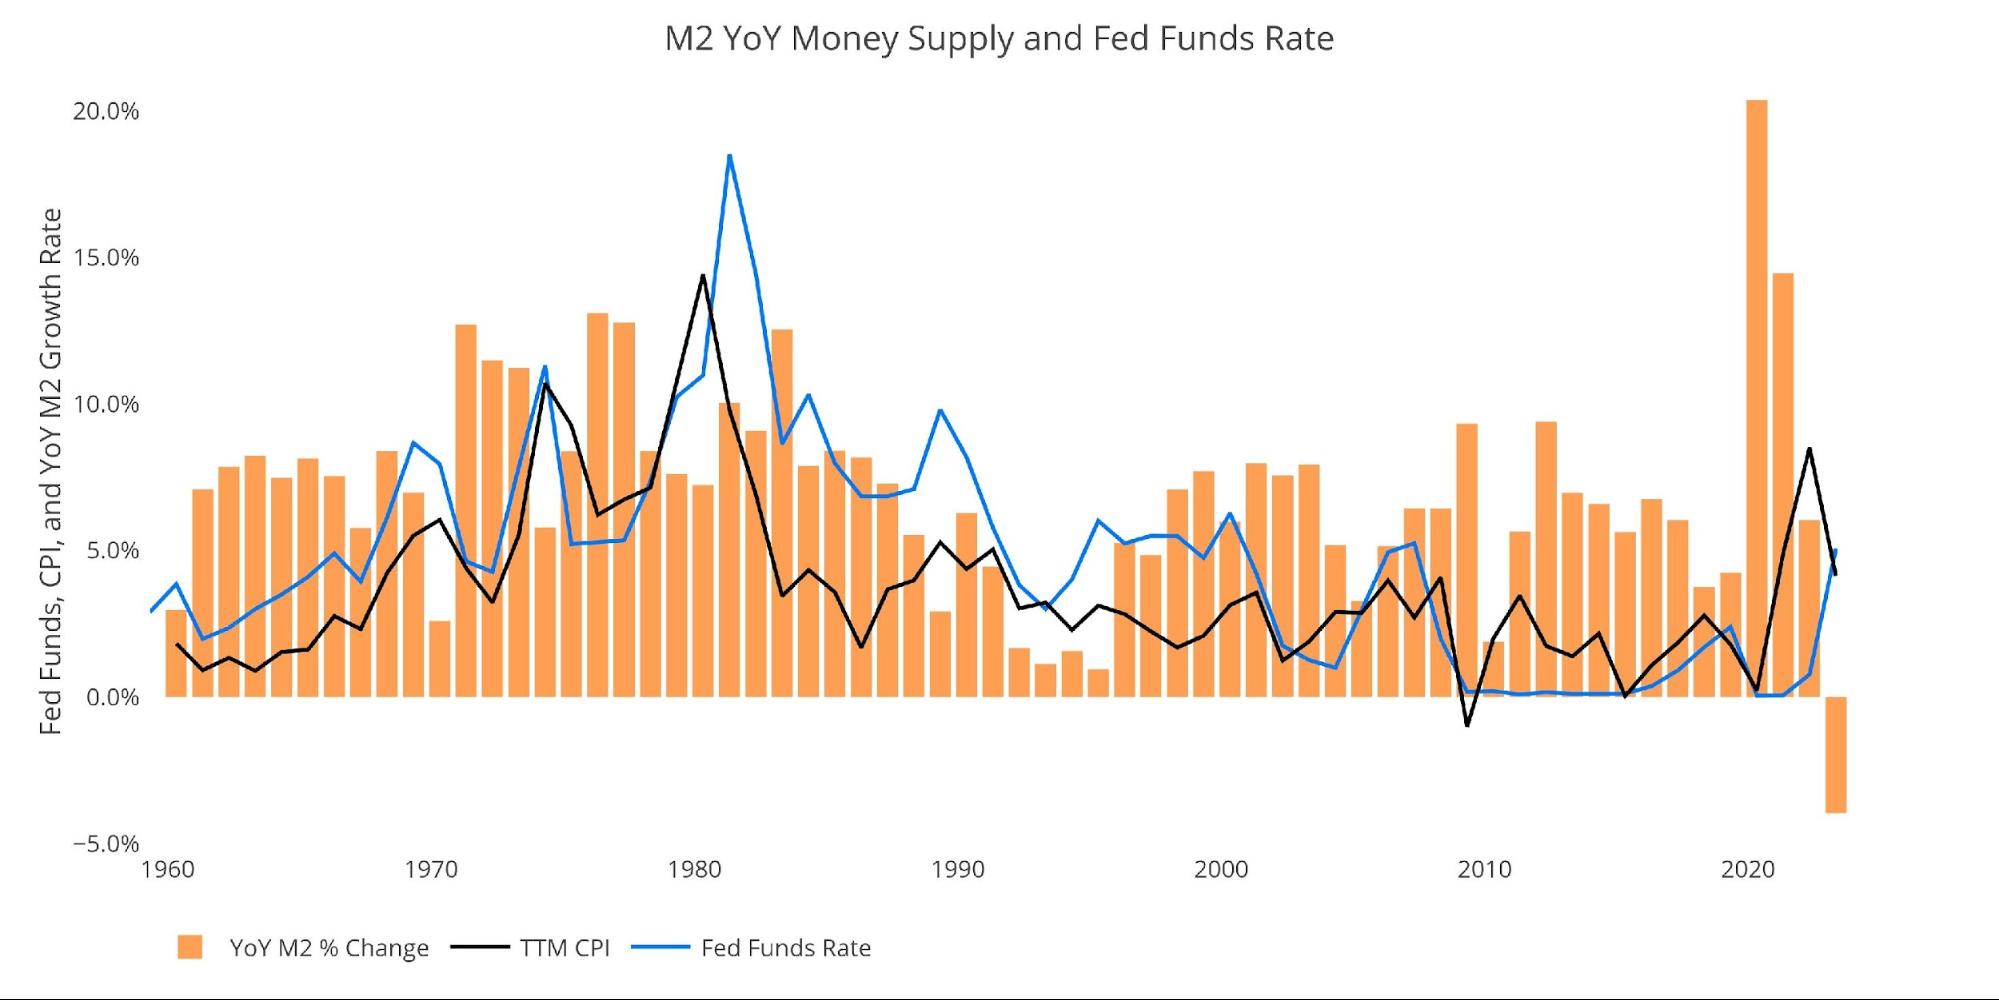
Figure: 8 YoY M2 Change with CPI and Fed Funds
Historical Perspective
The charts below are designed to put the current trends into historical perspective. The orange bars represent annualized percentage change rather than raw dollar amount. The current rebound can clearly be on the right side.
Despite the rebound, this will prove to be far too little and too late. The damage of the collapse in Money Supply has already happened, the tide has just not gone out yet.
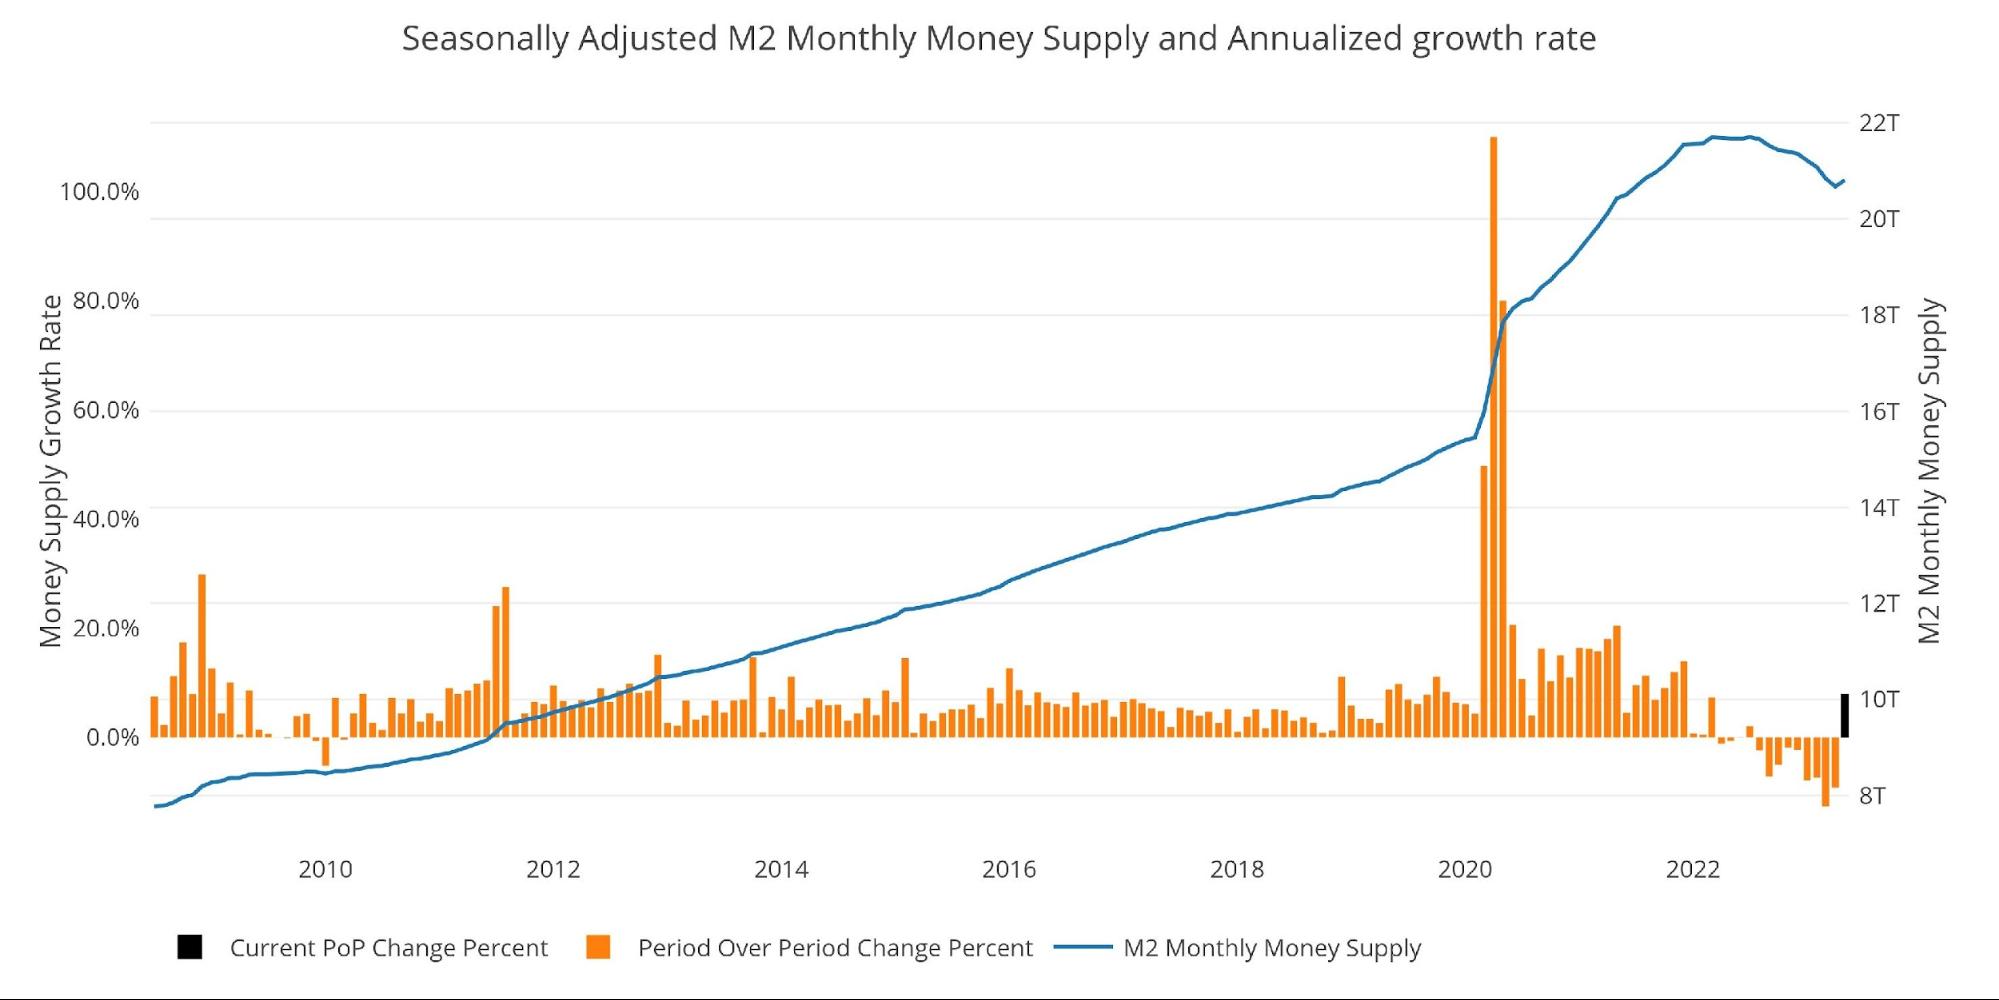
Figure: 9 M2 with Growth Rate
Taking a historical look at the 13-week annualized average also shows the current predicament. This chart overlays the log return of the S&P. Mr. Wenzel proposed that large drops in Money Supply could be a sign of stock market pullbacks. His theory, derived from Murray Rothbard, states that when the market experiences a shrinking growth rate of Money Supply (or even negative) it can create liquidity issues in the stock market, leading to a selloff.
While not a perfect predictive tool, many of the dips in Money Supply precede market dips. Specifically, the major dips in 2002 and 2008 from +10% down to 0%. The economy is now grappling with a peak growth rate of 63.7% in July 2020 crashing to deep negative rates only a few years later.
The effects of this move will be felt sooner rather than later.
Please note the chart only shows market data through June 5th to align with available M2 data.
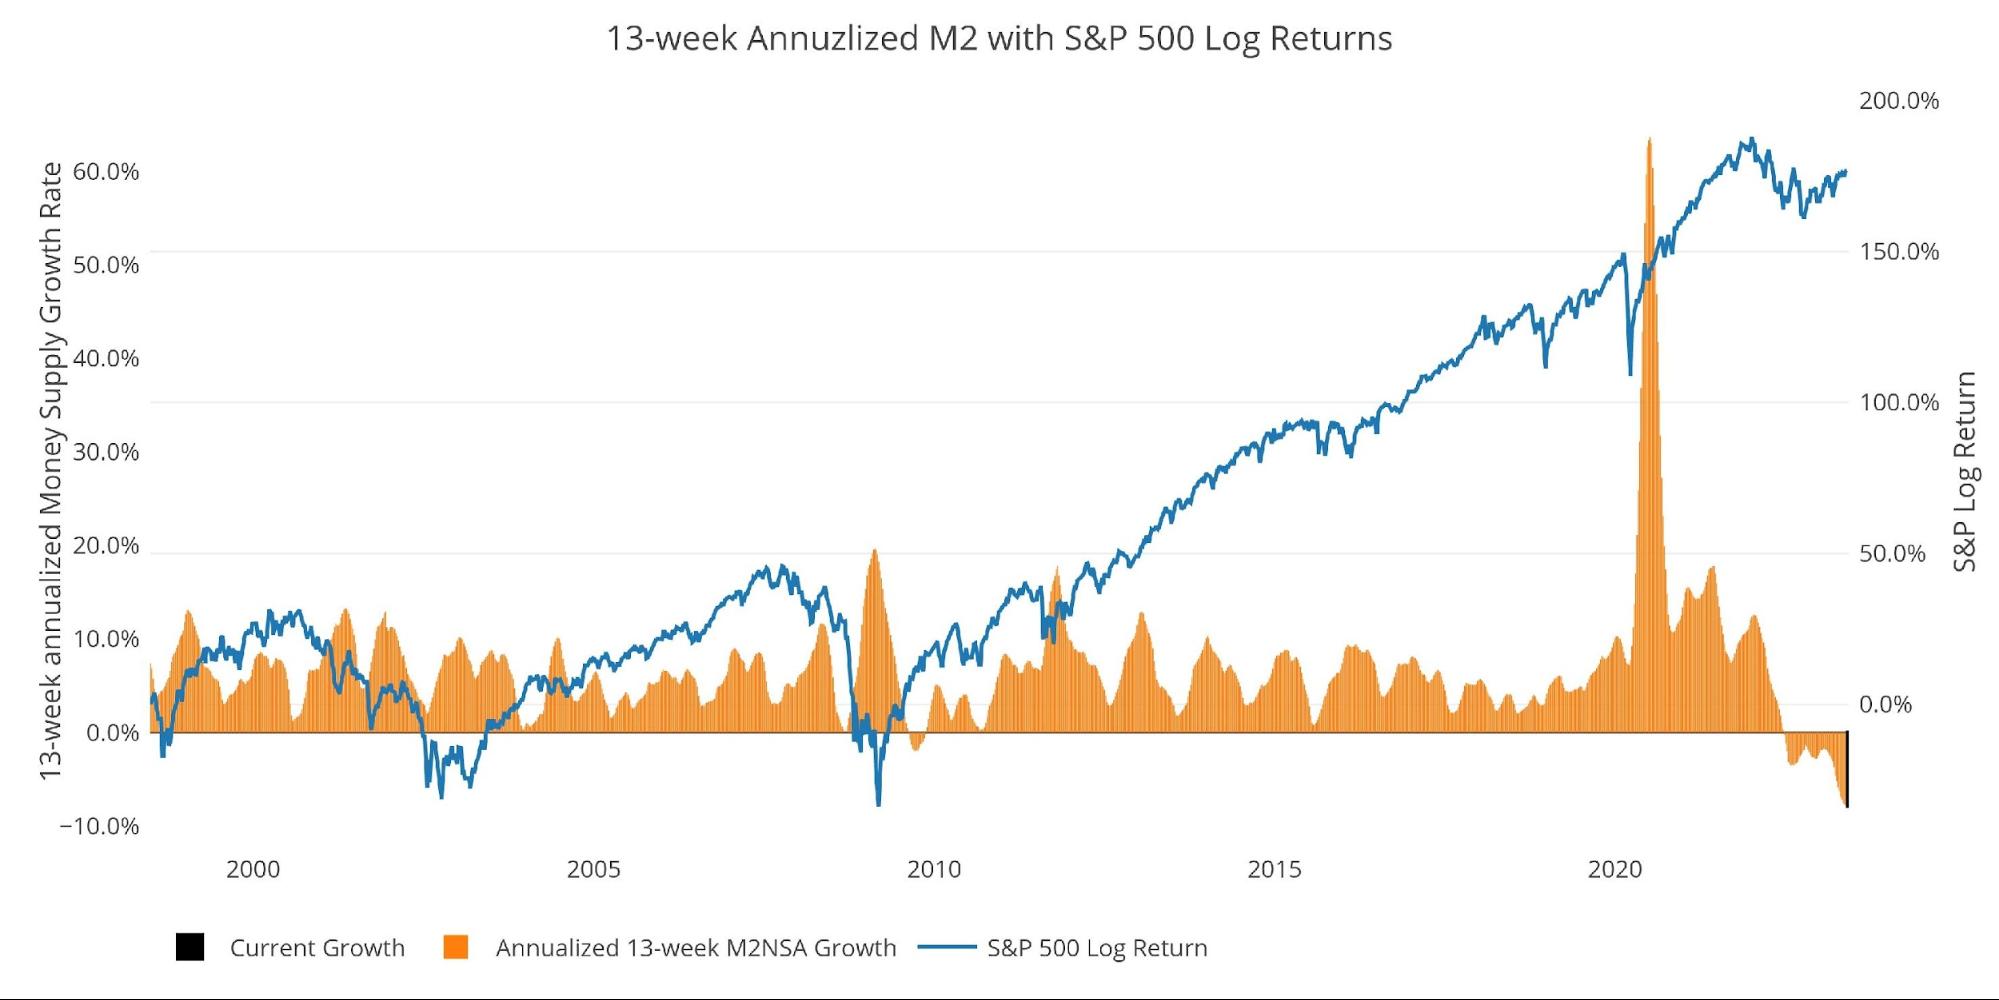
Figure: 10 13-week M2 Annualized and S&P 500
One other consideration is the massive buildup in the reverse repo market at the Fed. This is a tool that allows financial institutions to swap cash for instruments on the Fed balance sheet.
Current Reverse Repos peaked at $2.55T on Dec 30. This broke the previous record from September. Since December, the amount has been coming down some despite rates rising during that time. Even the quarter end in March was unable to get above the December level and June looks like it will be well below the December and September levels (note: this number usually tops out at quarter end).
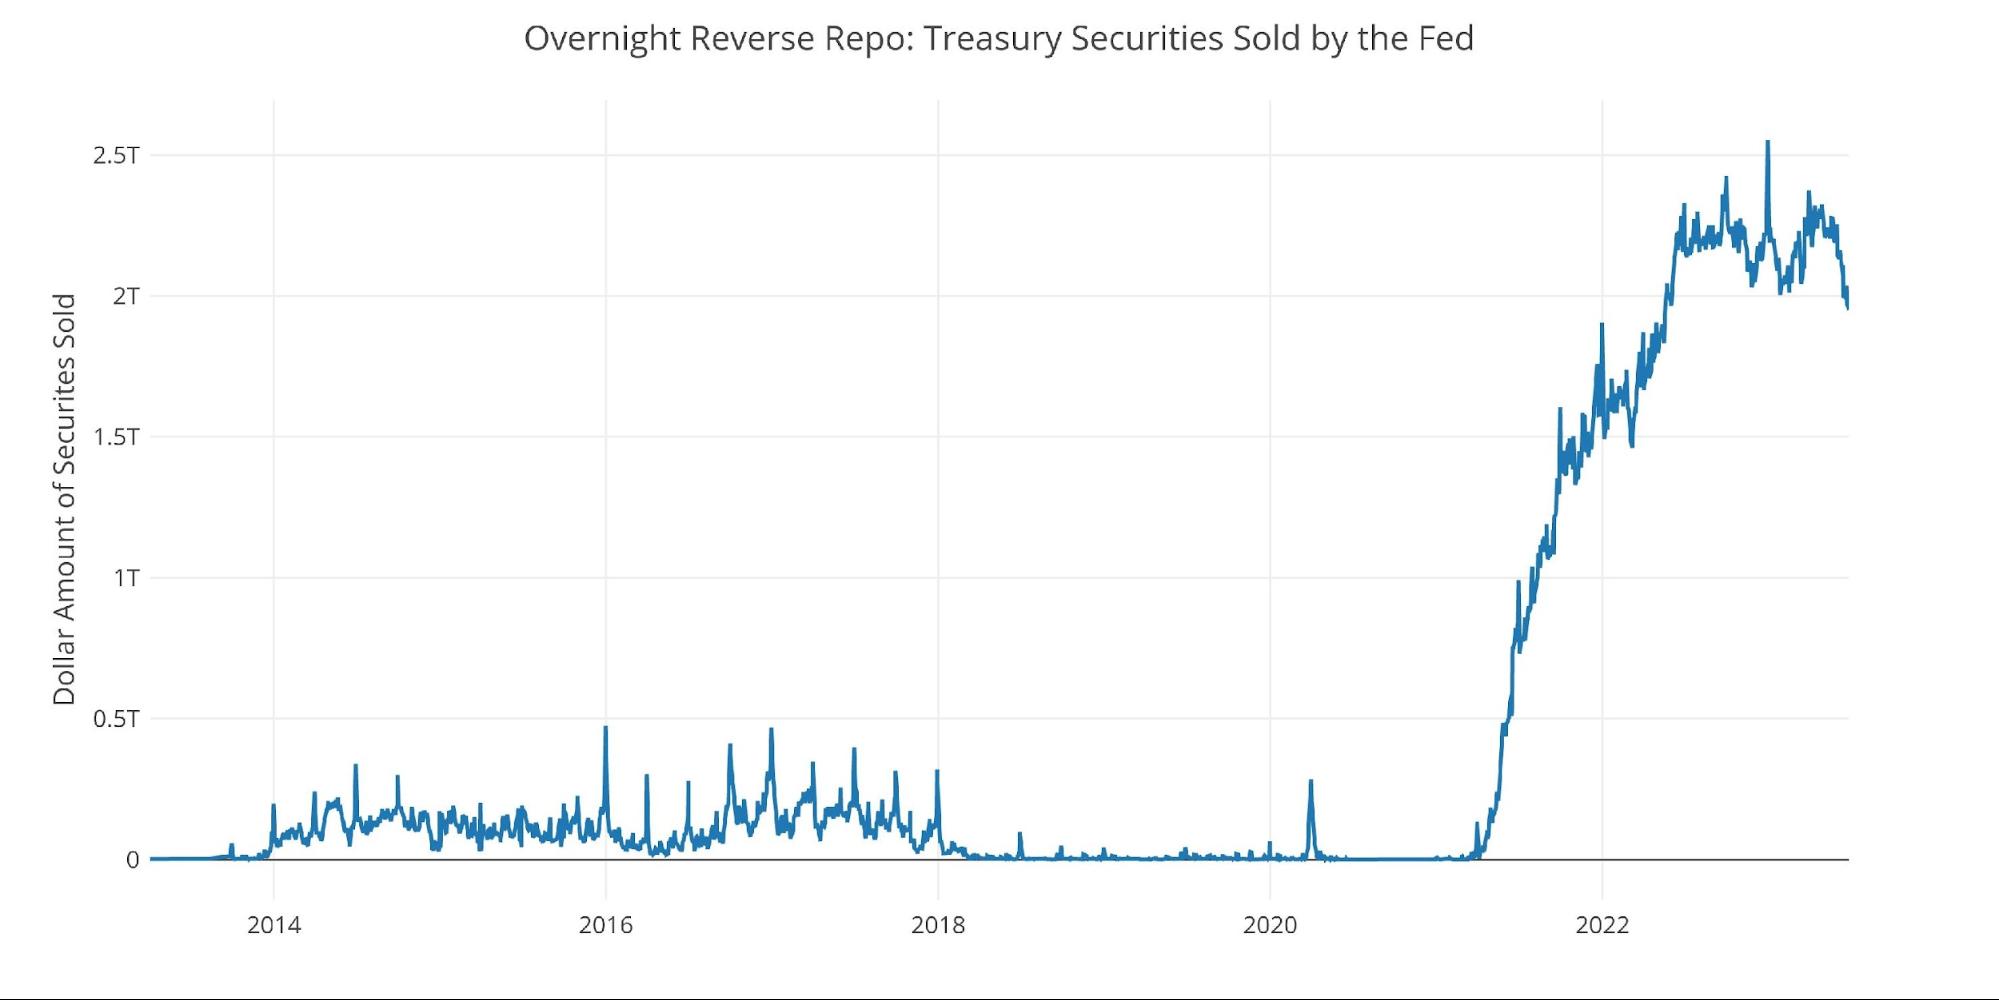
Figure: 11 Fed Reverse Repurchase Agreements
Wrapping Up
I know, I know. I have been ringing the alarm about Money Supply growth for over a year now and nothing has happened (other than multiple banks collapsing). Just because nothing has happened does not mean nothing will happen. The Fed cannot accelerate to unprecedented speeds and then slam on the breaks without negative consequences.
These things take time to play out, oftentimes more than a year or two. The Fed is only 12 months into the rate hiking cycle and Money Supply went negative less than 1 year ago. There is almost zero chance the Fed can make it another year with rates at current levels. There is too much pressure building up in the system. This is not a matter of “if” but “when”. It’s impossible to predict what will be the trigger or when it will happen. But something is going to break sooner rather than later… at that point the Fed is going to be forced to blow the Money Supply back up or face catastrophic consequences. That is when the de-dollarization trend will pick up momentum.
Data Source: https://fred.stlouisfed.org/series/M2SL and also series WM2NS and RRPONTSYD. Historical data changes over time so numbers of future articles may not match exactly. M1 is not used because the calculation was recently changed and backdated to March 2020, distorting the graph.
Data Updated: Monthly on fourth Tuesday of the month on 3-week lag
Most recent data: Jun 05, 2023
Interactive charts and graphs can always be found on the Exploring Finance dashboard: https://exploringfinance.shinyapps.io/USDebt/

Call 1-888-GOLD-160 and speak with a Precious Metals Specialist today!
Buka akaun dagangan patuh syariah anda di Weltrade.
Source link