
Last month, the US Treasury realized its first surplus in 2.5 years; unfortunately, the surplus was short-lived with the Treasury going in the red by $216.6B during February.
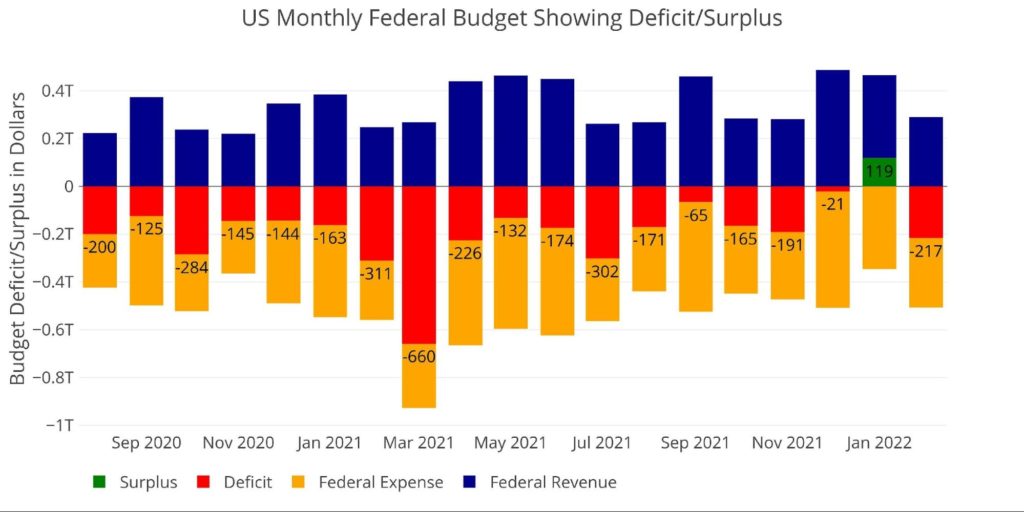
Figure: 1 Monthly Federal Budget
The Sankey diagram below provides a look at spending and revenue. The deficit represented 42.8% of total spending which means that revenue only covered 57.2% of total expenditures. The full deficit represented nearly all of Income Security and Social Security combined!
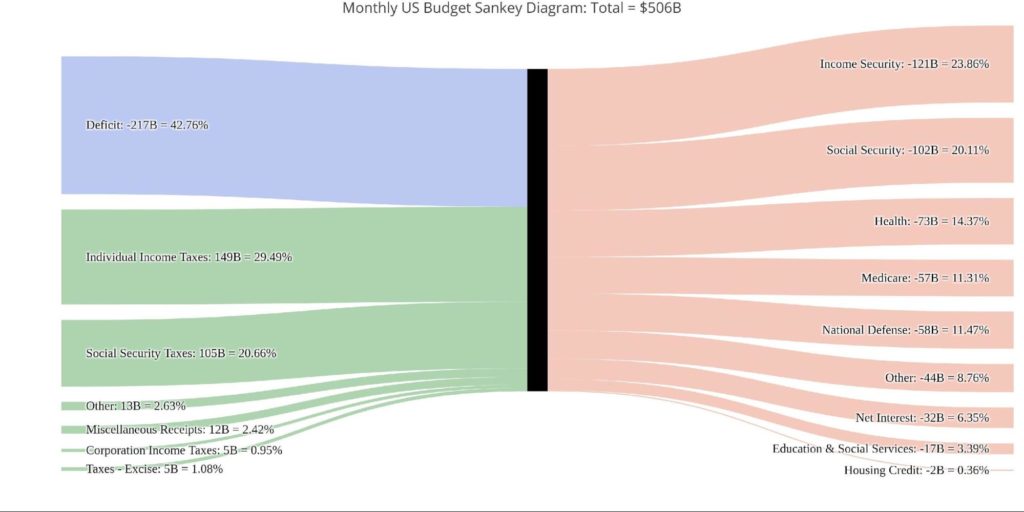
Figure: 2 Monthly Federal Budget Sankey
Comparing the monthly (above) to the yearly (below) shows that the current monthly deficit is actually larger than the TTM deficit on a relative basis (42.8% vs 33.26%). Individual taxes were noticeably smaller in the current month, representing ~30% of total spending vs 35% for the TTM.
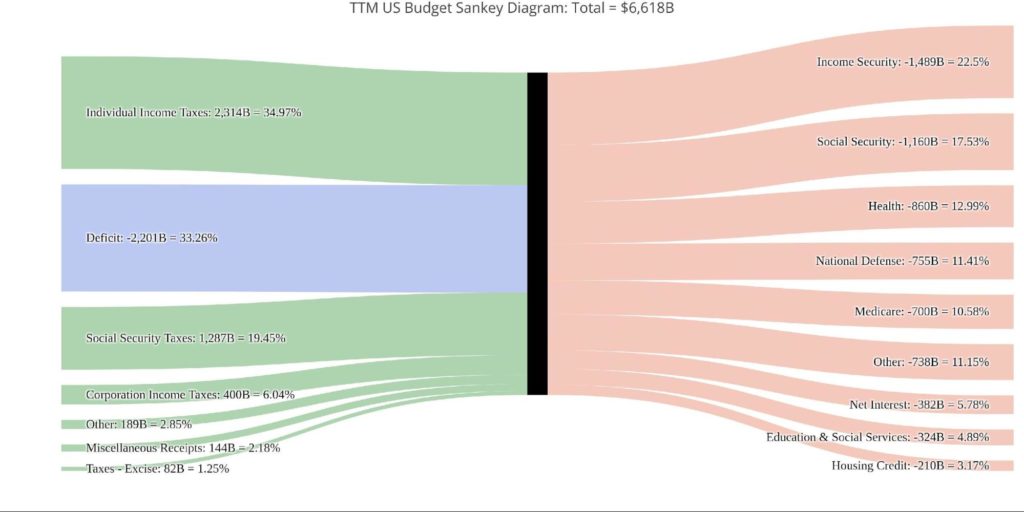
Figure: 3 TTM Federal Budget Sankey
Figure 4 below, expands on the revenue side of Figure 1 above. As shown, Corporate Taxes is quite inconsistent, with some months showing large increases and other months completely flat. Individual Taxes fell by almost 50% MoM.
Looking at last year, February and March both showed a dip when compared to January. This was then followed by three strong months from April-June.
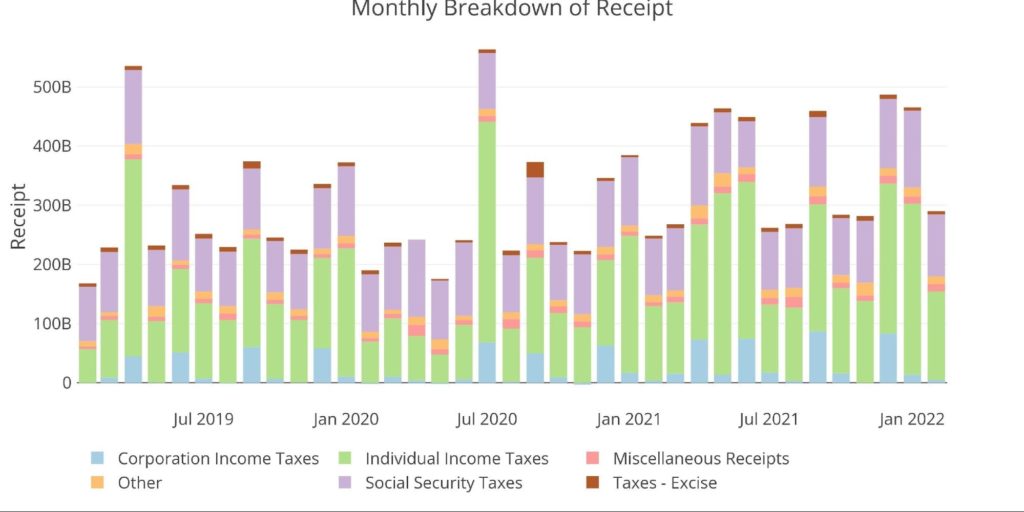
Figure: 4 Monthly Receipts
The expense side is a bit steadier month over month. The exception appears to be in January which saw “Other” actually turn positive due to Offsetting Receipts. This month also saw an increase in Income Security despite the child tax credit ending in December. Over the past two years, this has represented stimulus payments, but Income Security actually consists of six different categories.
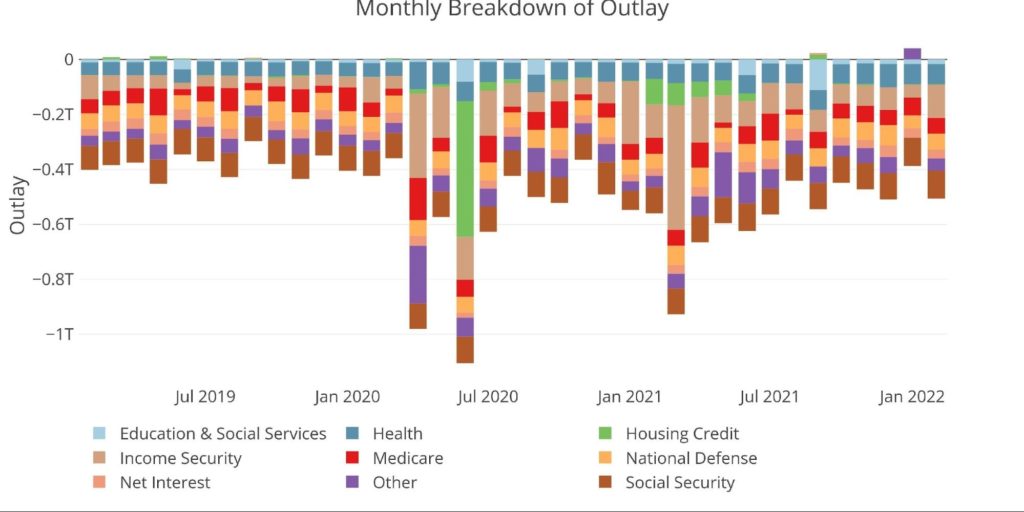
Figure: 5 Monthly Outlays
The table below goes deeper into the numbers of each category. The key takeaways from the charts and table:
Outlays
- Debt Interest is up 25% year over year even though the Fed has not yet started raising rates
- On a TTM basis, Debt Interest is up 19.1%
- YoY all categories have increased except Income Security, Medicare, and Housing Credit
- On a TTM basis, only “Other” has also decreased
- TTM spending on Education, Training, Employment, and Social Services is up $83.5B or 35%
- Compared to pre-pandemic it’s up 134% or $185B
Receipts
- TTM Individual Taxes are up 41% ($2.3T vs $1.6T) and up 31% compared to pre-Covid levels
- In two years, Individual Taxes have climbed $550B!
- TTM Corporate Taxes ($399B) are up an incredible 76% ($227B) and up 63% from the TTM ending 2019 ($245B)
- The current month was below the TTM average, but 27% above the prior February
Total
- Total Receipts are up more than $900B (26.6%) in a single year!
- TTM Outlays are down 6.1% as stimulus has come to an end, but are still up 43.4% or $2T from pre-Covid levels
- The deficit is 30% smaller than last February due to a combination of lower spending and higher taxes
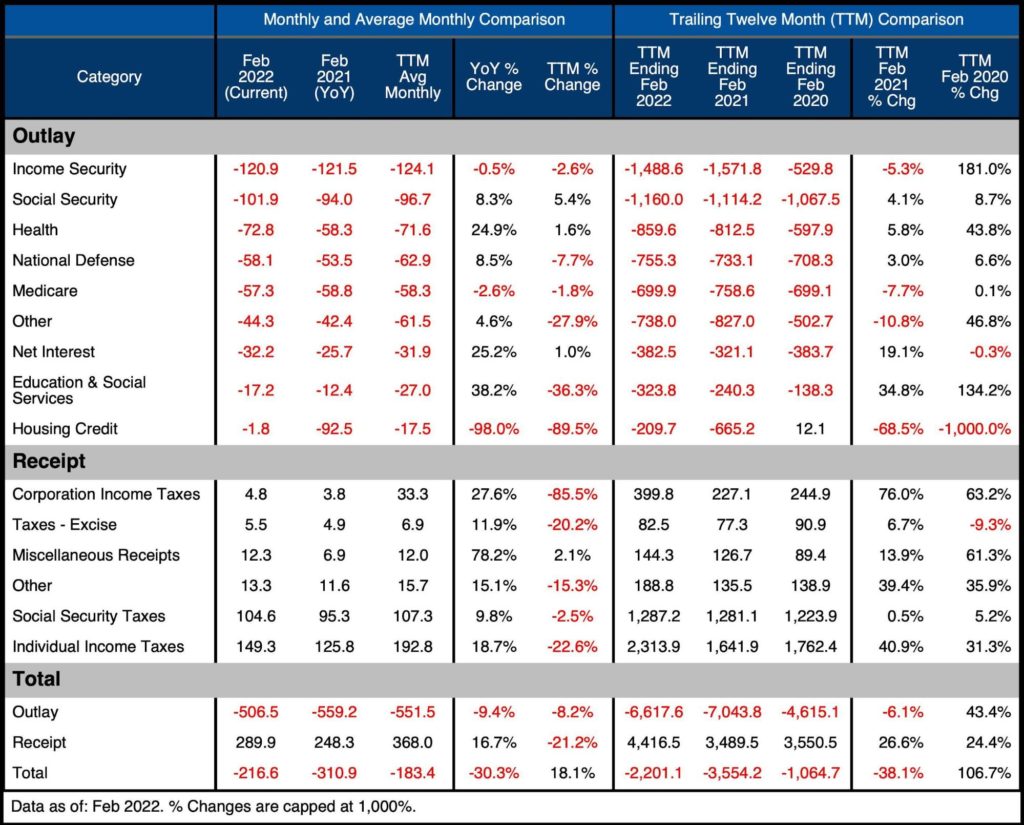
Figure: 6 US Budget Detail
Historical Perspective
Zooming out and looking over the history of the budget back to 1980 shows a complete picture and just how extreme the last two years have been. The chart below shows the data on a TTM basis to smooth out the lines.
As can be seen, Expenses have fallen recently. After holding steady near $6.8T for 7 months, expenses have fallen to $6.6T. Revenue has done the opposite. TTM revenue totaled $3.9T in July 2021 but has surged to $4.4B in the latest period.
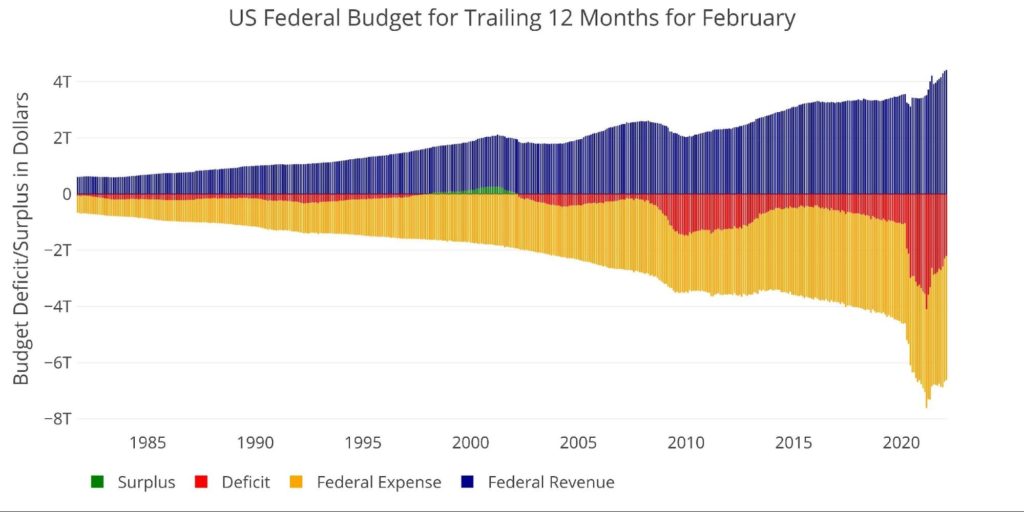
Figure: 7 Trailing 12 Months (TTM)
The next two charts zoom in on the recent periods to show the change when compared to pre-Covid. Once again, the surge in Individual and Corporate Taxes has become very clear. The last twelve months have seen Corporate Revenues reach $400B. In 2016, before the Trump tax cuts, Corporate taxes were only $330B.
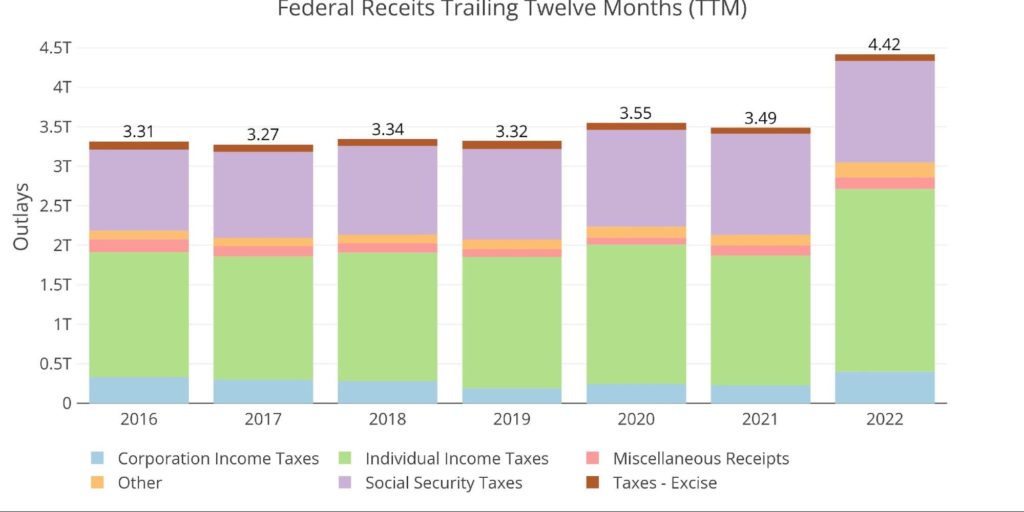
Figure: 8 Annual Federal Receipts
With no more stimulus checks and the SBA closing the PPP Loan offering, 2022 should fall back down some. It will most likely not reach pre-pandemic levels, but it should get below $6T. There are many factors at play, but for now, the Treasury looks to be in better shape than it has been for some time.
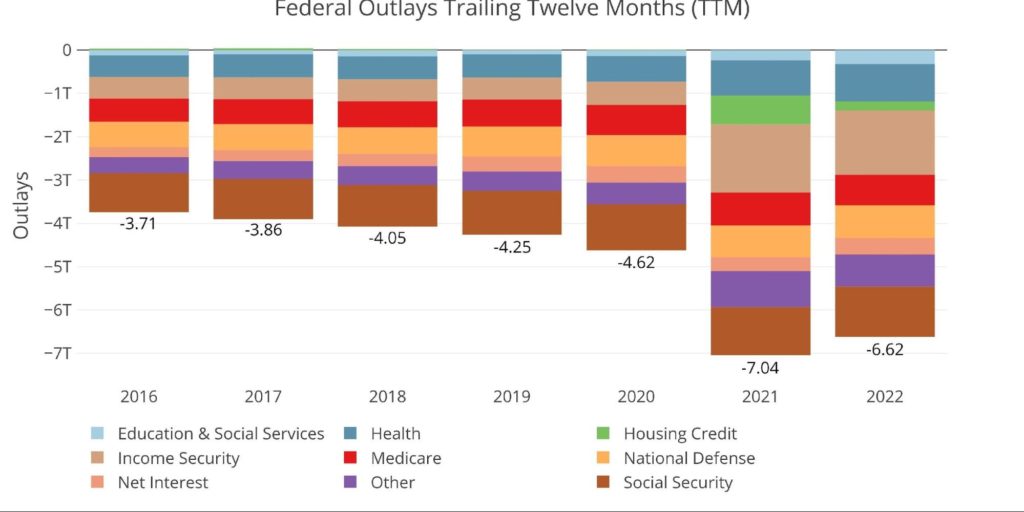
Figure: 9 Annual Federal Expenses
With surging tax revenues and spending set to fall compared to the last two years, the deficit will shrink. Before Covid, the TTM deficit compared to GDP had been trending towards 5% before exploding to 18.6%. It has since come down to 9.2%.
Note: GDP Axis is set to log scale
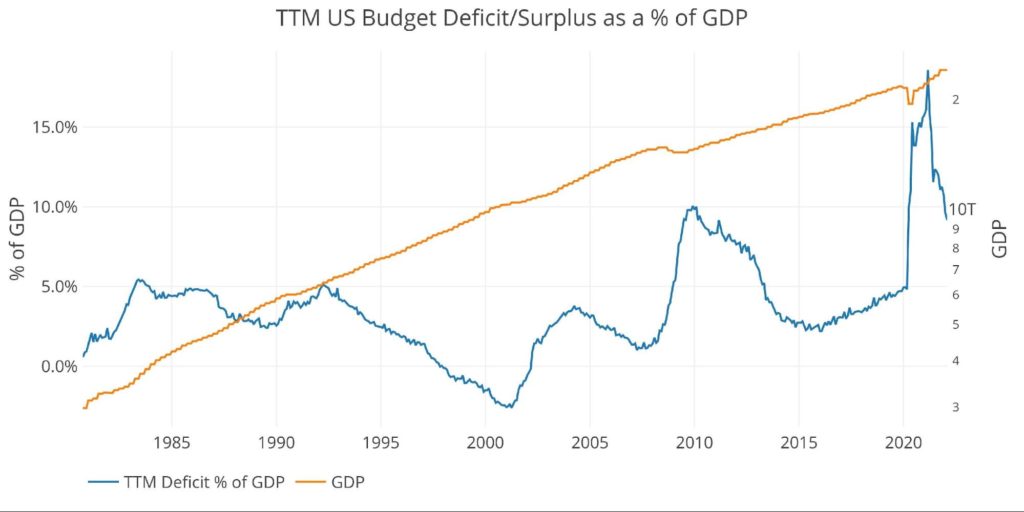
Figure: 10 TTM vs GDP
Finally, to compare the calendar year with previous calendar years, the plot below shows the YTD figures which only include January and February. Through two months, the Treasury has realized the smallest deficit since 2007.
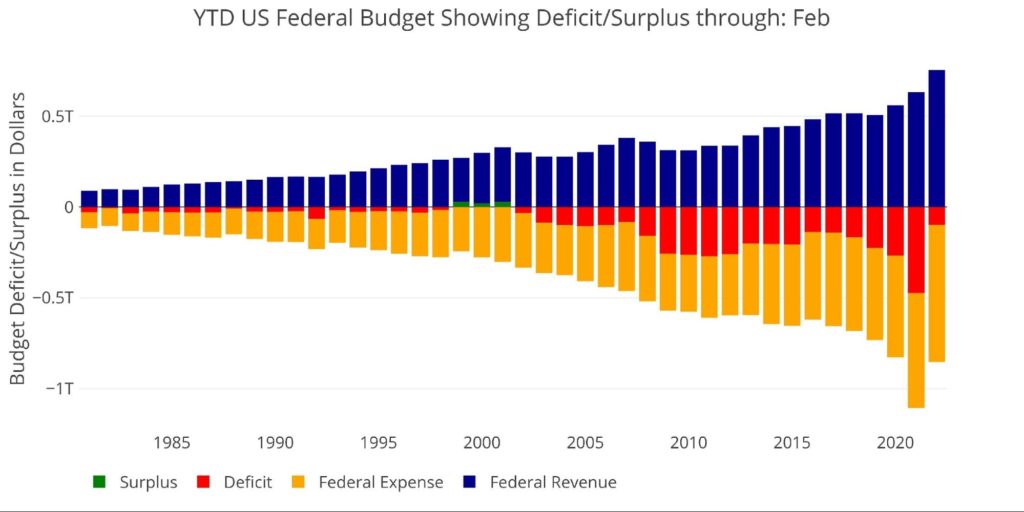
Figure: 11 Year to Date
What it means for Gold and Silver
How will the deficit unfold over 2022? Tax revenues have been surging and spending has been restrained somewhat by deadlock within the Democratic party. Regardless, it’s unlikely the Federal government will start producing surpluses. Looking at the debt shows the Treasury has already passed the point of no return. They are adding to short-term debt and are highly susceptible to higher rates.
Despite the surge in revenues, deficits will continue for the foreseeable future. As the Fed plans to increase rates, interest on the debt will begin to weigh heavily on the deficit. This could create the dreaded downward debt spiral that makes the deficit explode once more. Gold and silver will hold their value regardless of how things unfold in the years ahead.
Data Source: Monthly Treasury Statement
Data Updated: Monthly on eighth business day
Last Updated: Period ending Feb 2022
US Debt interactive charts and graphs can always be found on the Exploring Finance dashboard: https://exploringfinance.shinyapps.io/USDebt/

Call 1-888-GOLD-160 and speak with a Precious Metals Specialist today!
Buka akaun dagangan patuh syariah anda di Weltrade.
Source link