Please note: the CoTs report was published 06/02/2023 for the period ending 05/30/2023. “Managed Money” and “Hedge Funds” are used interchangeably.
Gold
Current Trends
Managed money has once again bailed on gold, which drove the price back below $2000 an ounce despite the “Other” group stepping in to absorb some of the selling.
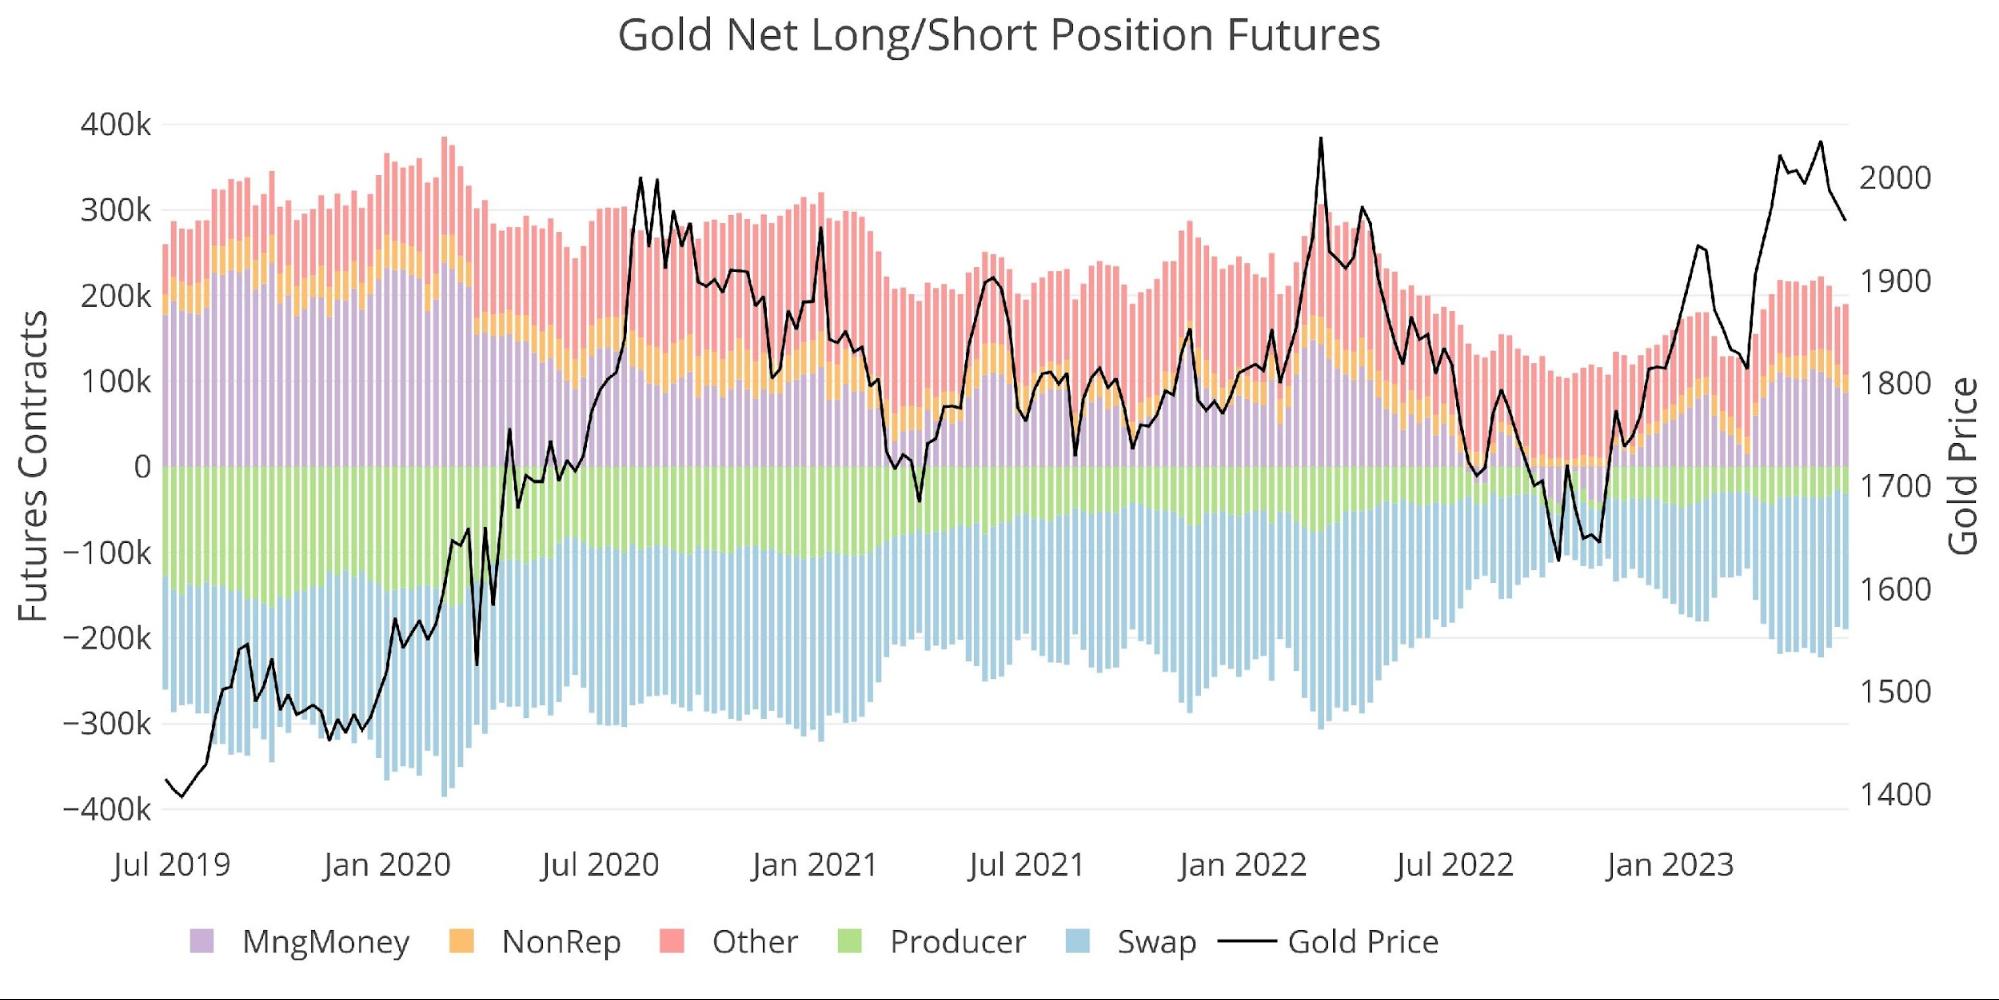
Figure: 1 Net Position by Holder
As the chart below shows, Managed Money net long positioning dropped back below 100k contracts, which resulted in the recent price drop. Managed Money was never responsible for the entire move up, as can be seen with the last spike above $2000 an ounce where Managed Money net longs topped out at 148k contracts. Had Managed Money gotten that high in this latest advance, the gold price would have hit new all-time highs.
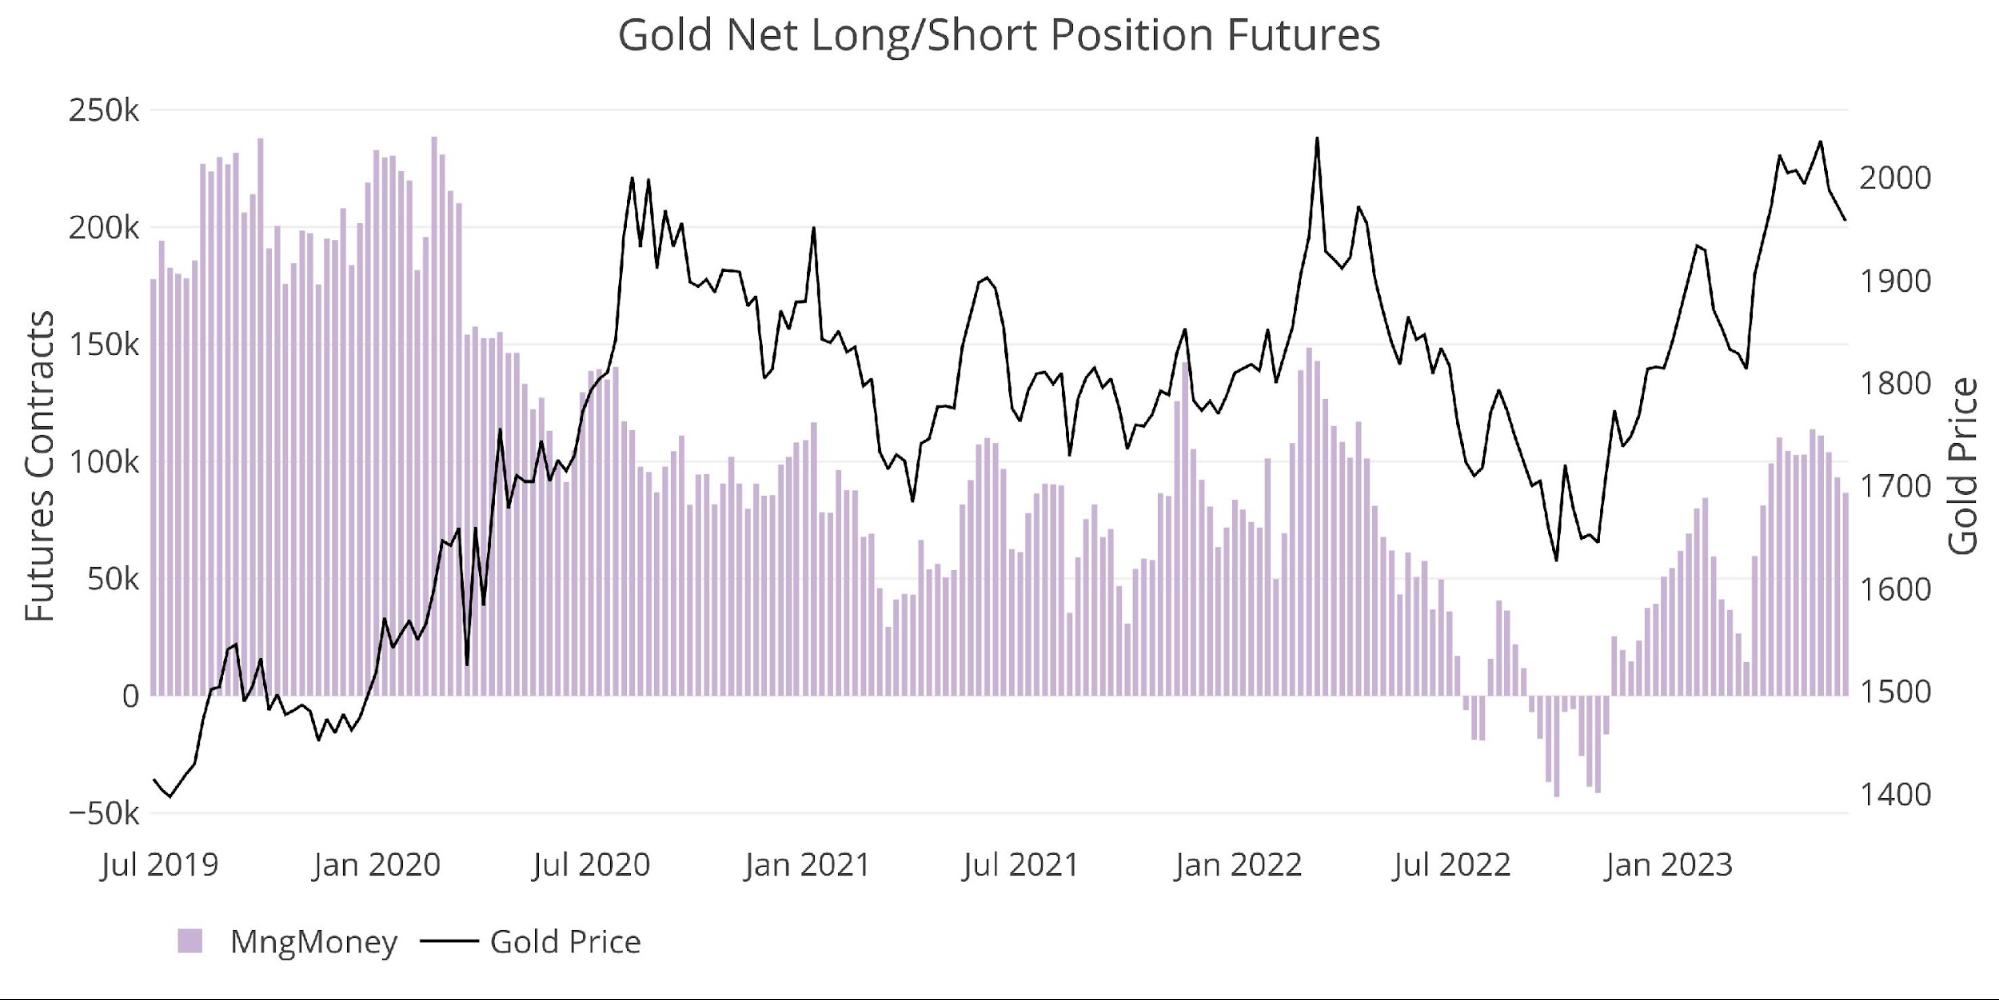
Figure: 2 Managed Money Net Position
Weekly Activity
The weekly activity below shows that Managed Money has been net sellers for four straight weeks. “Other” had bailed the previous two weeks by almost 17k contracts but bought back almost all of it in the latest week with a net increase of 15k.
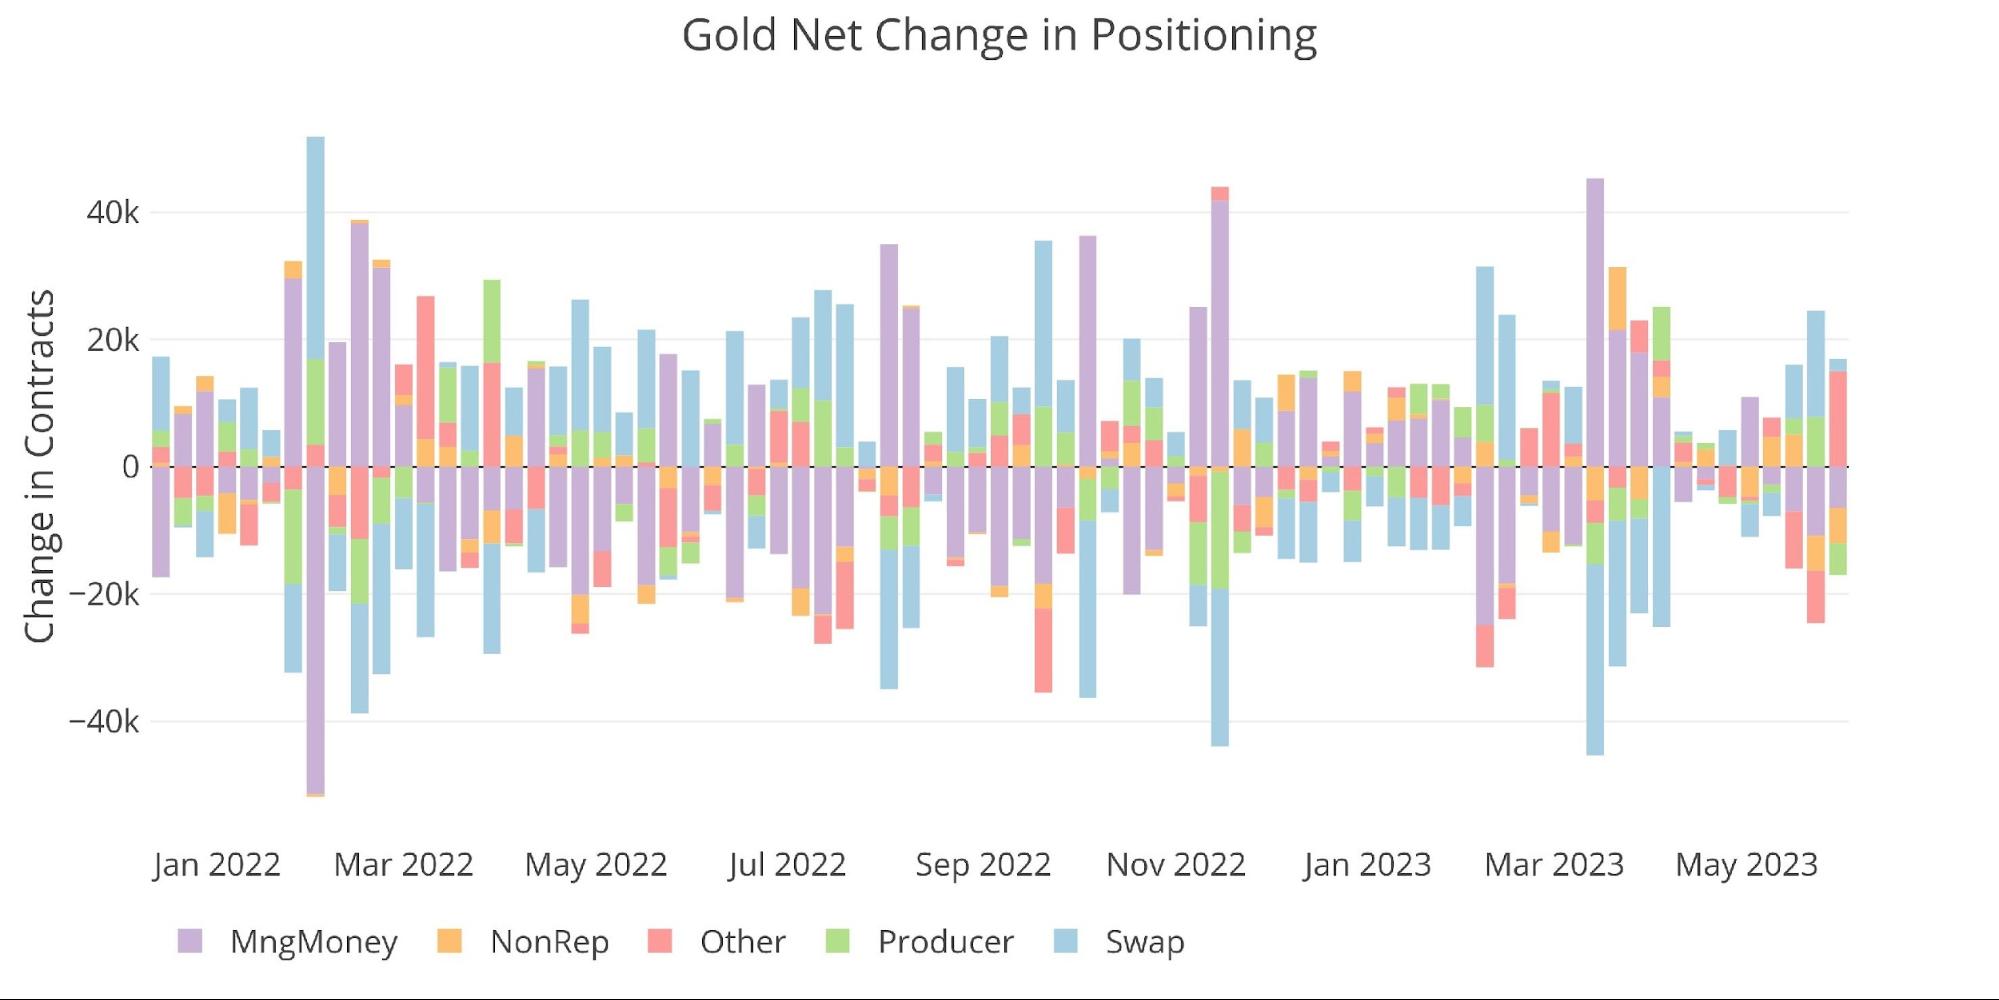
Figure: 3
The table below has detailed positioning information. A few things to highlight:
-
- Gross Longs and Shorts were down across the board, with only Managed Money gross shorts increasing
-
- The drop in Managed Money net positioning was driven by Longs dropping 13k and Shorts increasing by 3k
-
- Net positioning across all parties also fell except for the slightest increase in Other
-
- The week-over-week activity highlights what was mentioned above, that Other took a round-trip during the month
-
- Gross Longs and Shorts were down across the board, with only Managed Money gross shorts increasing
Over the last year, only Managed Money has meaningfully increased its net positioning (+70%). All other parties have seen reductions of around 25%+. Swap was relatively flat over the year.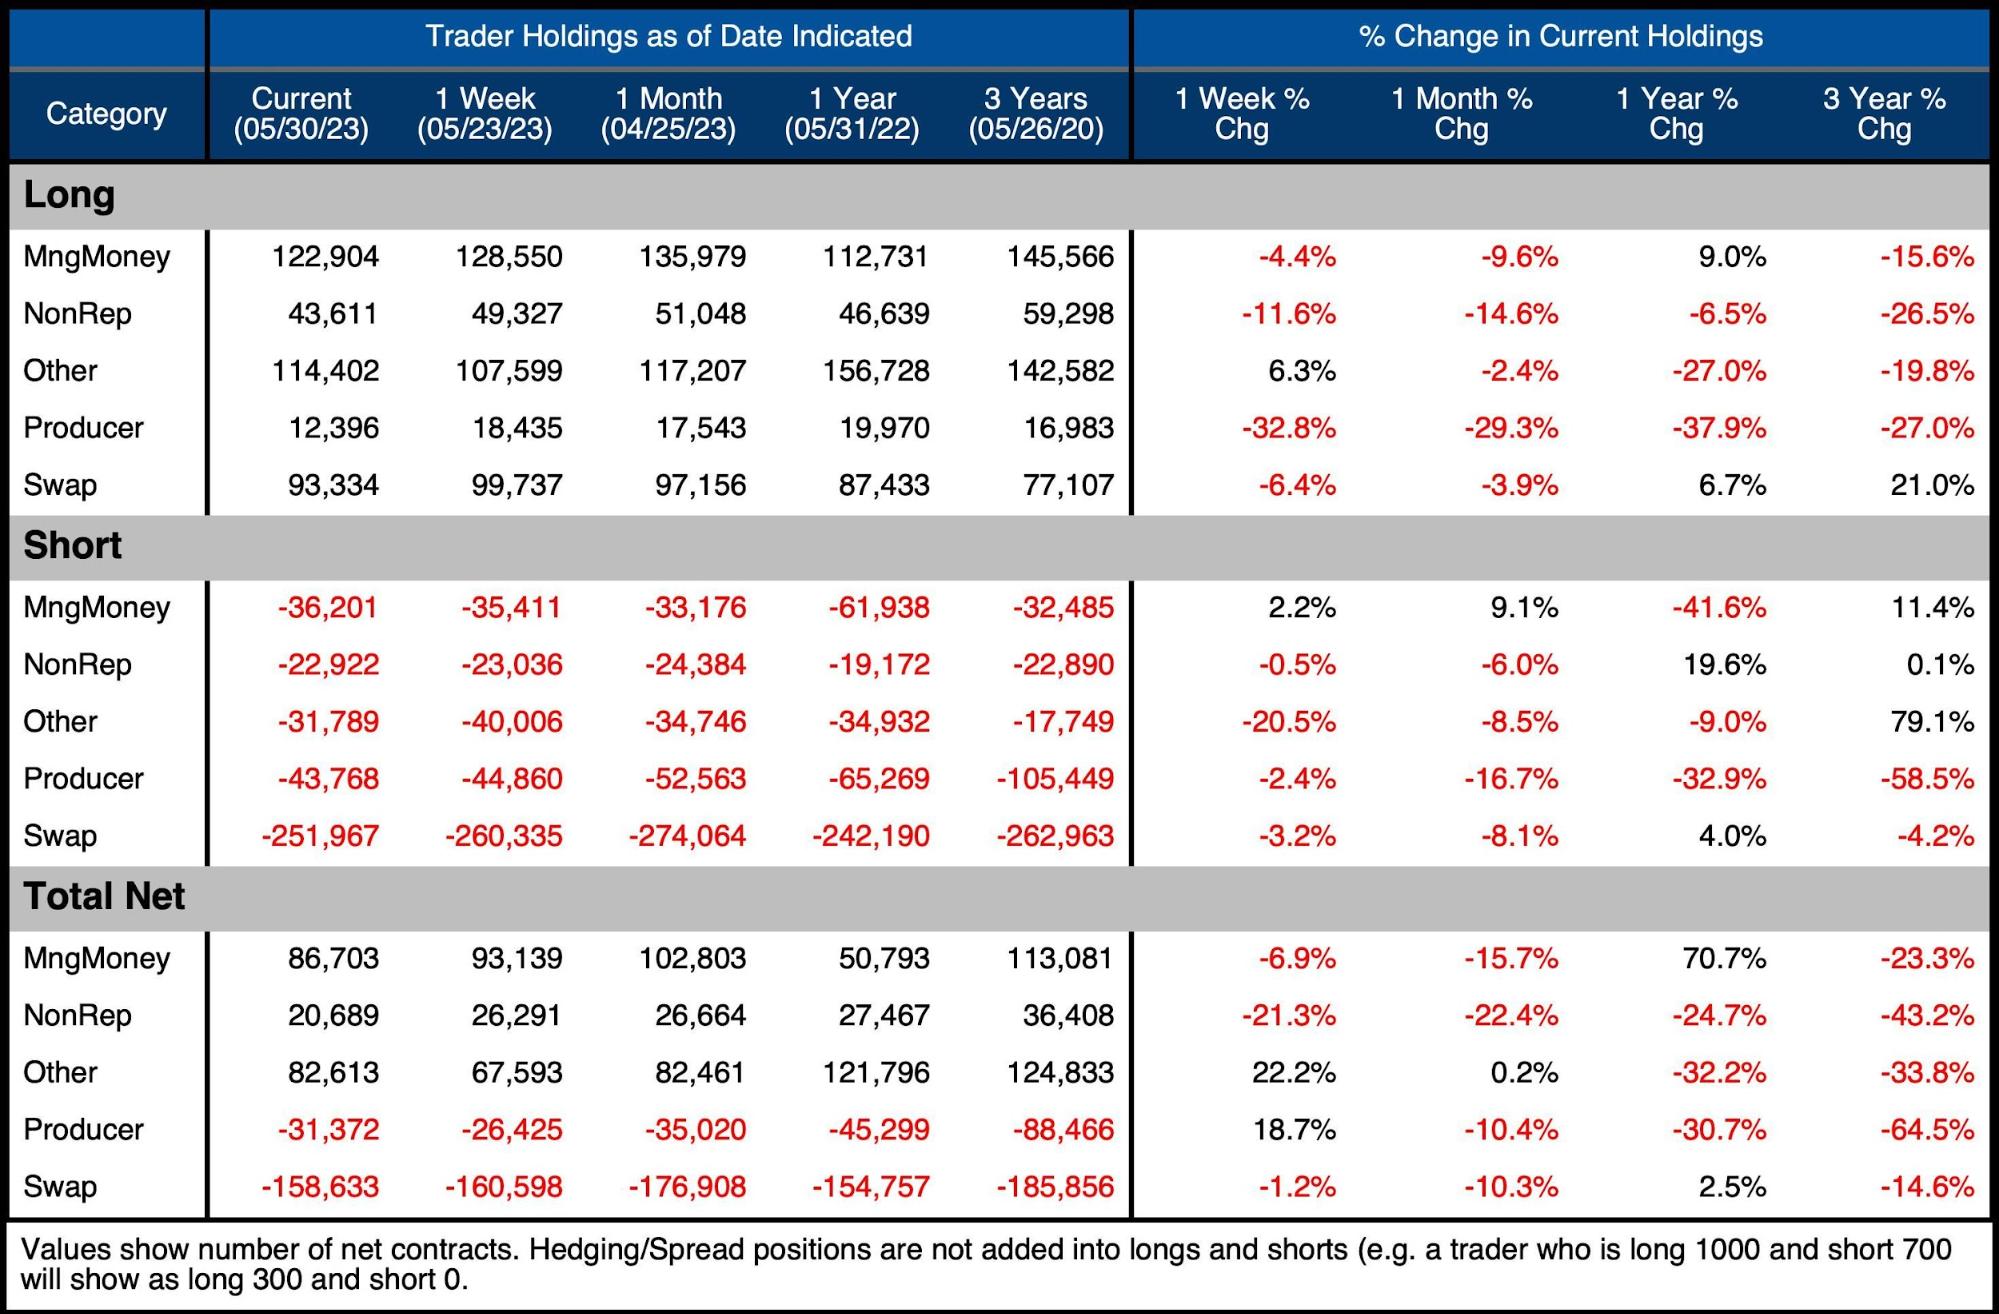
Figure: 4 Gold Summary Table
The latest activity caused a drop in aggregate net positioning down to 42.3%. The low for the year was 25% back in March right before SVB, suggesting the market was very close to neutral. This compares to the peak in April 2020 of nearly 60%, which means an unbalanced market.
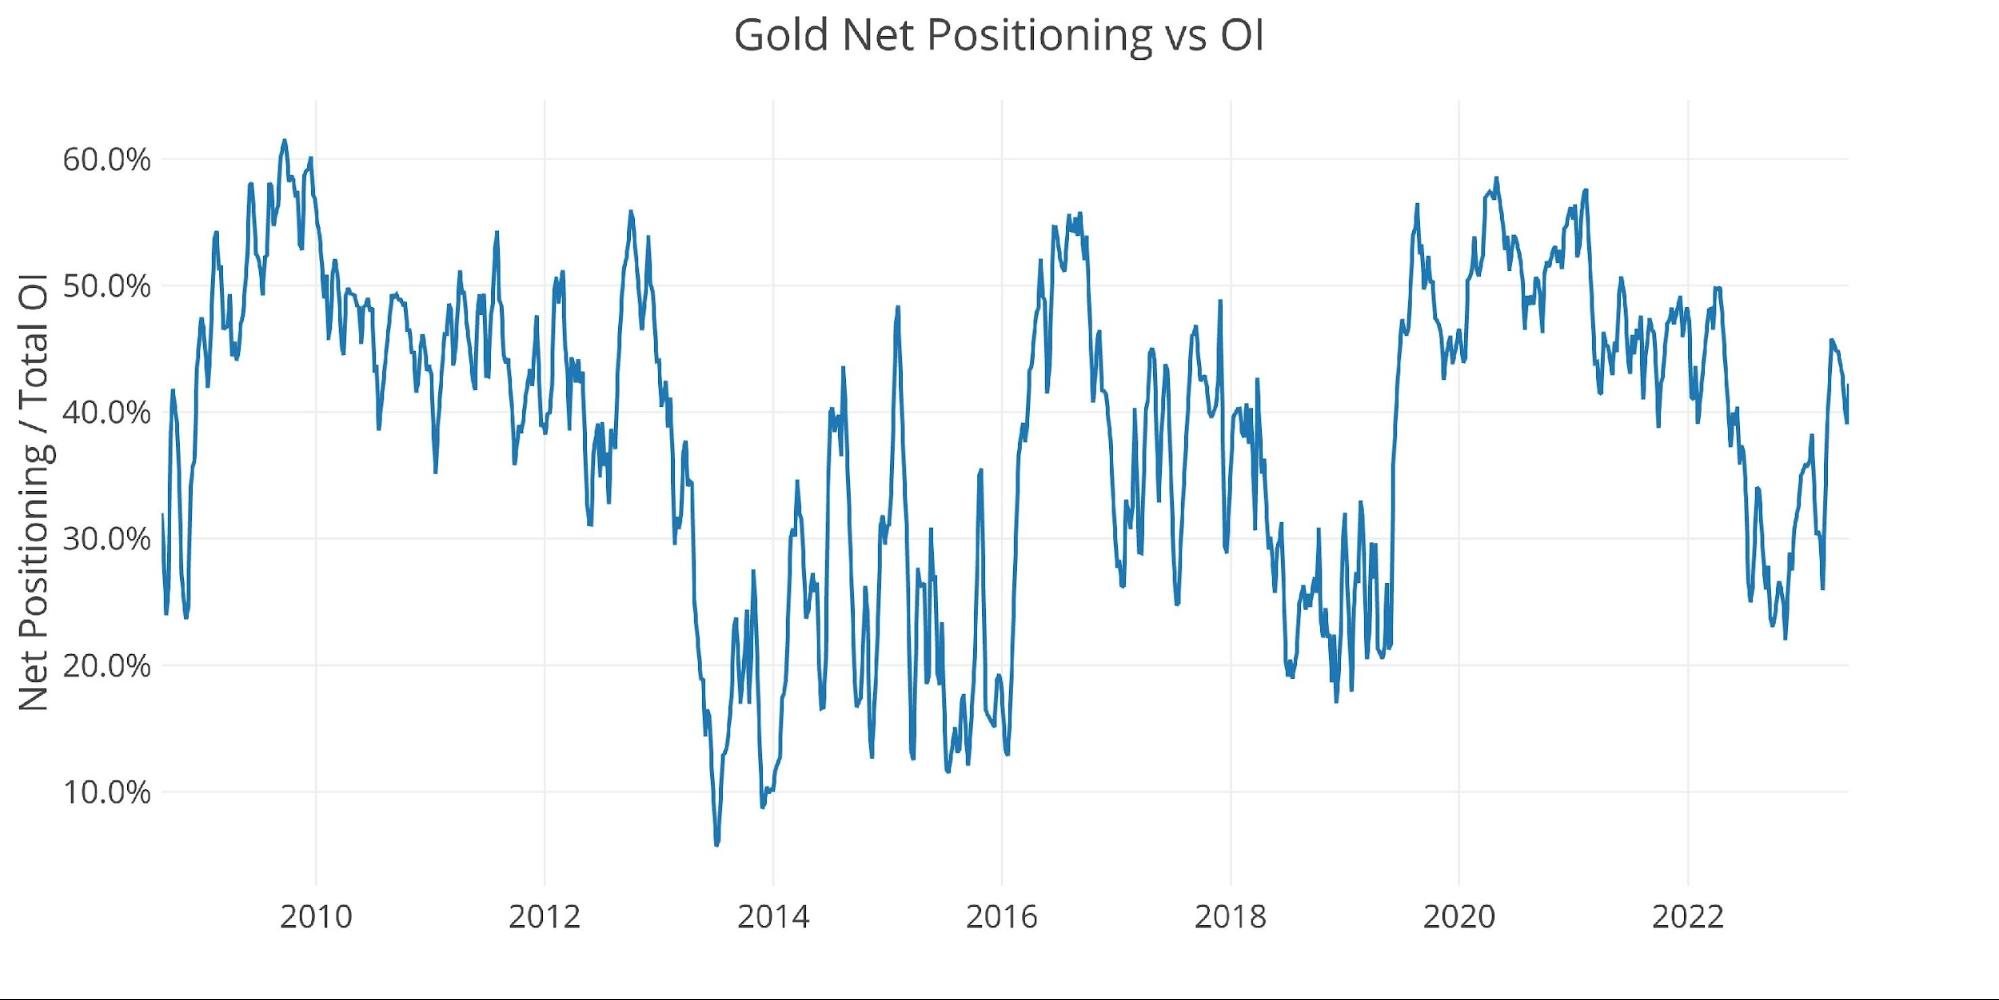
Figure: 5 Net Positioning
Historical Perspective
Looking over the full history of the CoTs data by month produces the chart below (values are in dollar/notional amounts, not contracts). Gross positioning has topped out just shy of $100B twice, in Feb 2020 and Feb 2022, before seeing large corrections. The latest price advance only took gross positioning to $84B. This suggests the recent price spike was not an overbought situation which also helps explain why gold has held up so well in the current correction (staying above $1950).
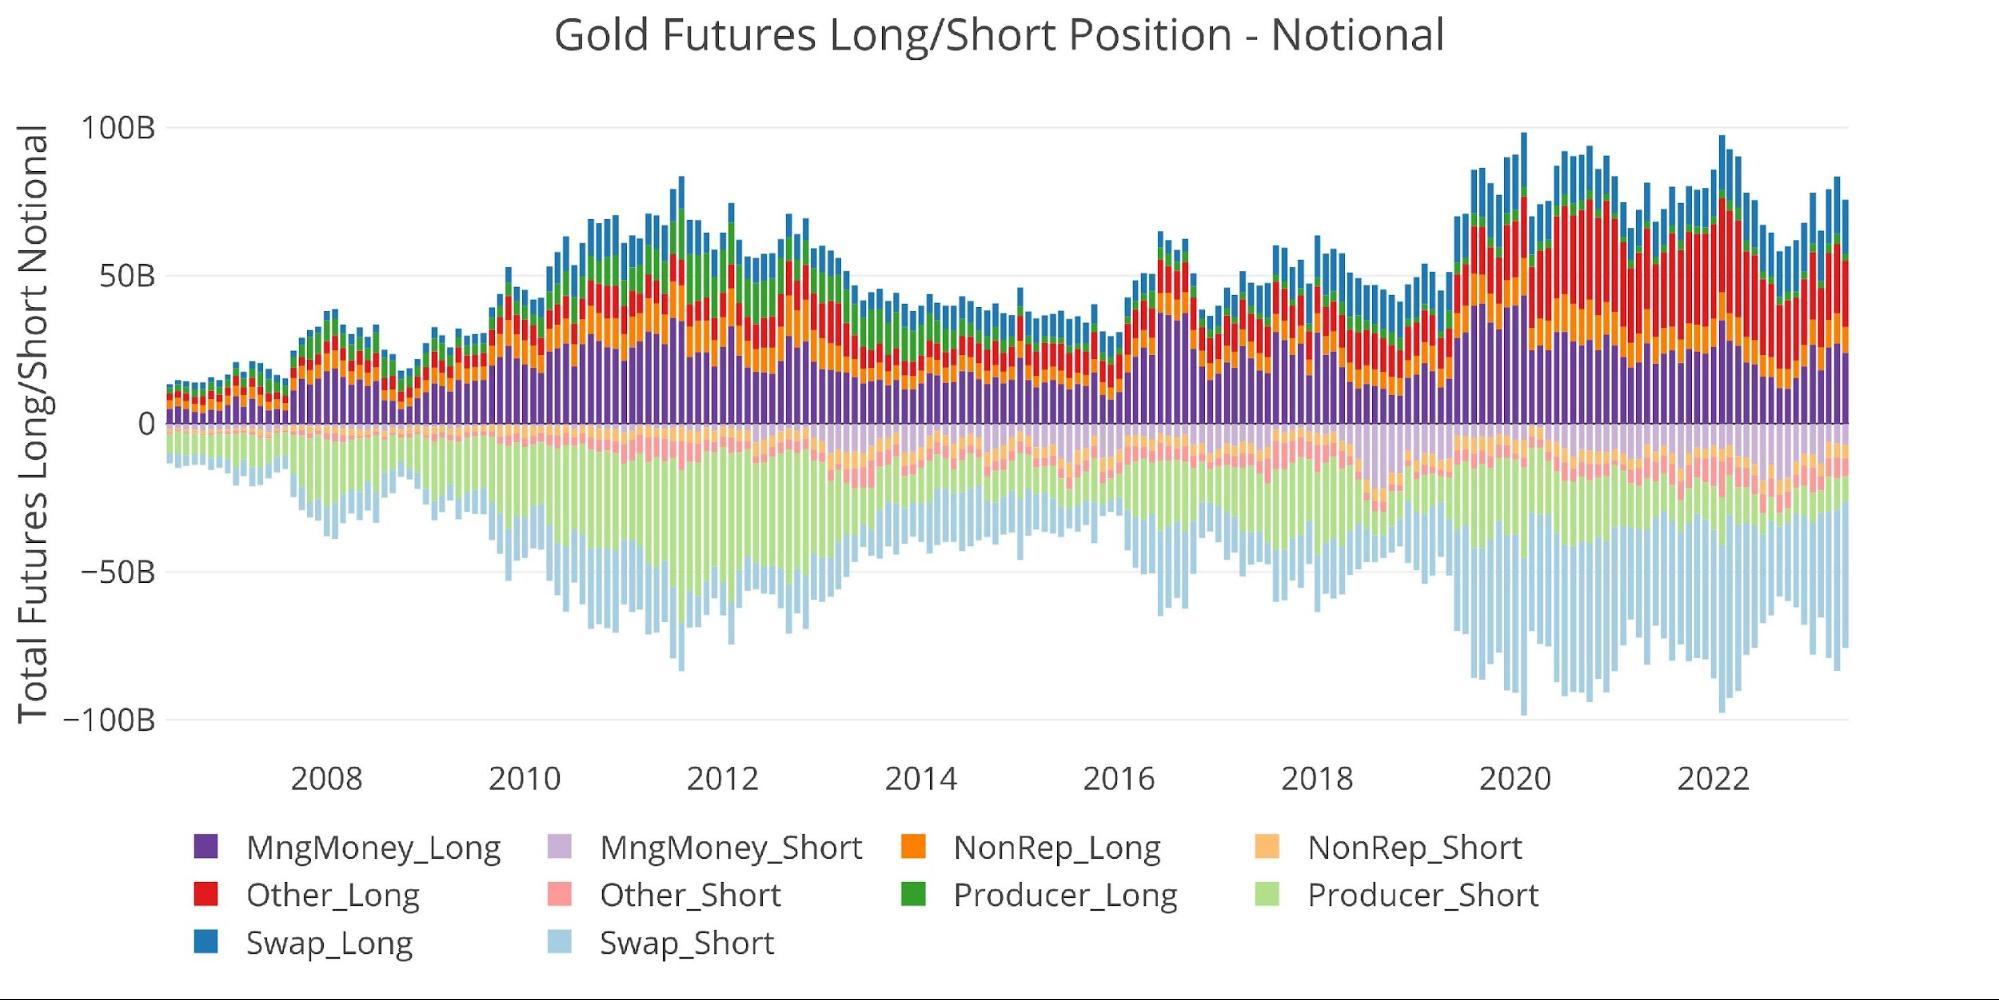
Figure: 6 Gross Open Interest
The net positioning provides more evidence of this fact. It stayed well below the recent price spikes and now sits near the average for the past three years despite the price remaining elevated.
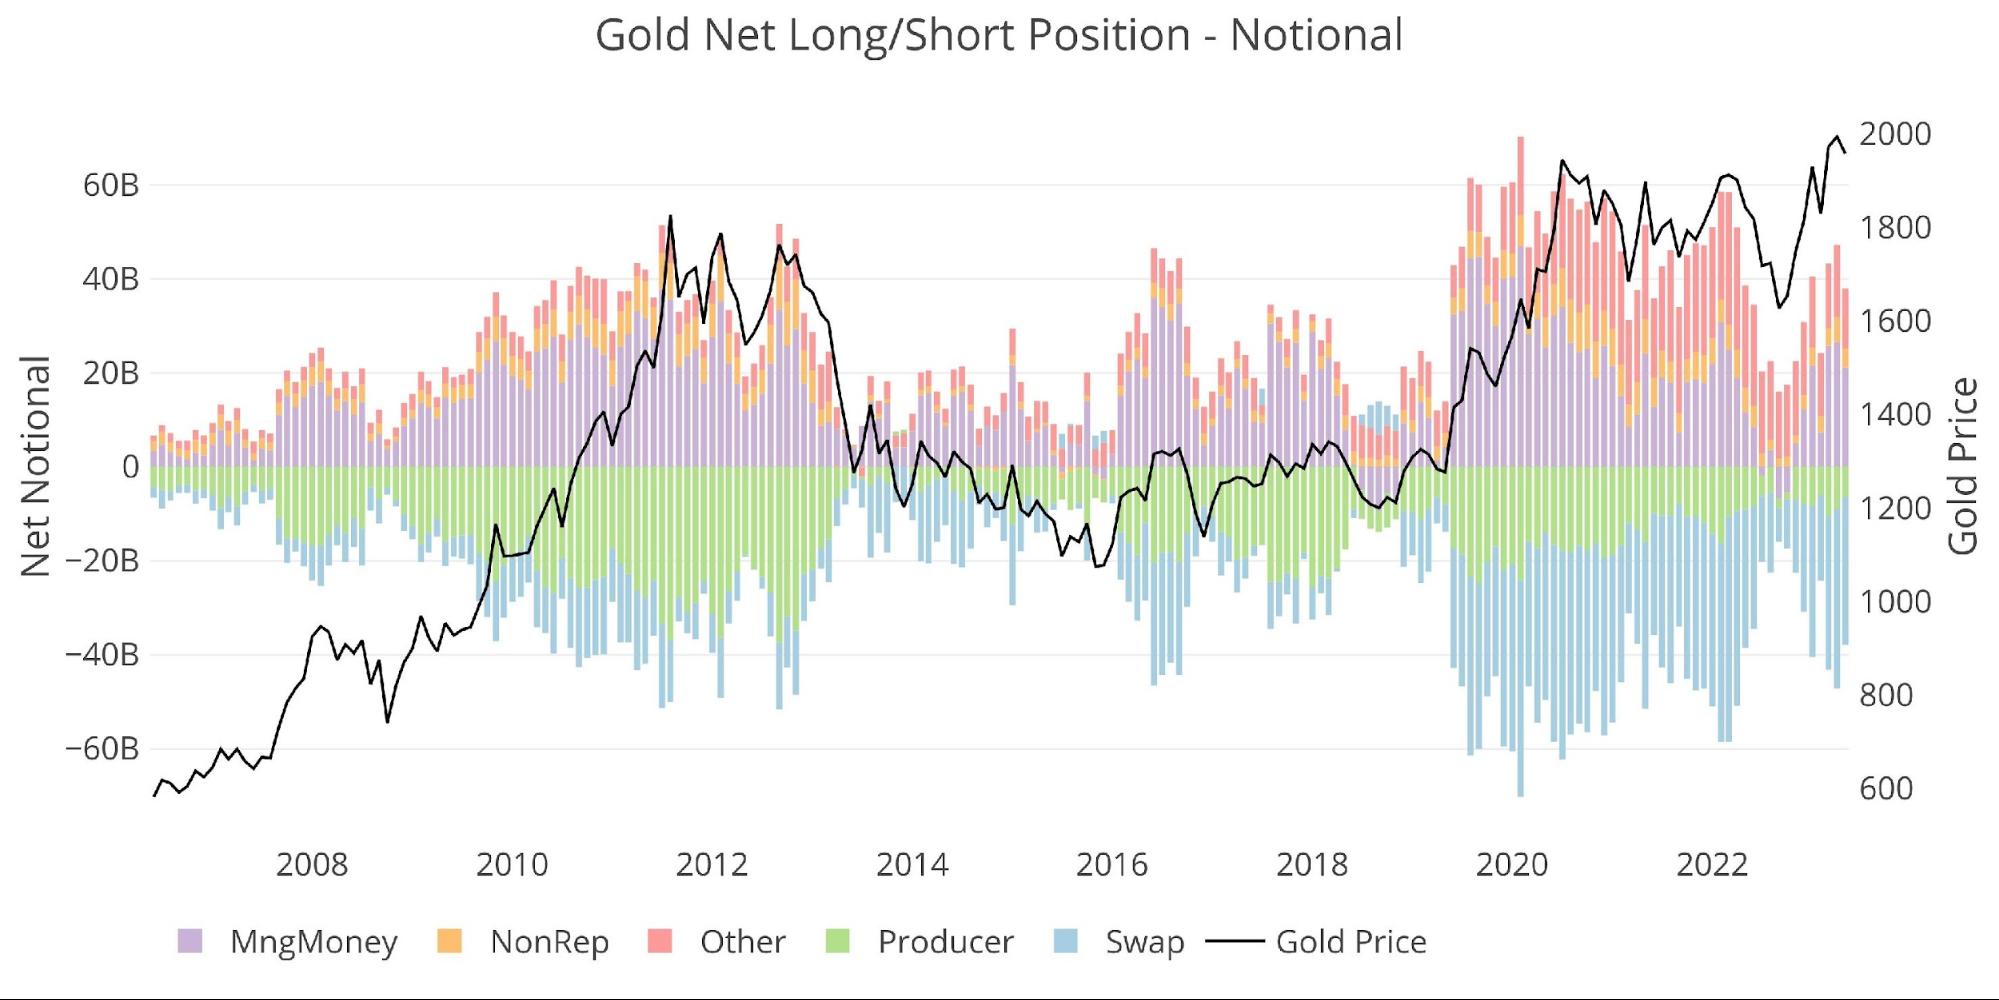
Figure: 7 Net Notional Position
Another sign the market has not gotten too far ahead of itself is the option market. This represents very speculative money. In 2020 the notional amount exceeded $20B and it now sits at less than $8B. Managed Money does remain above its 3-year average, but it still only represents a $3.8B long position.
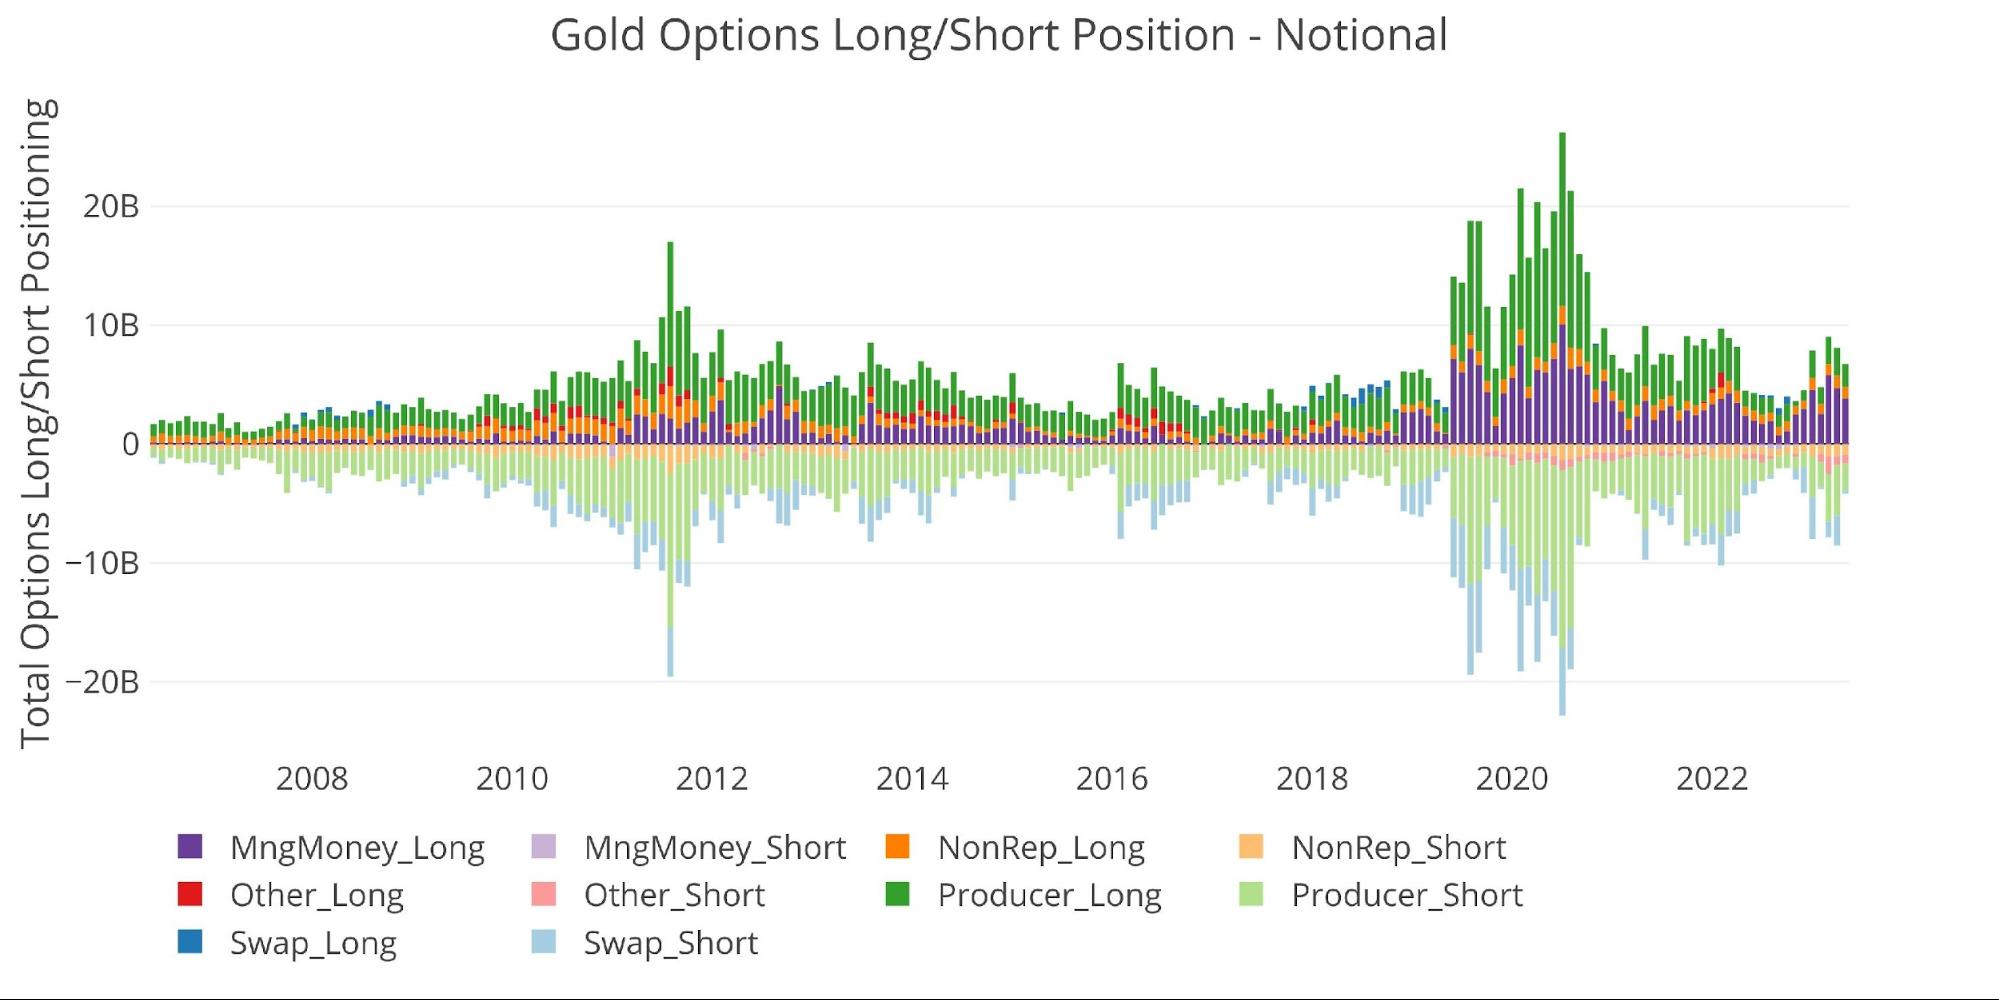
Figure: 8 Options Positions
Silver
Current Trends
Similar to gold, the Managed Money crowd did not get fully behind the latest price advance and has thus also not driven it to new lows on their selling.
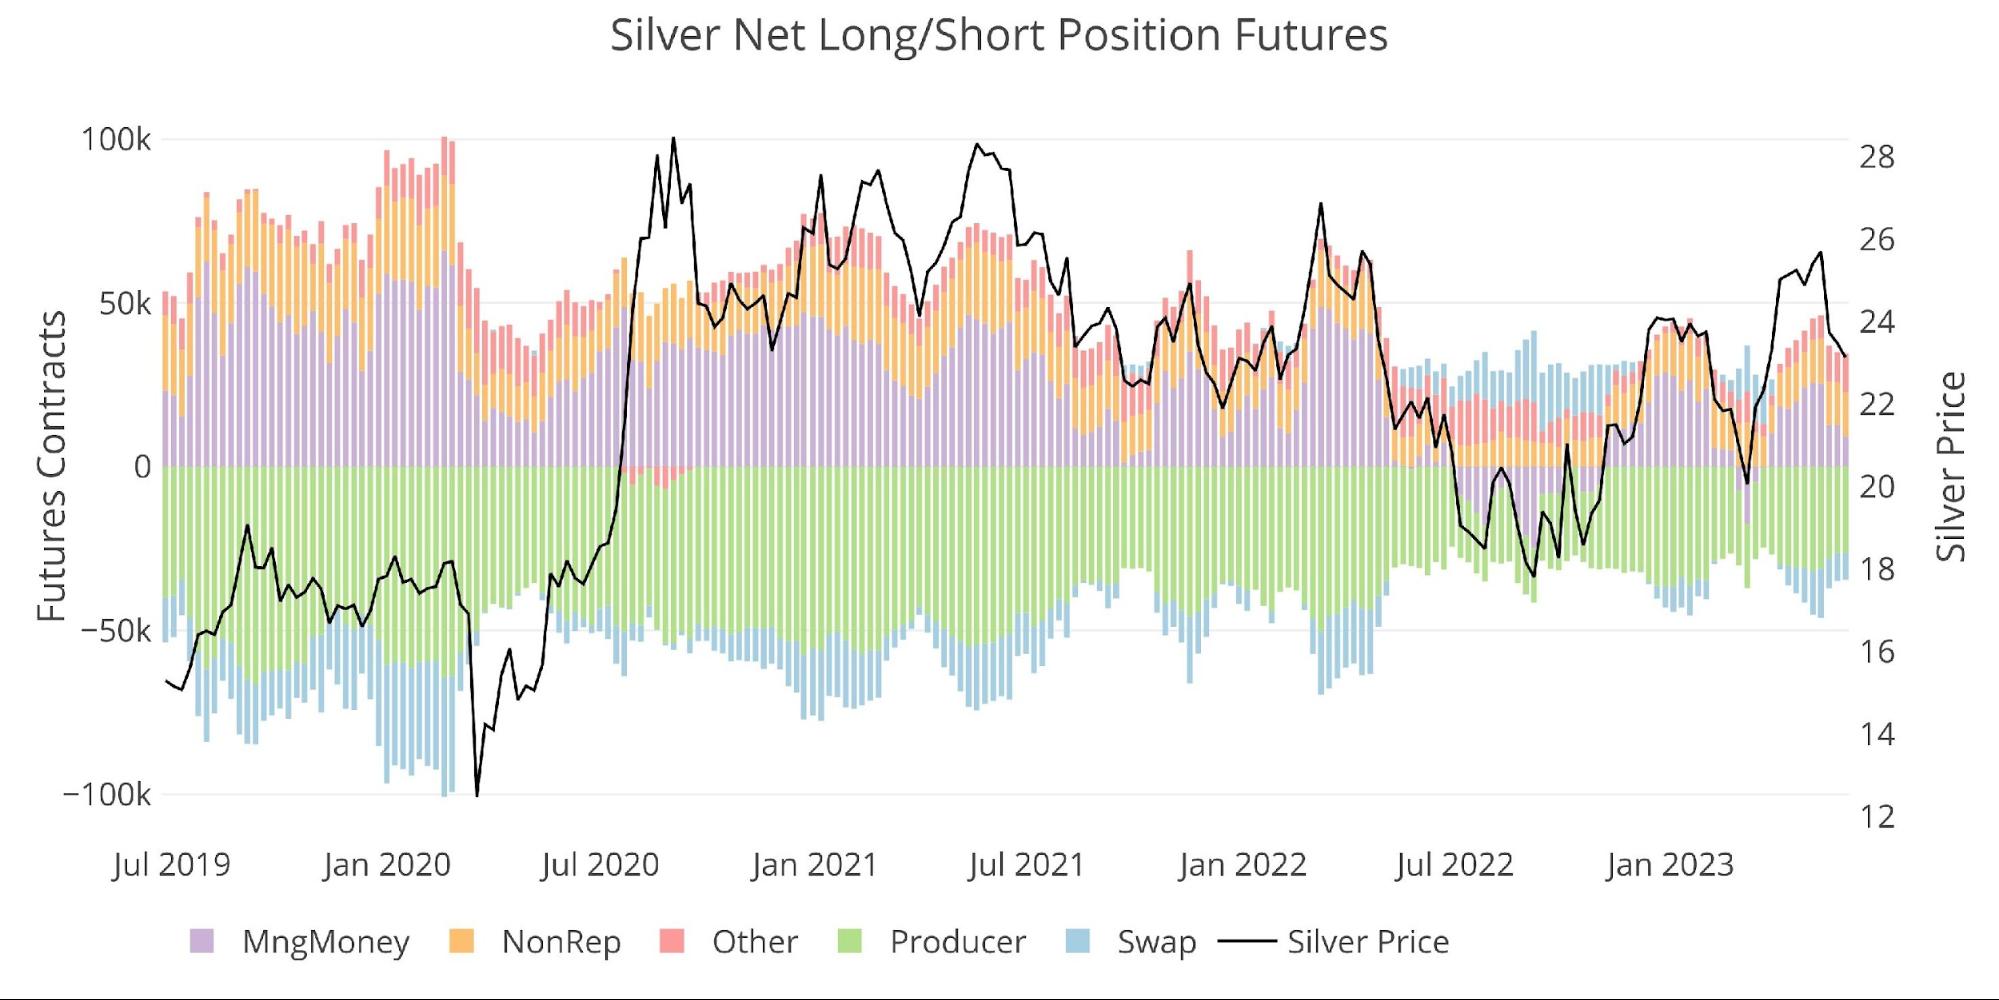
Figure: 9 Net Position by Holder
The chart below really highlights this fact. The price is slightly below where it was in December ($24.04 vs $23.12), yet net positioning is far below where it was at the same time (28.8k vs 9.2k).
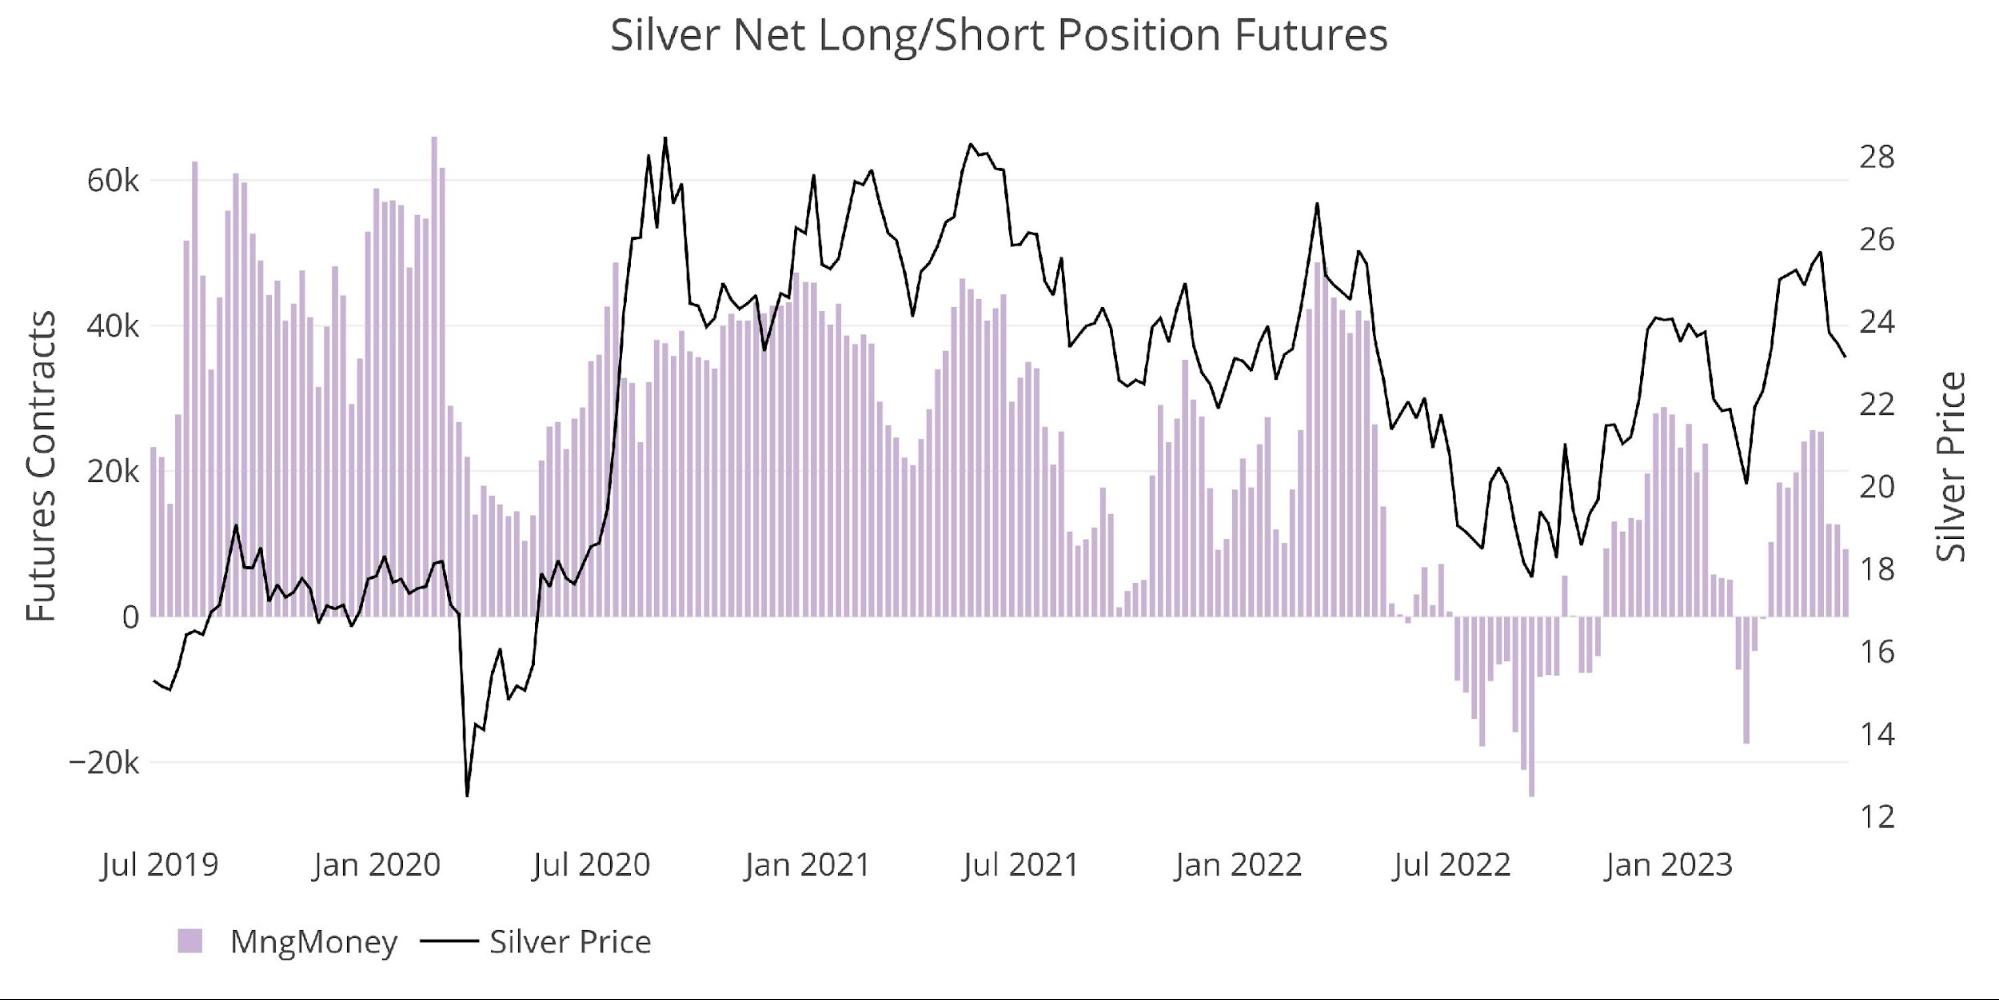
Figure: 10 Managed Money Net Position
Weekly Activity
Managed Money is very volatile week to week in silver. They had a 4-week period of buying following the SVB crisis, but have since been back and forth with swap mainly on the other side. Similar to gold though, “Other” absorbed the selling in the latest week which likely helped support the price. When Swap is on the other side, they are just providing liquidity to selling (hitting at the bid) rather than buying at the ask.
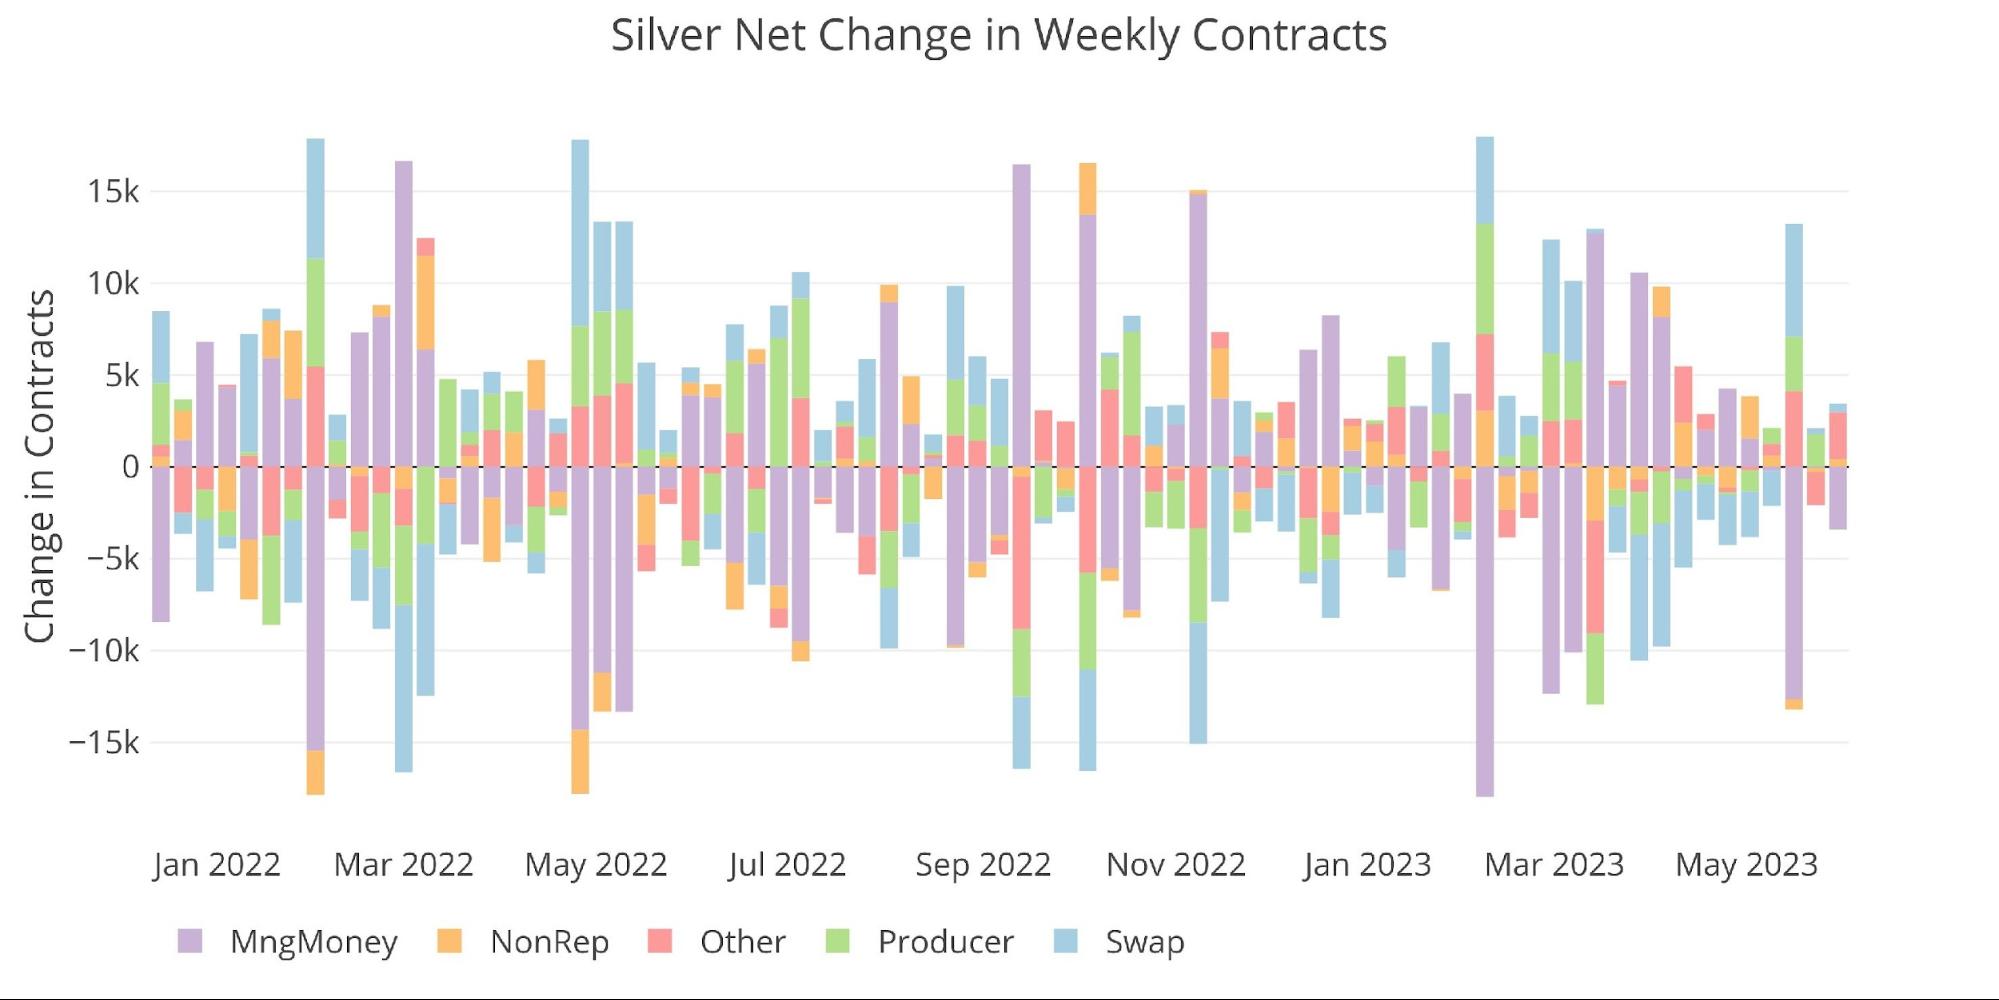
Figure: 11 Net Change in Positioning
The table below shows a series of snapshots in time. This data does NOT include options or hedging positions. Important data points to note:
-
- Managed Money decreased net longs by 62% over the month
-
- This was driven entirely by a long liquidation rather than an increase in shorts which only increased by 600 contracts
-
- Other saw an 82% increase in net long positioning which came from both shorts closing and longs opening
- Over the last year in net positioning, Swaps have seen a big move going from +7k to -8k while Managed Money is up 204% even after the recent liquidation
- Managed Money decreased net longs by 62% over the month
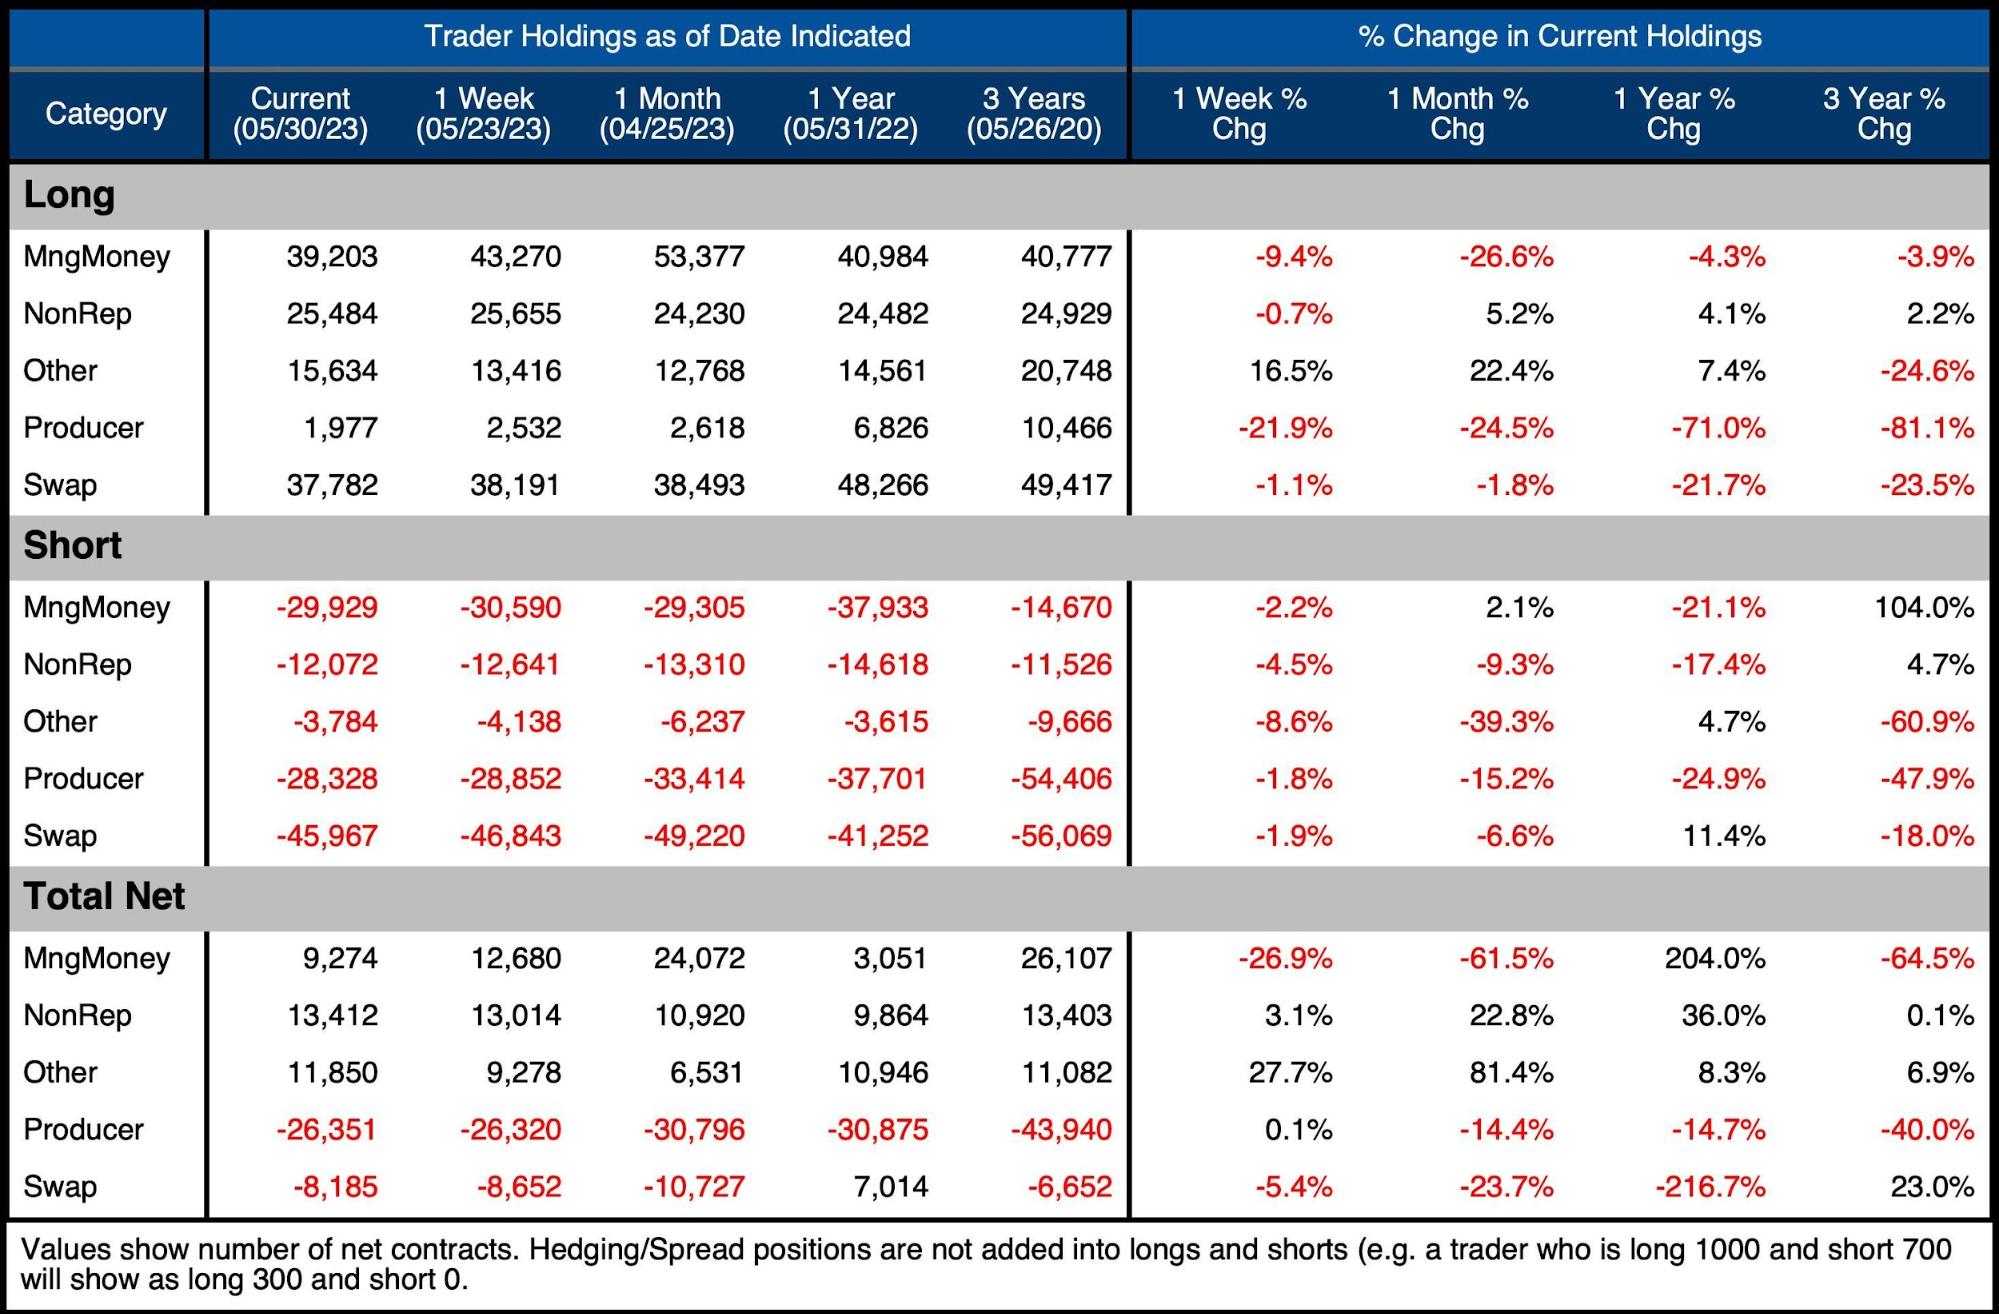
Figure: 12 Silver Summary Table
Similar to gold, net positioning in silver has dropped back down. It is now closer to the lower end of the range over the last several years, finishing at 25% down from the recent high of 32%.
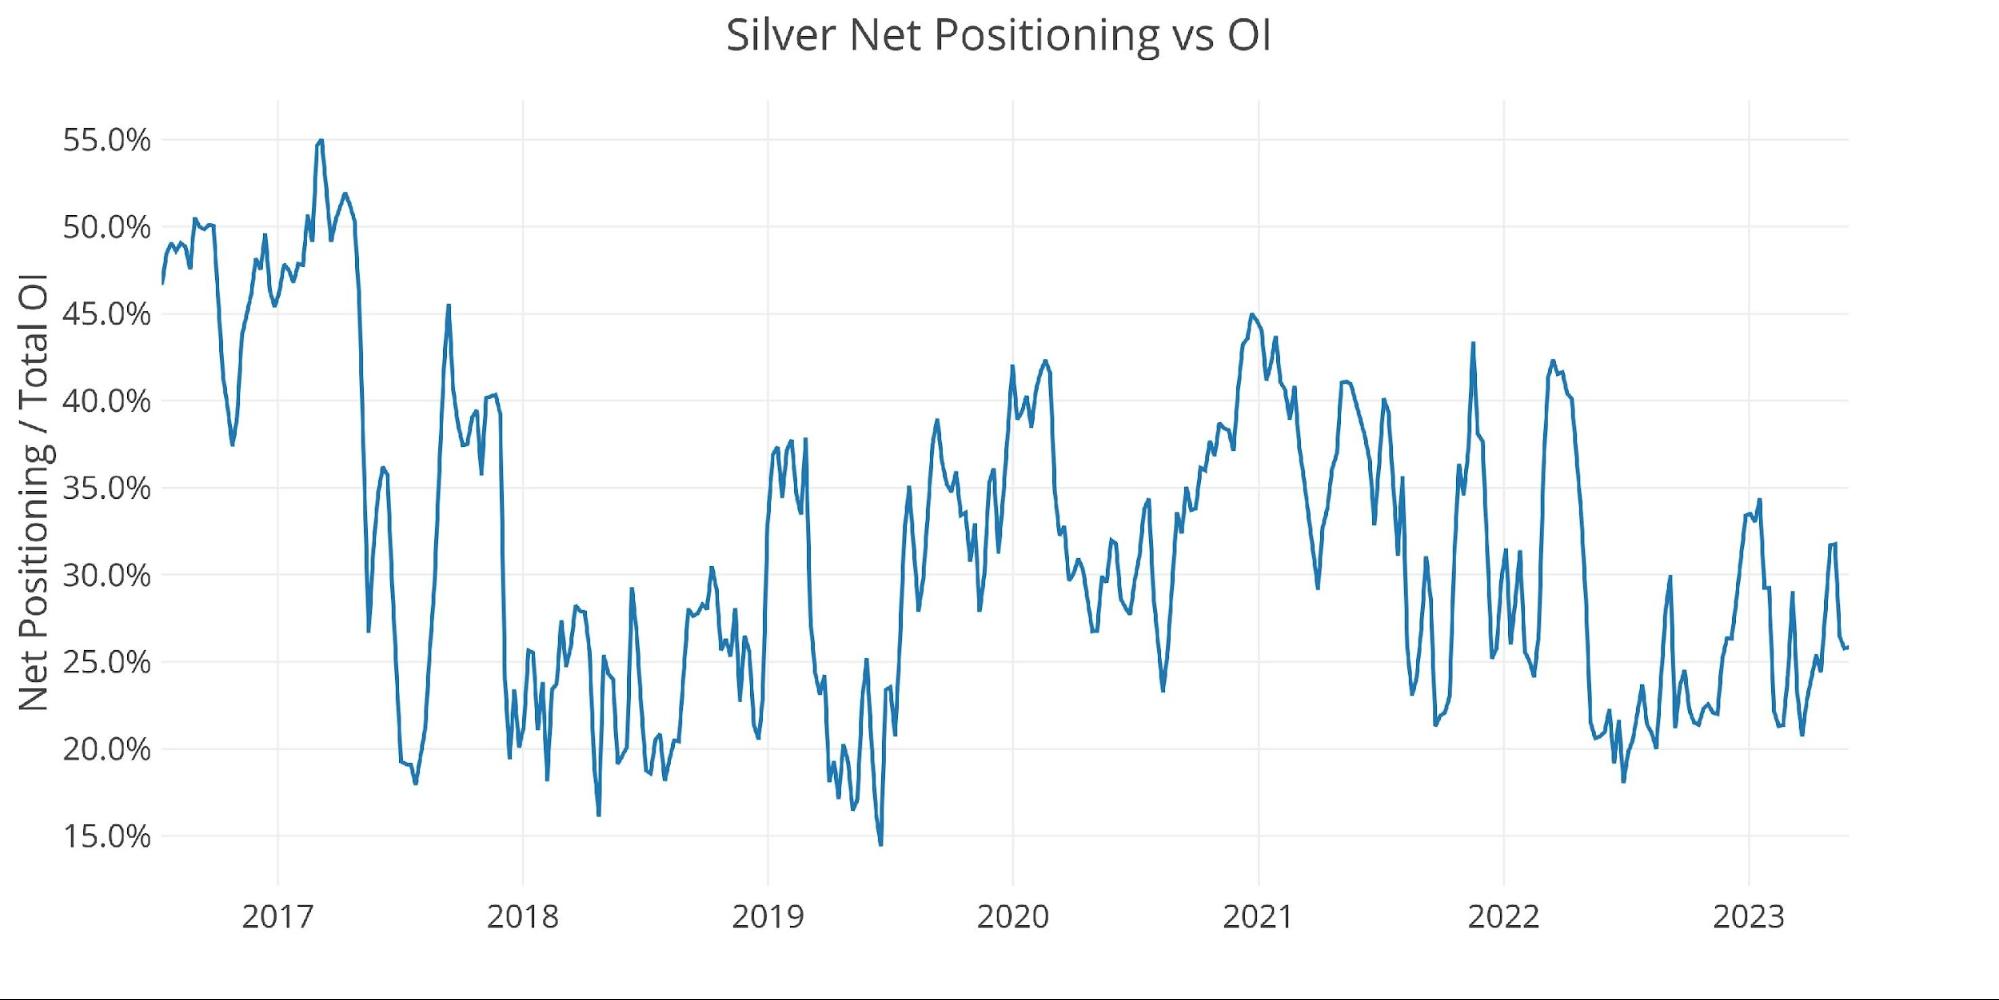
Figure: 13 Net Positioning
Historical Perspective
Looking over the full history of the CoTs data by month produces the chart below. During the run-ups in 2011 and 2020, the gross notional value exceeded $20B. The recent price spike never came close to that level and has only retreated marginally from the highs. This suggests room for the futures market to drive the next rally higher.
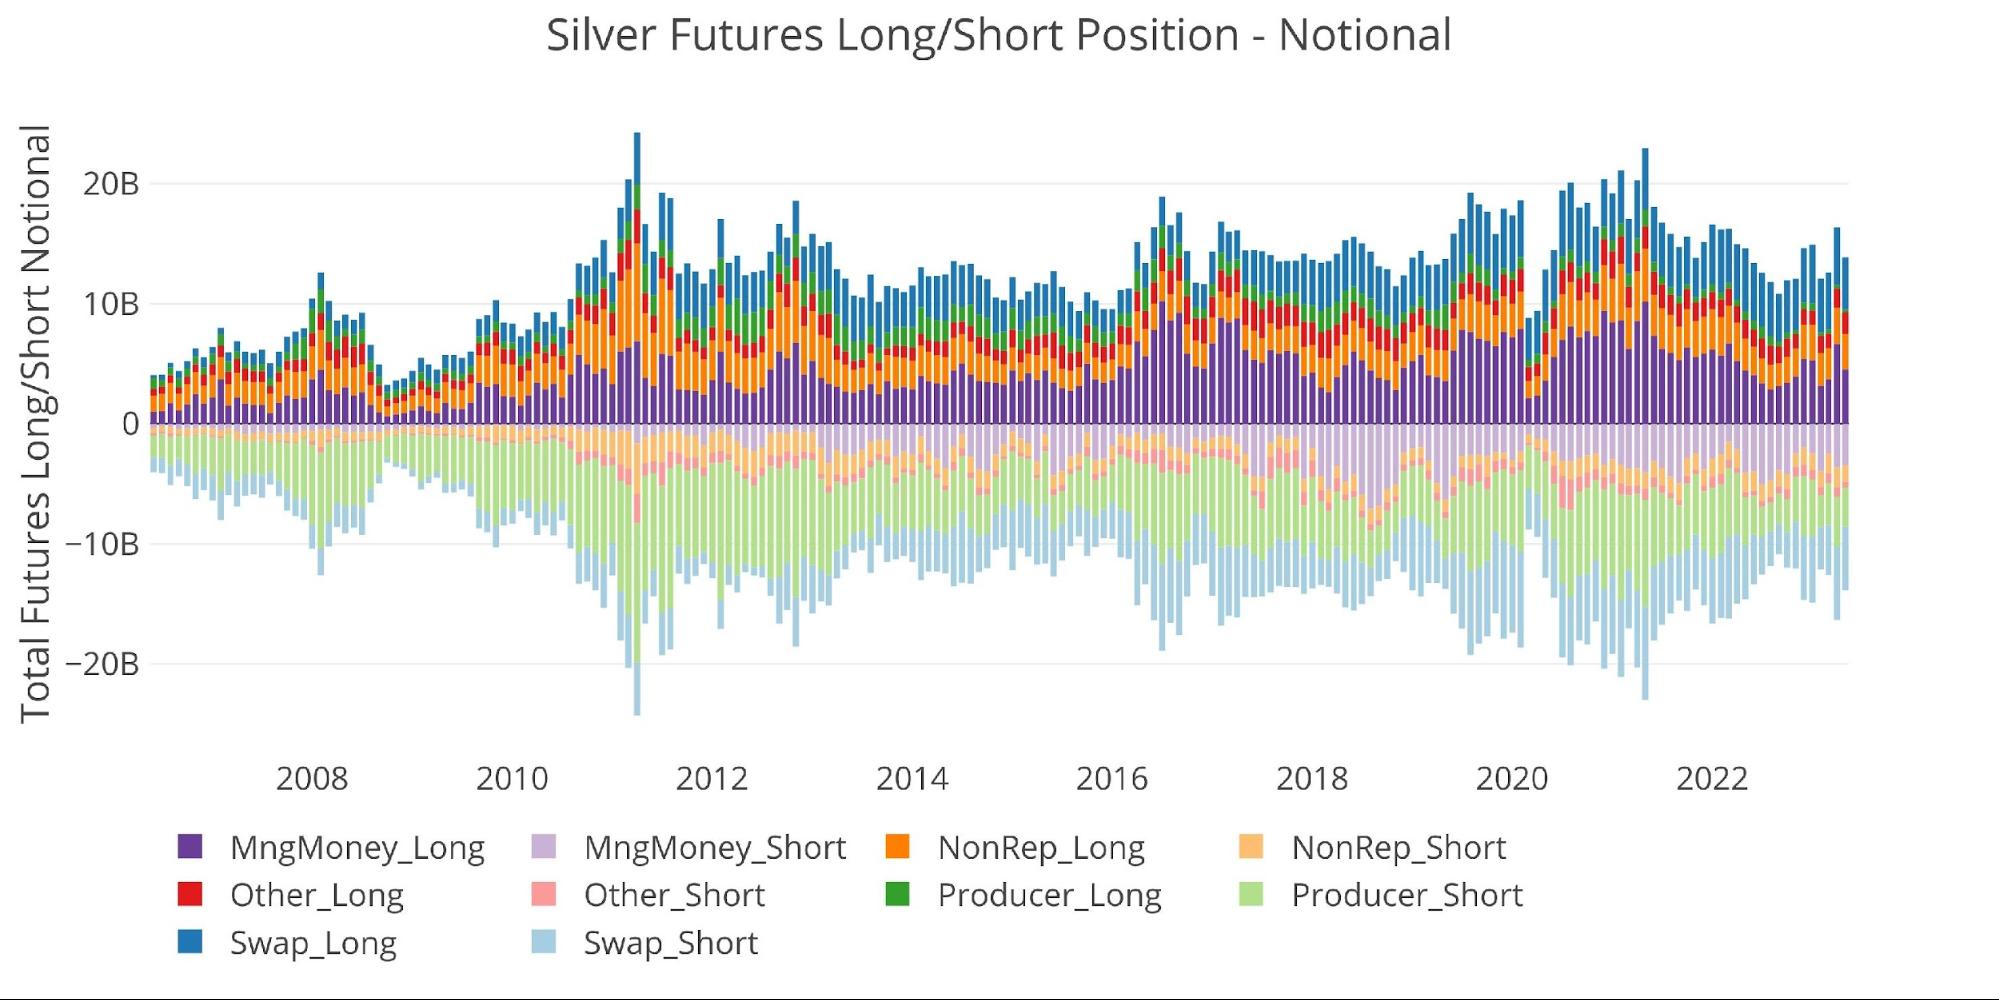
Figure: 14 Gross Open Interest
Managed Money is currently net long by $1.2B. The overall drop in net positioning is very clear from the chart below, hovering around $3B which is near the lows from the past several years.
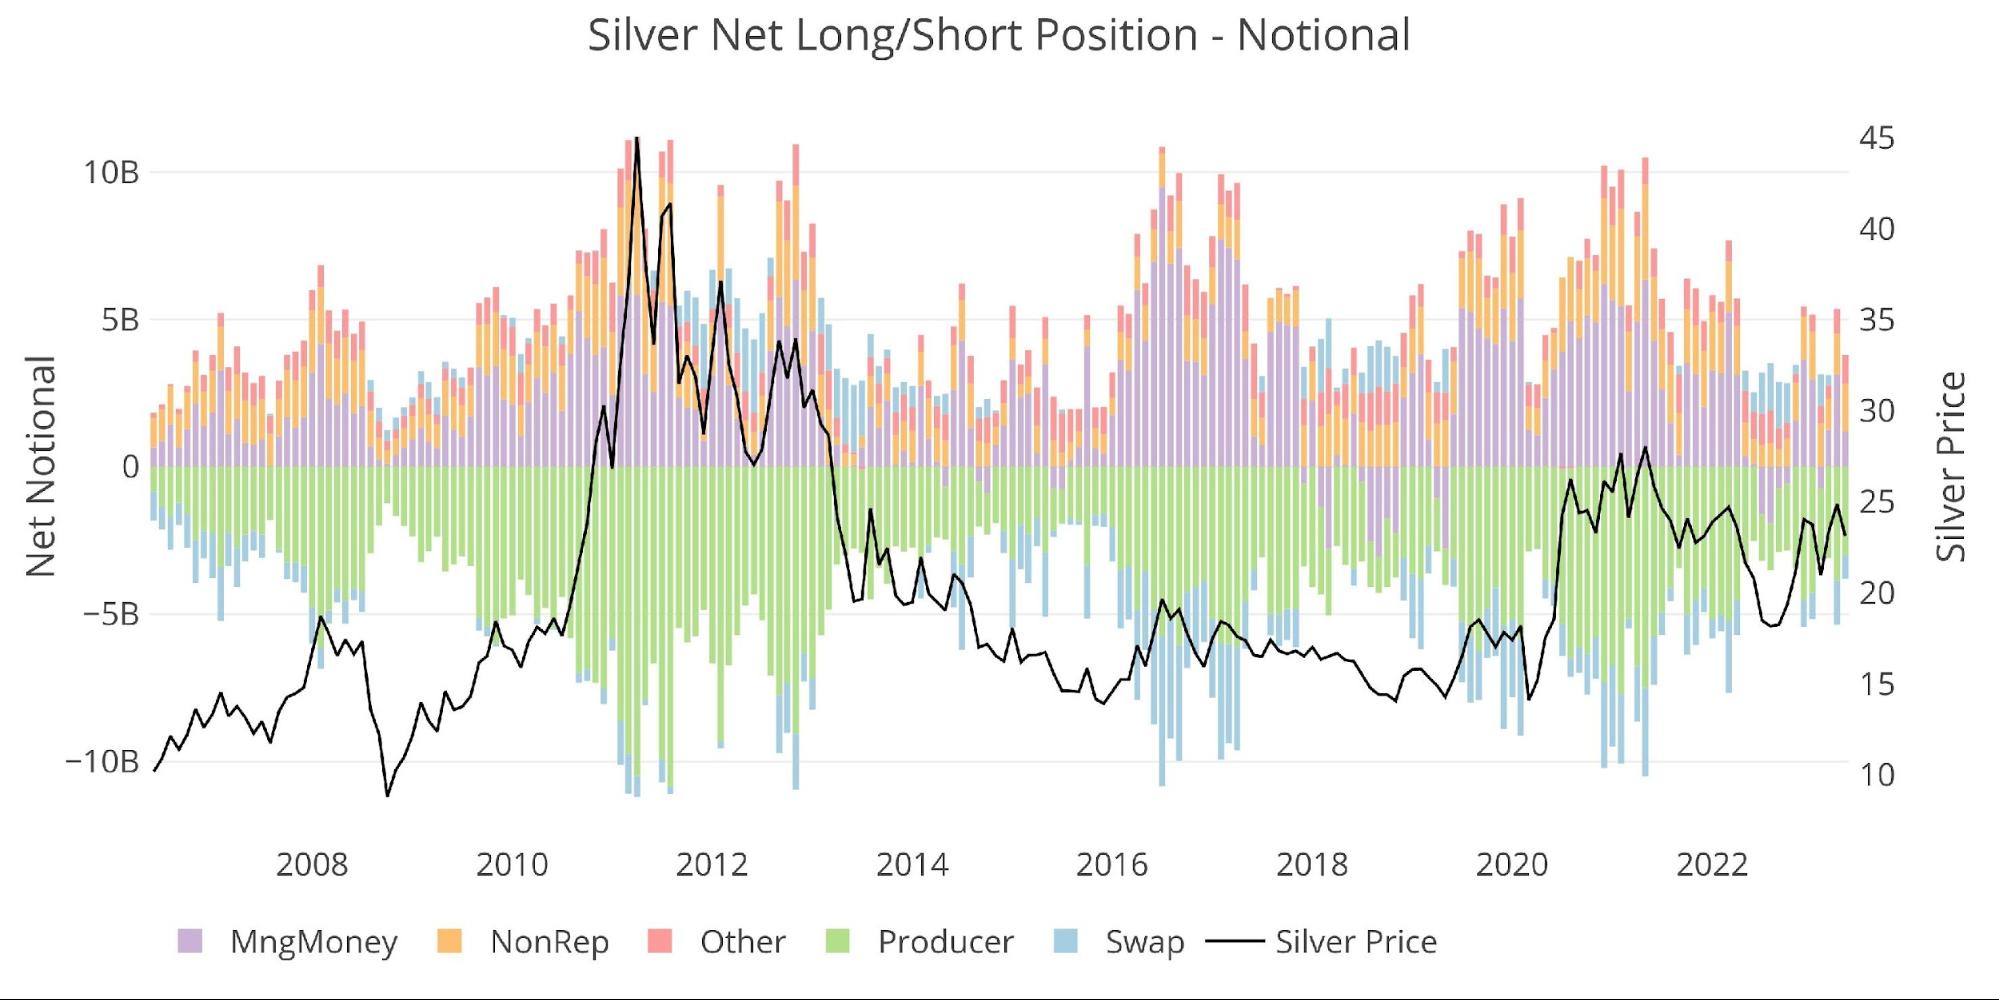
Figure: 15 Net Notional Position
The options market caught a small bid in the recent move, mainly driven by Producers.
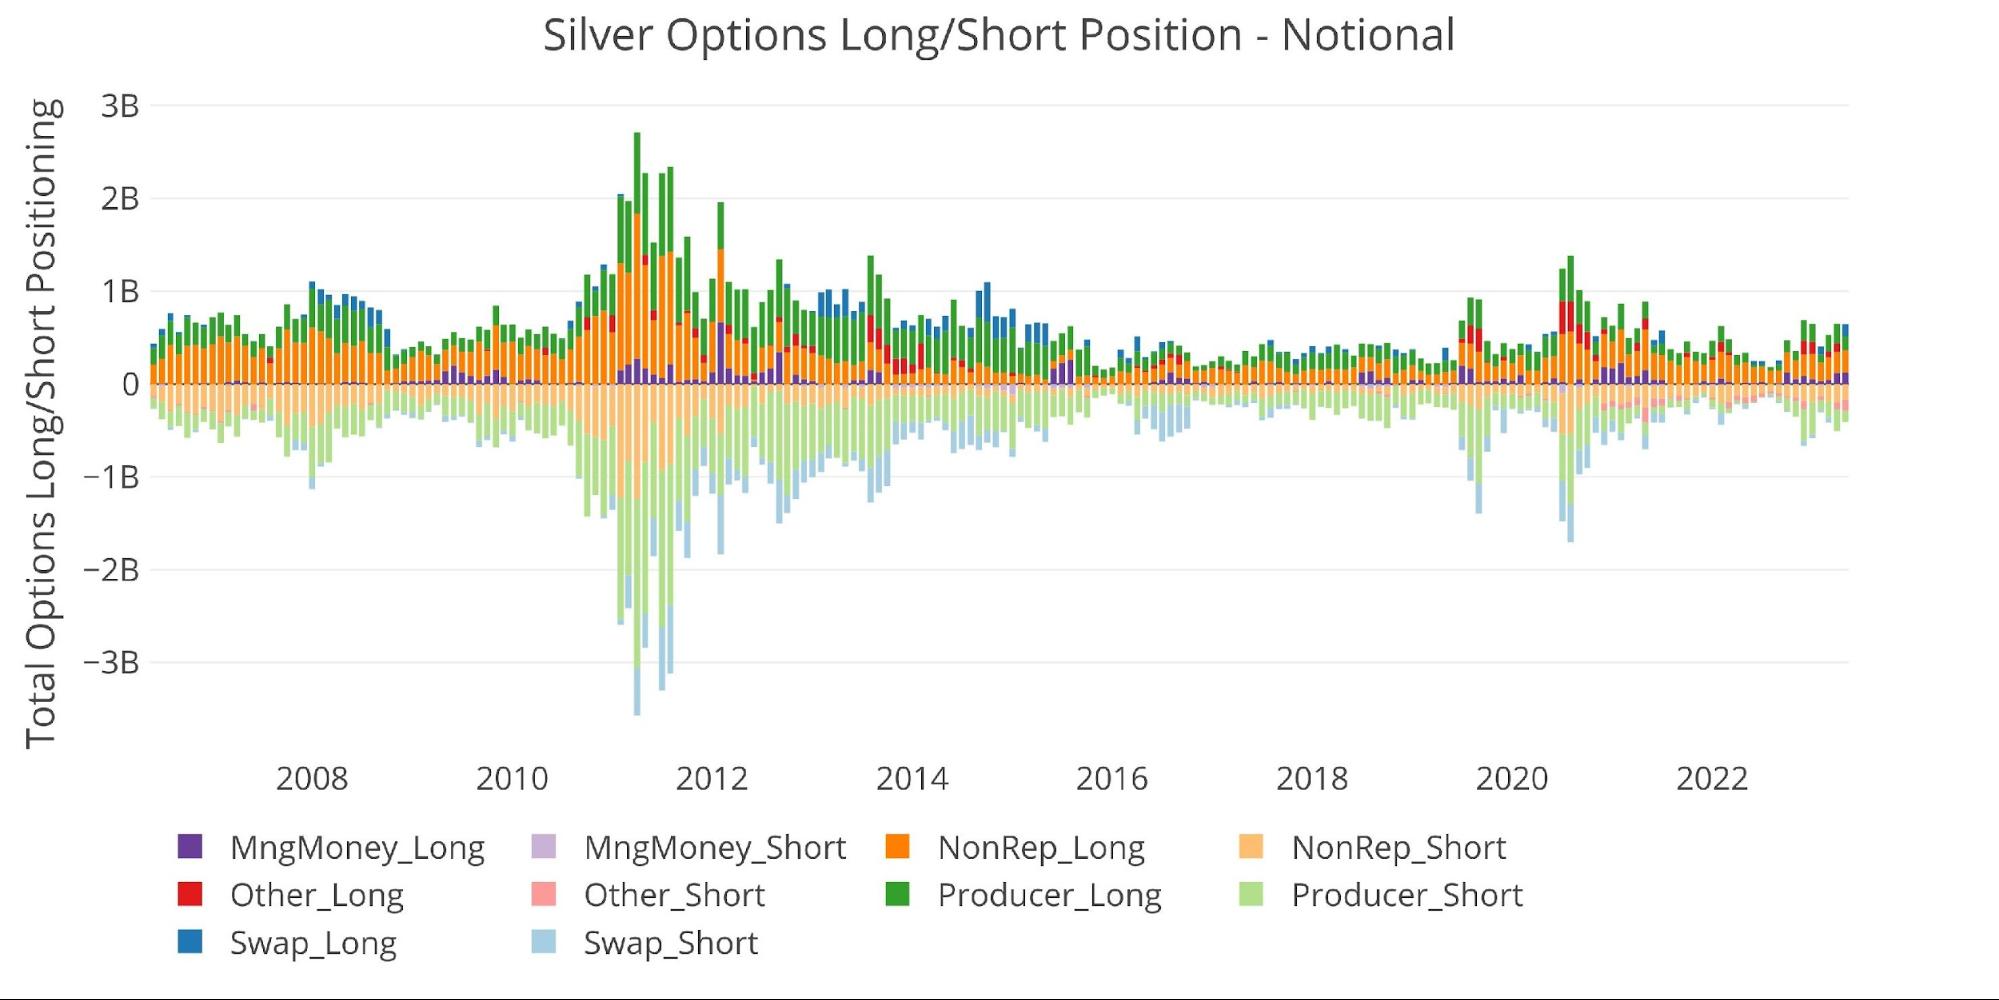
Figure: 16 Options Positions
Conclusion
Over the short-term, Managed Money continues to dominate the price action. This correlation breaks down over the long-term because the overall trend in both gold and silver is up while Managed Money trades around the short-term.
That said, Managed Money is exhibiting less control over the silver market when compared to last year. “Other” in gold has seen the correlation drop quite a bit, most likely from the recent action of buying big just as the market was dropping. They did however front-run the price drop and have potentially gotten back in to ride the next wave higher.
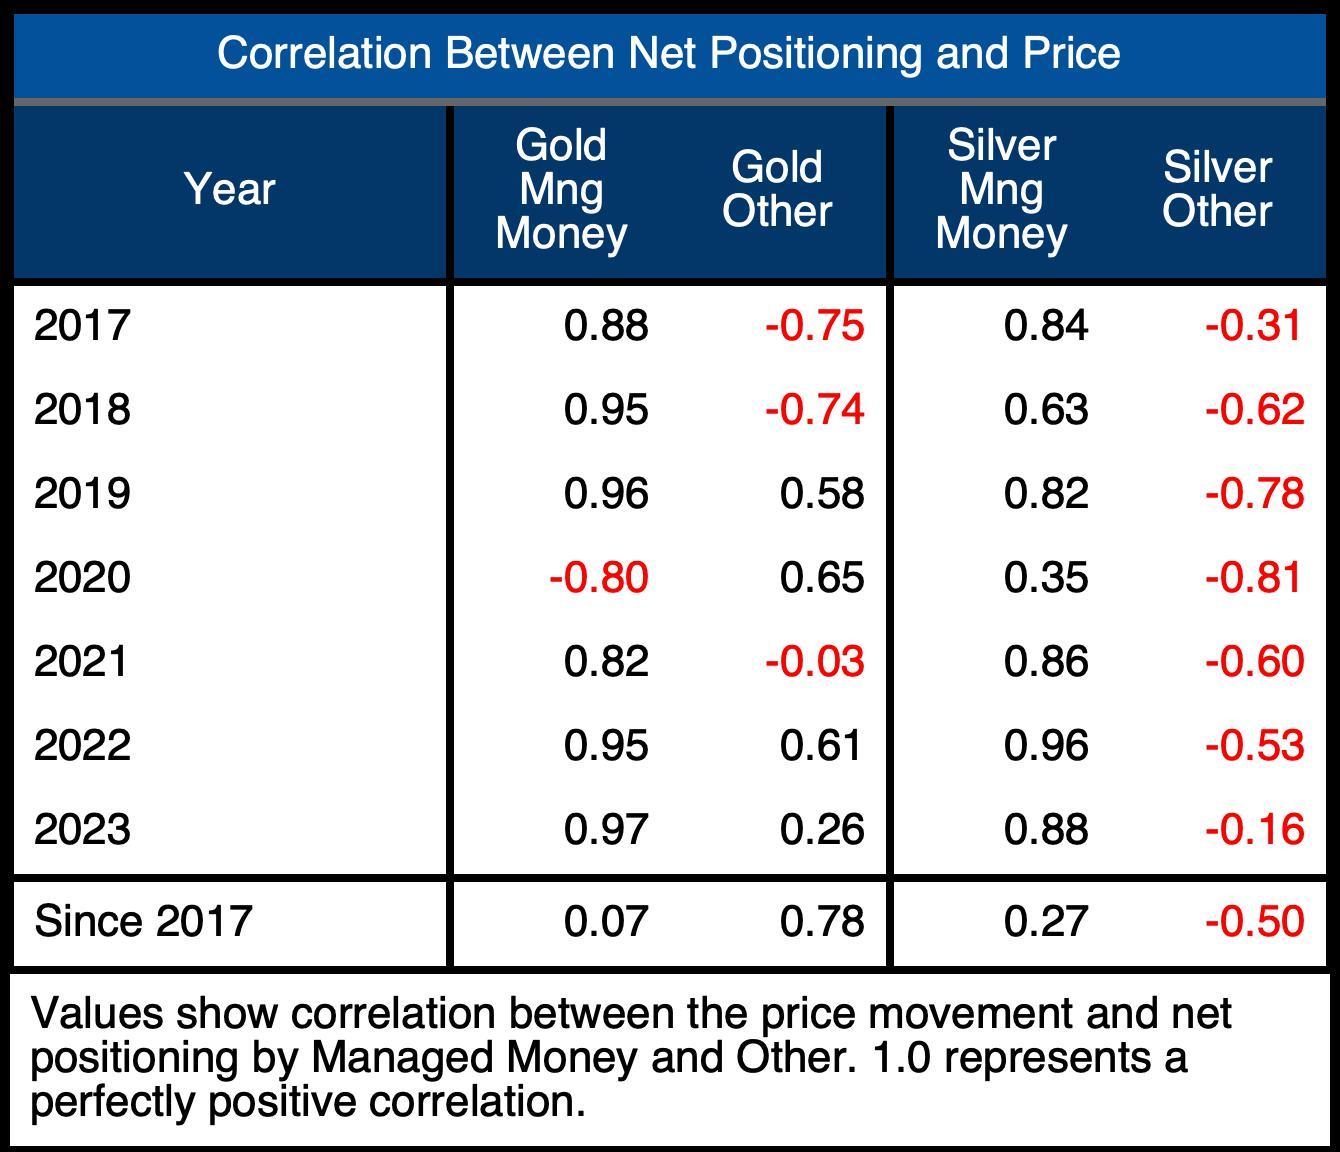
Figure: 17 Correlation Table
No matter how you slice it though, the gold and silver daily price fluctuations are clearly driven by the futures traders. As smart money continues to accumulate physical in a slow and steady fashion, supporting the long-term bull market, the price activity is far more erratic from the futures traders.
Long-term investors can use this data to understand some of the short-term moves. However, anyone who understands the true fundamentals of the macro market should be joining the smart money in the slow accumulation of physical while spot prices remain below $2000 and $30.
Data Source: https://www.cftc.gov/MarketReports/CommitmentsofTraders/index.htm
Data Updated: Every Friday at 3:30 PM as of Tuesday
Last Updated: May 30, 2023
Gold and Silver interactive charts and graphs can be found on the Exploring Finance dashboard: https://exploringfinance.shinyapps.io/goldsilver/

Call 1-888-GOLD-160 and speak with a Precious Metals Specialist today!
Buka akaun dagangan patuh syariah anda di Weltrade.
Source link