The chart below shows the gimmicks the Treasury has been using to manage the debt while the debt ceiling keeps a lid on new issuance. The primary gimmick used is pillaging government retirement funds which hold non-Marketable debt. In April, the government replenished some of what has been taken by retiring public debt (mostly short-term) as tax receipts increased cash available to the Treasury. They will most likely tap back into this next month as the government gets closer to running out of money.
Note: Non-Marketable consists almost entirely of debt the government owes to itself (e.g., debt owed to Social Security or public retirement)
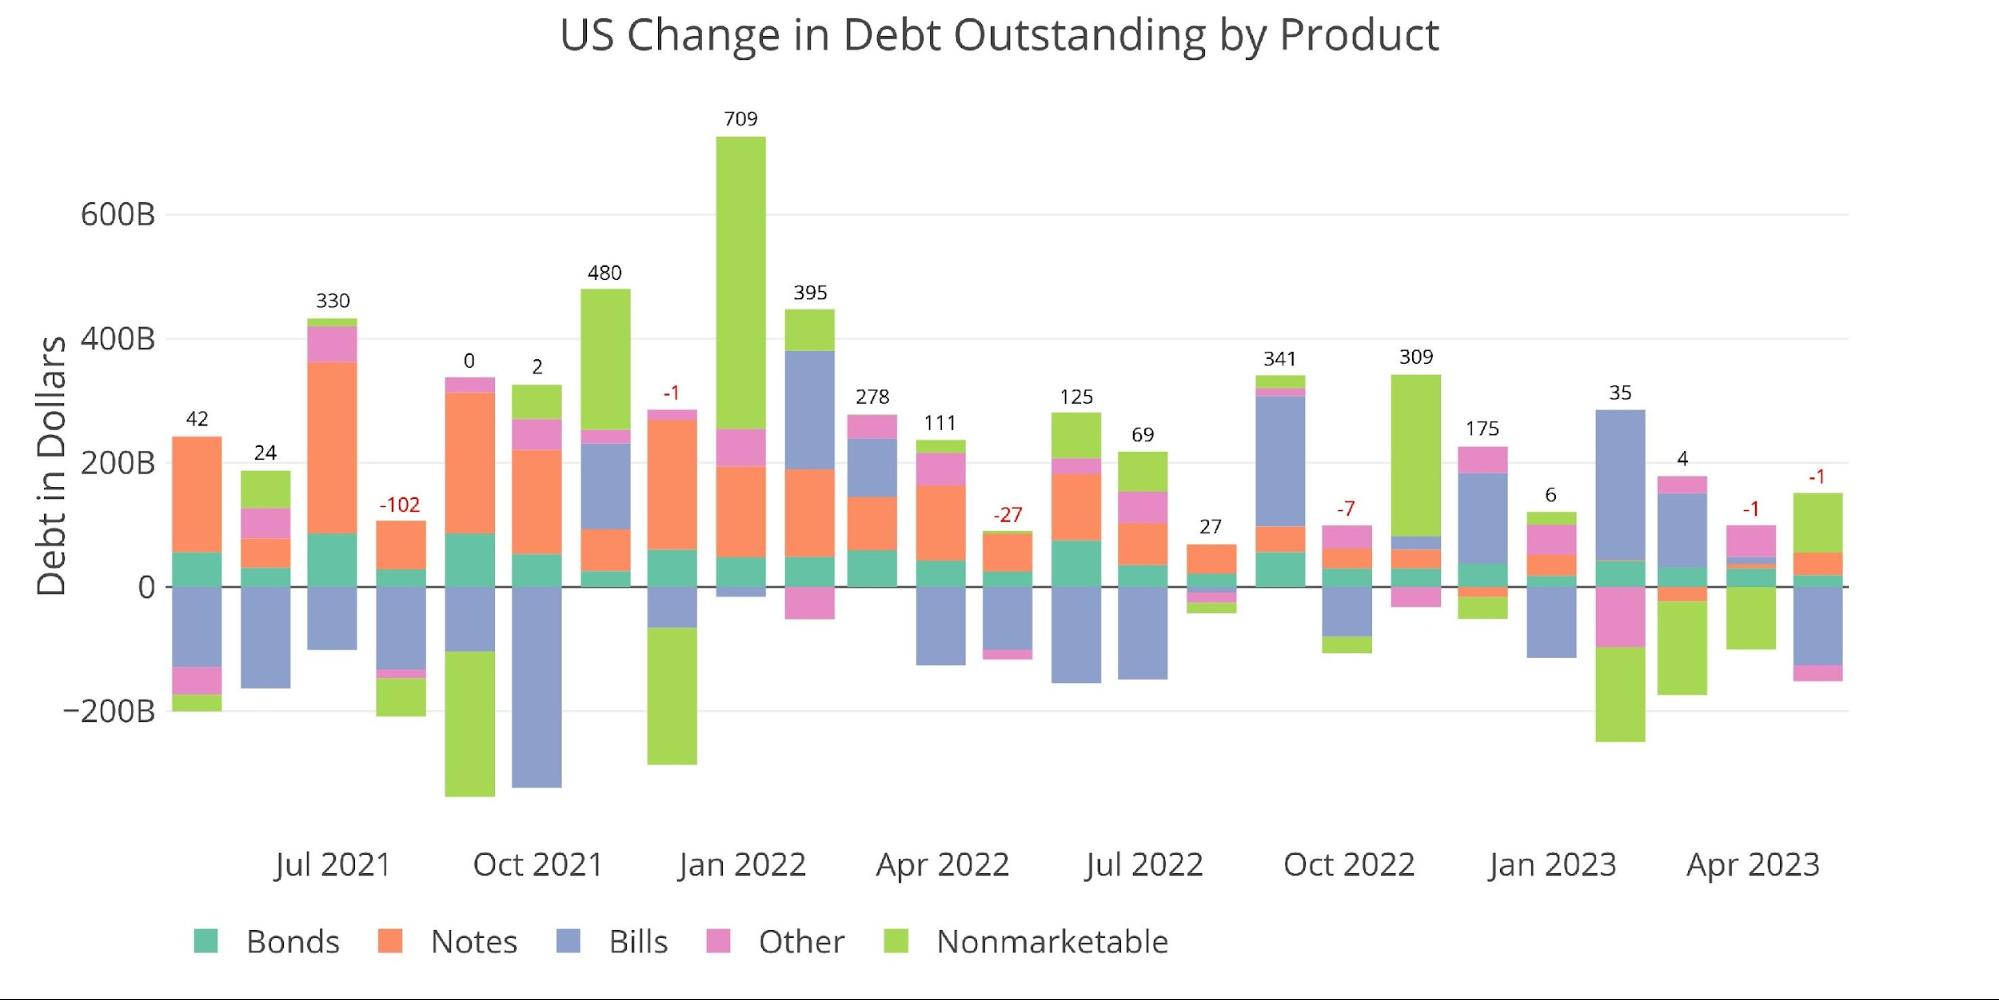
Figure: 1 Month Over Month change in Debt
Given the current debt ceiling saga, the total debt add for the current calendar year does not amount to anything material. The only thing to really notice is that the government replaces Non-Marketable debt with short-term debt.
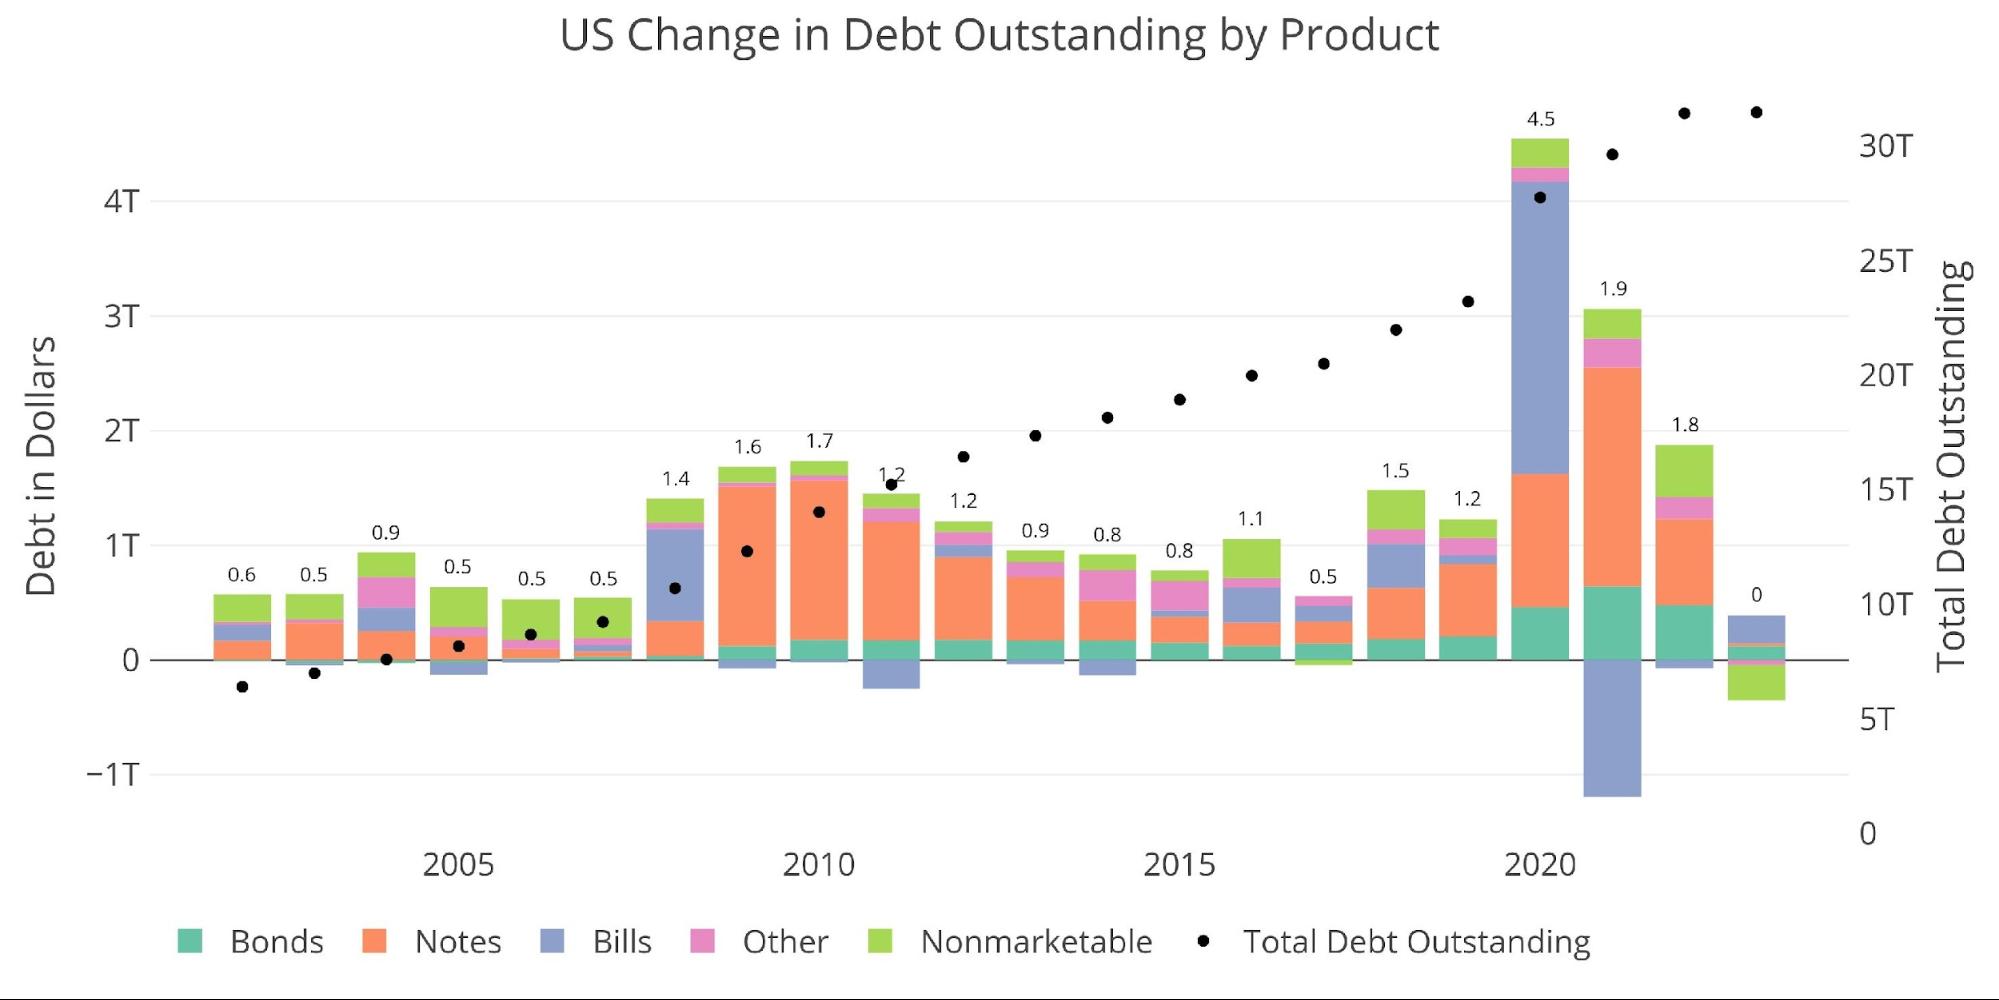
Figure: 2 Year Over Year change in Debt
Before the April tax receipt surge, Treasury cash balances had gotten as low as $86B on April 13th. Receipts then brought the cash balance up to $316B on April 26th. As of May 4th, that balance has already fallen back to $188B.
Unfortunately for the Treasury, tax receipts are much lower than forecast. This has an immediate impact of giving the Treasury a shorter runway before the debt ceiling must be raised while also increasing budget deficits to much larger levels than previously expected.
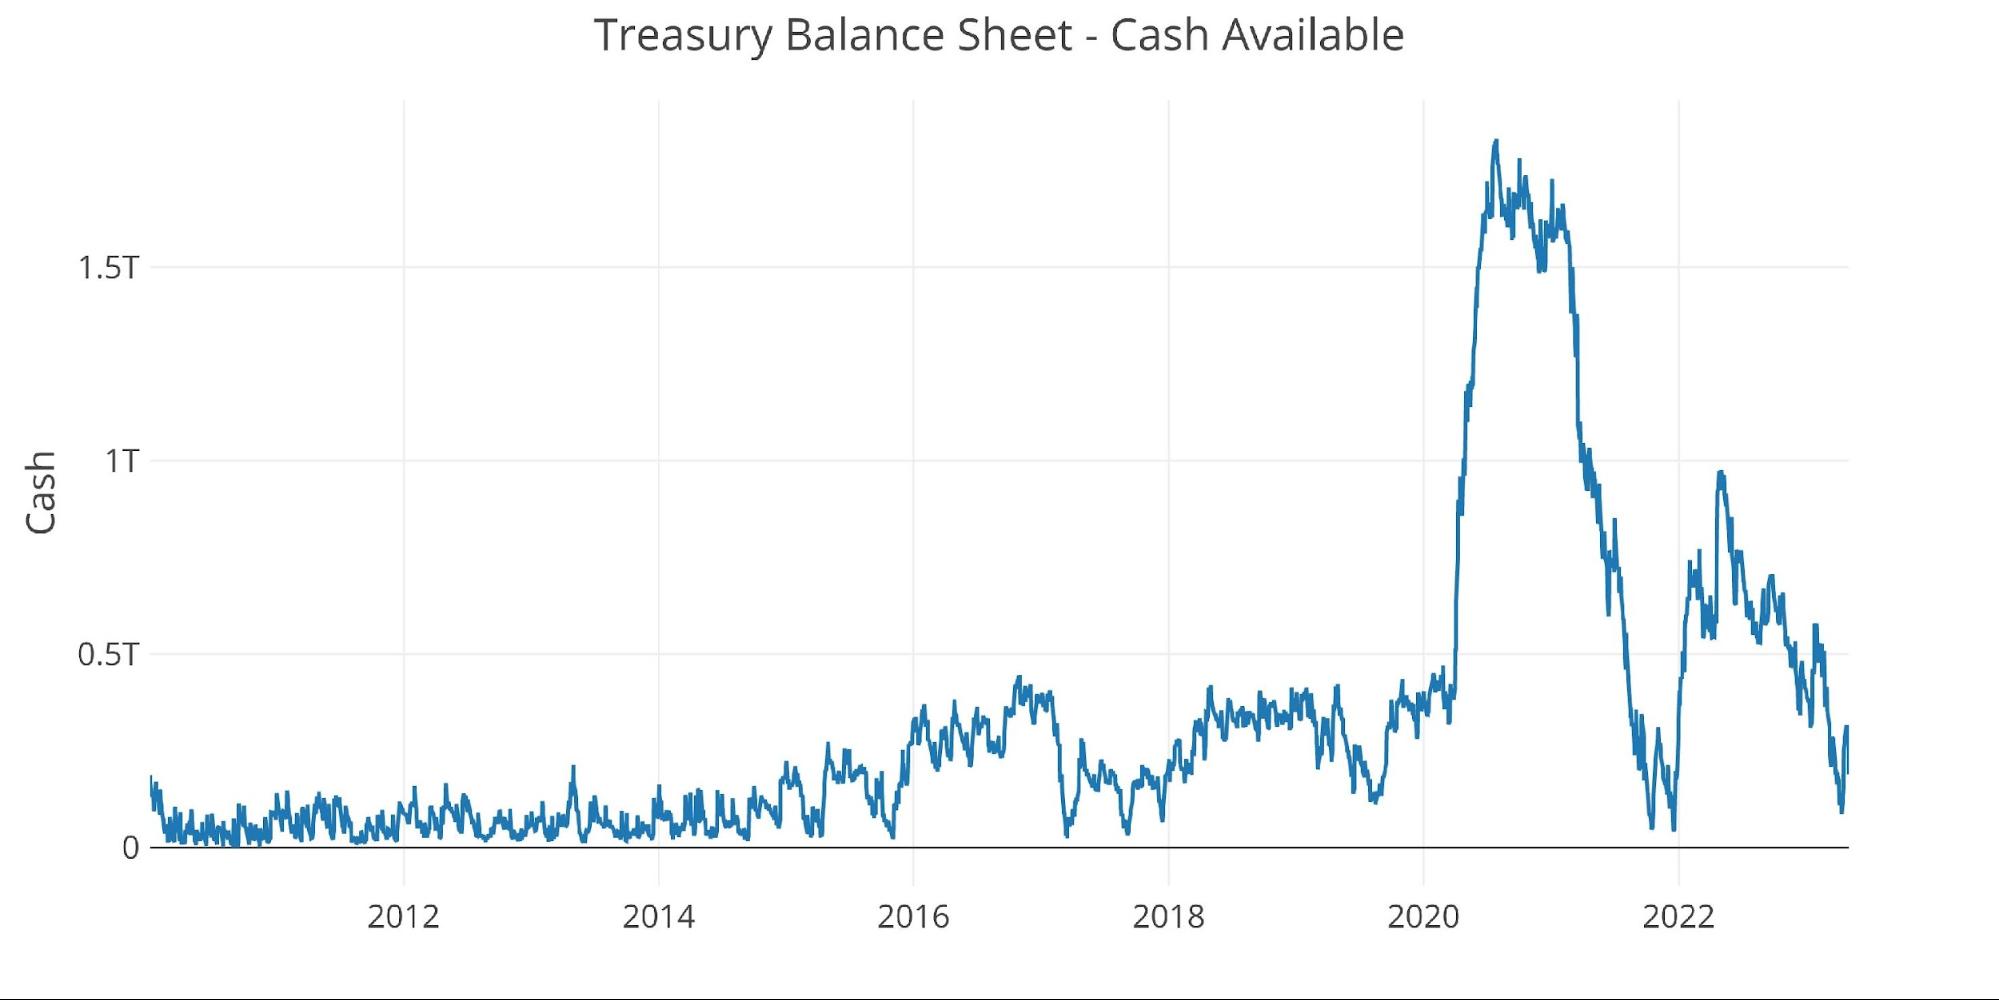
Figure: 3 Treasury Cash Balance
Average maturity on the debt has fallen some as the Treasury has been issuing mostly short-term debt since the debt ceiling was hit. That said, it still stands at 6.17 yrs. which is near multi-decade highs.
Weighted average interest has reached 2.28%. This is only back to 2019 levels; however, a significantly higher debt balance means that interest expense is far greater than it was back then.
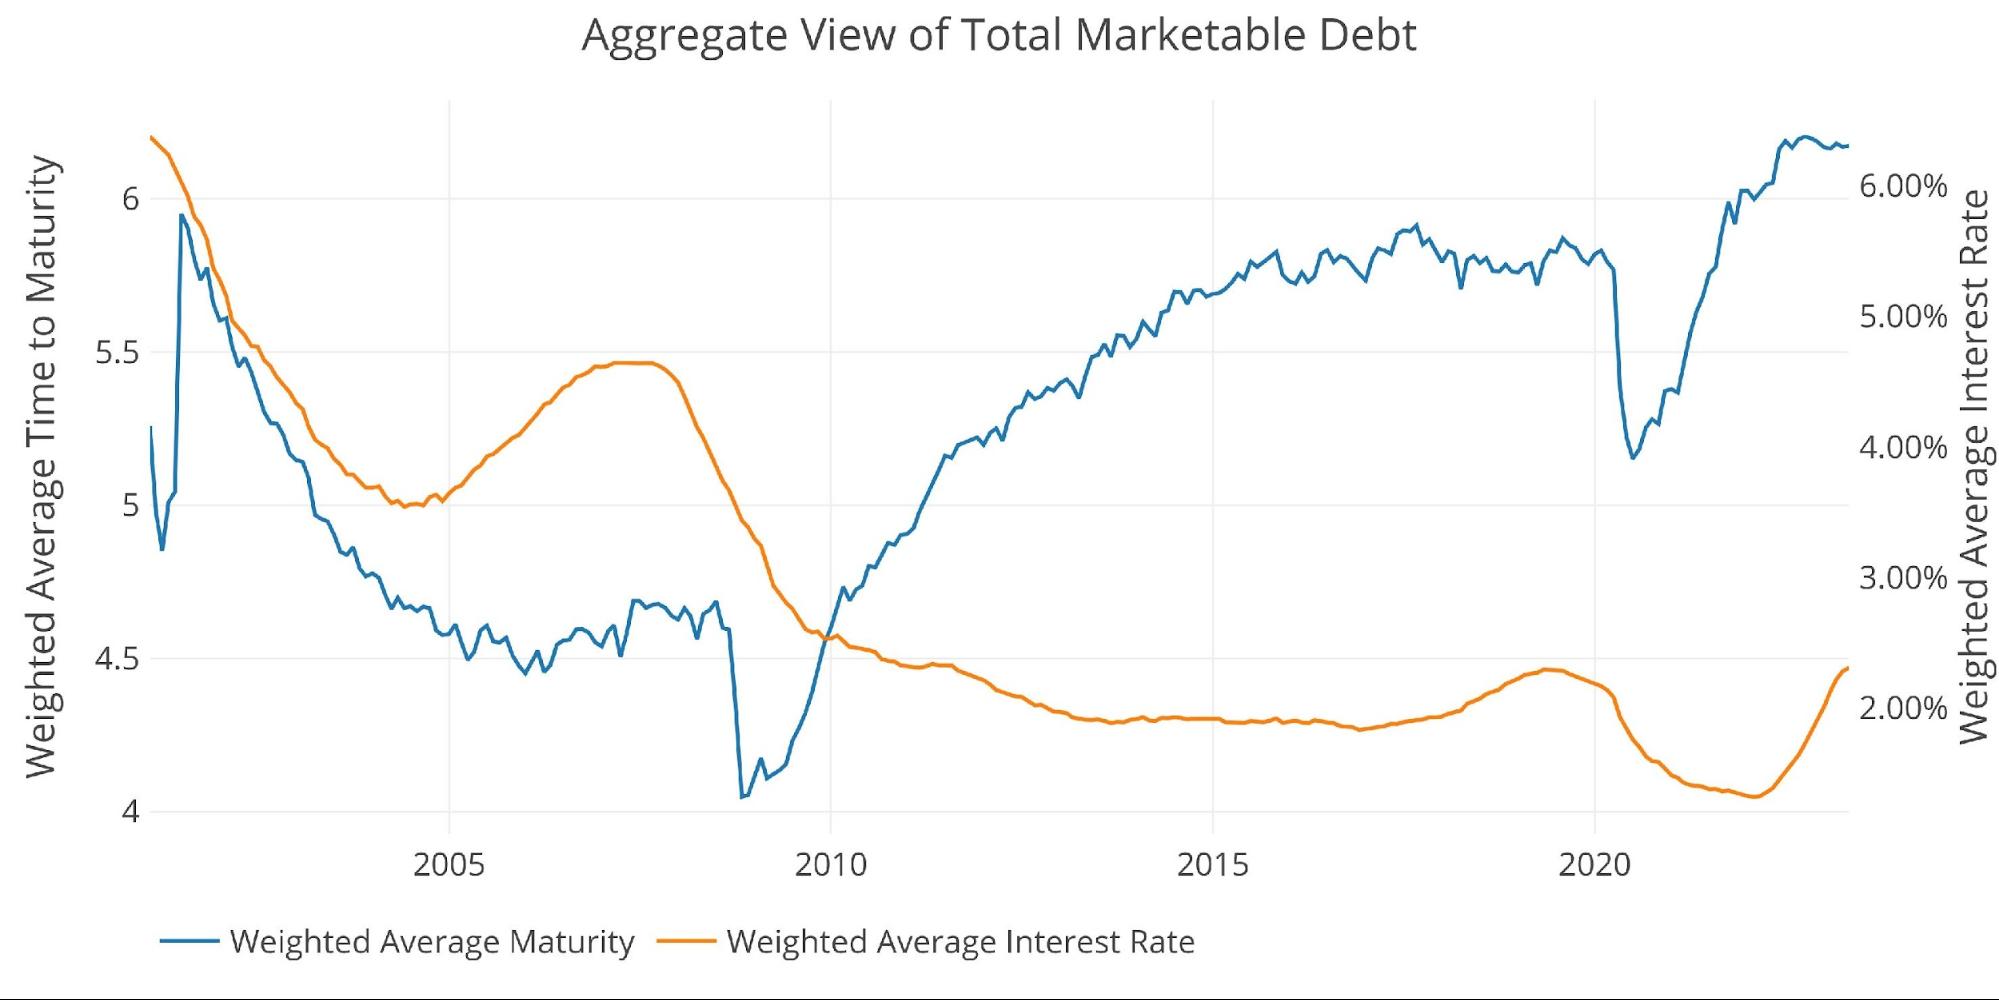
Figure: 4 Weighted Averages
This can be seen clearly in the chart below. Interest expense has absolutely exploded upwards. In 2019, interest expense reached about $350B. Despite a similar weighted average maturity, interest expense is now $564B!
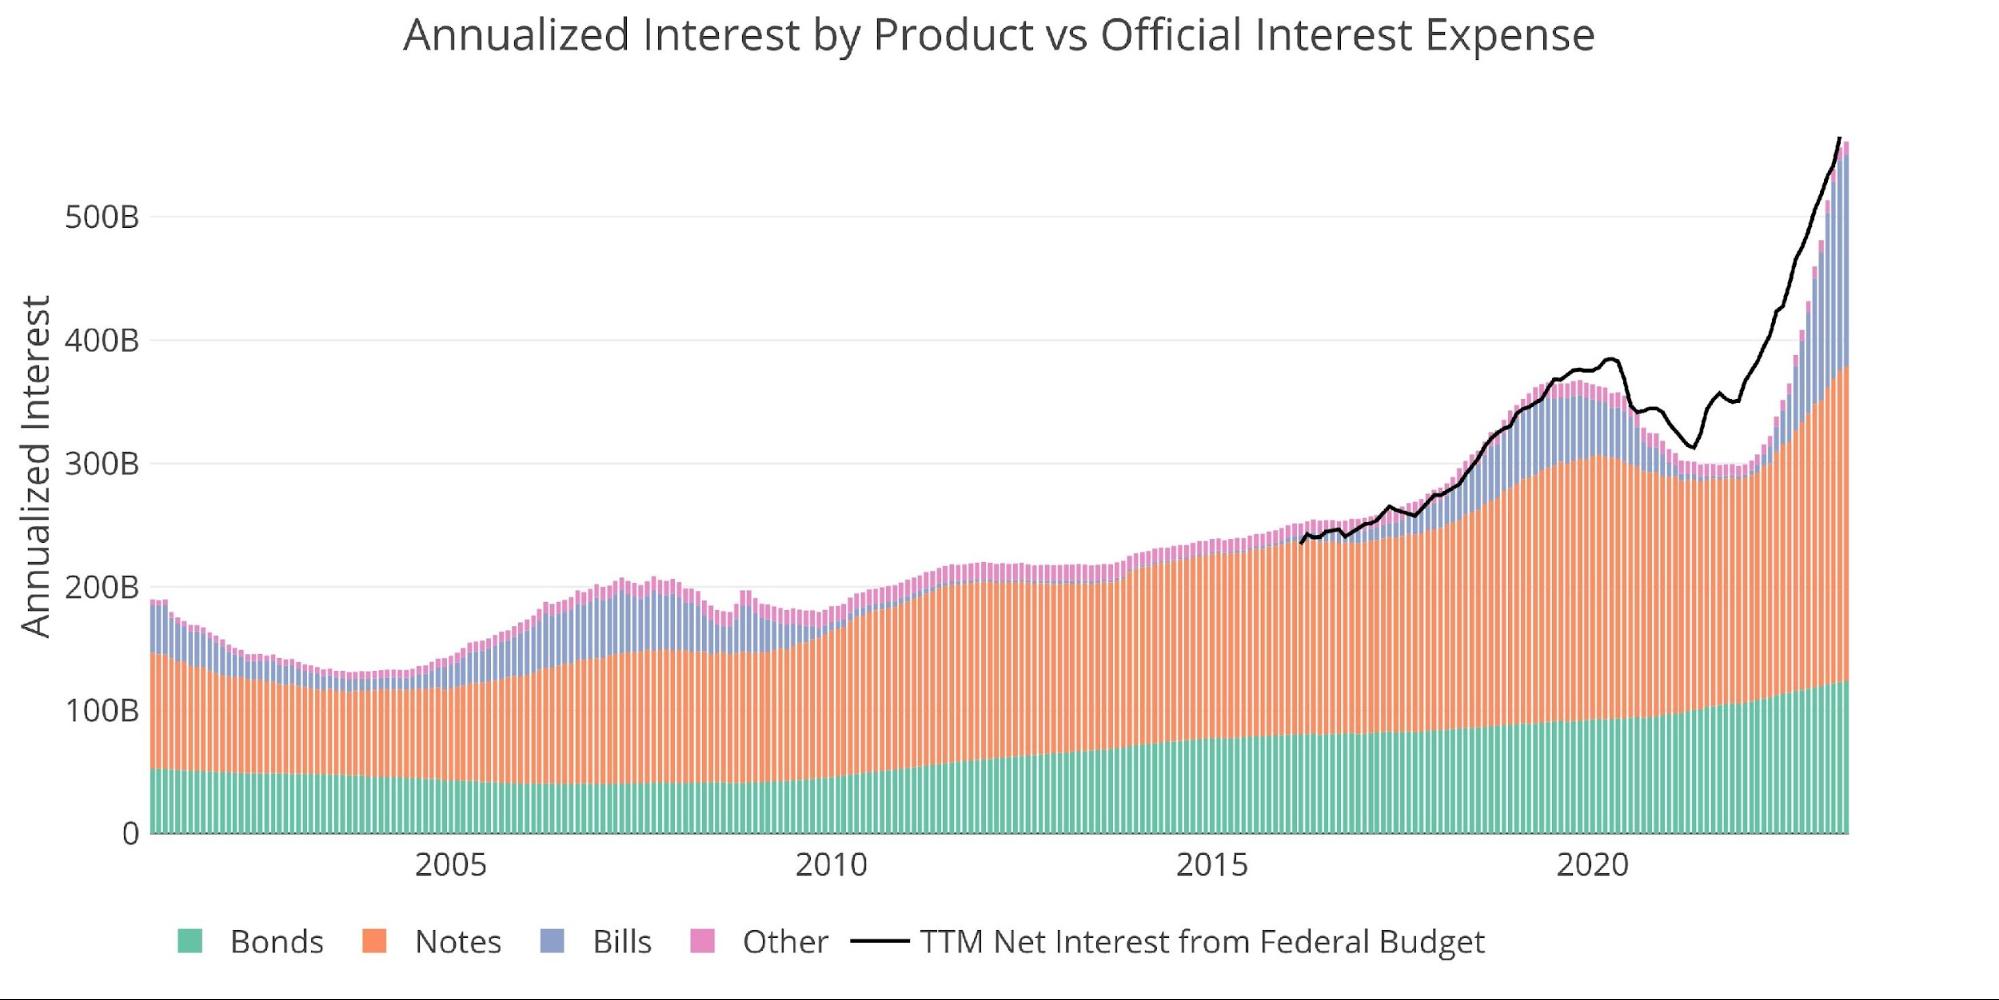
Figure: 5 Net Interest Expense
As bad as a 61% increase in Net Interest Expense seems, the more troubling part is the trajectory. The plot below uses the debt maturity schedule and an anticipated $2T a year in new debt issuance to forecast interest expense based on Fed rate expectations. By the end of this year, the Treasury will face Interest Expense exceeding $700B annually, crossing $800B by next June!
This is the reason the Fed cannot keep rates elevated for long. This is not something that happens over several years. The impact of higher rates is happening right now and will worsen dramatically over 12 months.
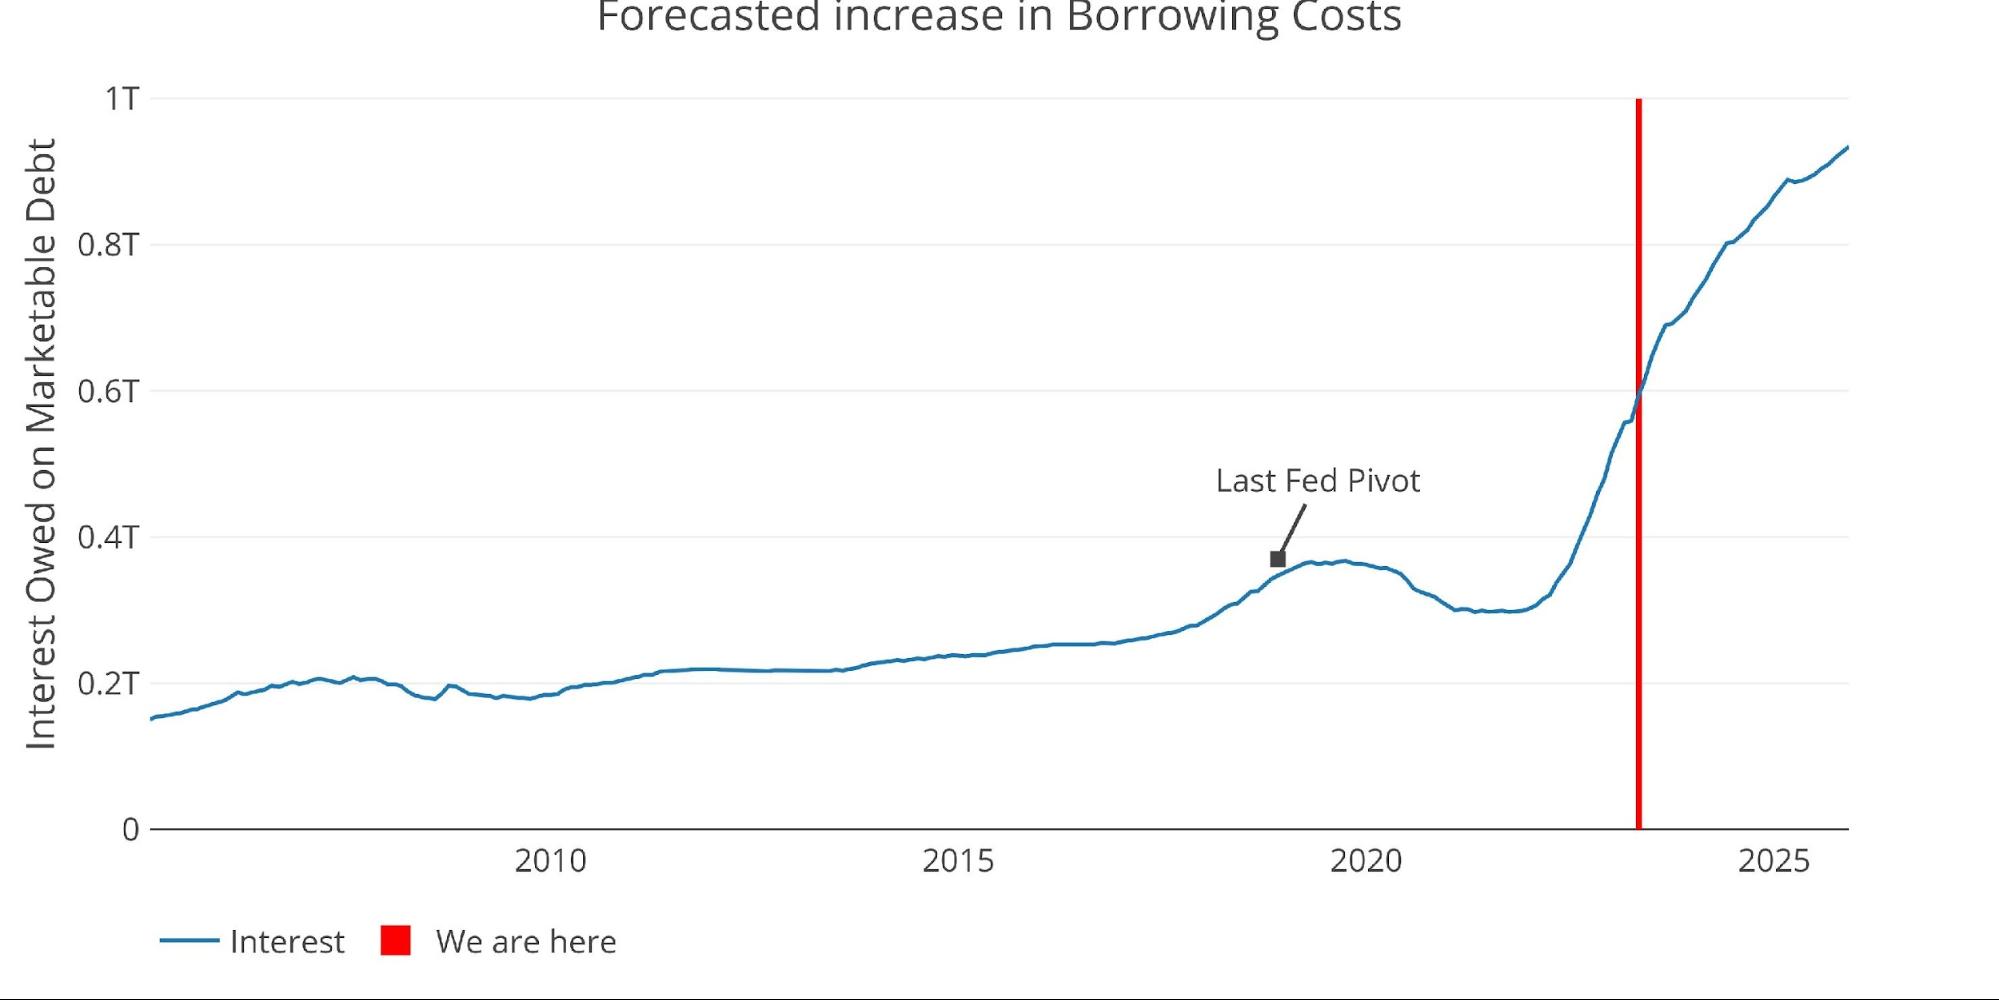
Figure: 6 Projected Net Interest Expense
The rollover of the debt can be seen below. Most of the near-term rollover will be Bills that will be close to the higher rates already. It will be the Notes rolling over that will really drive interest costs.
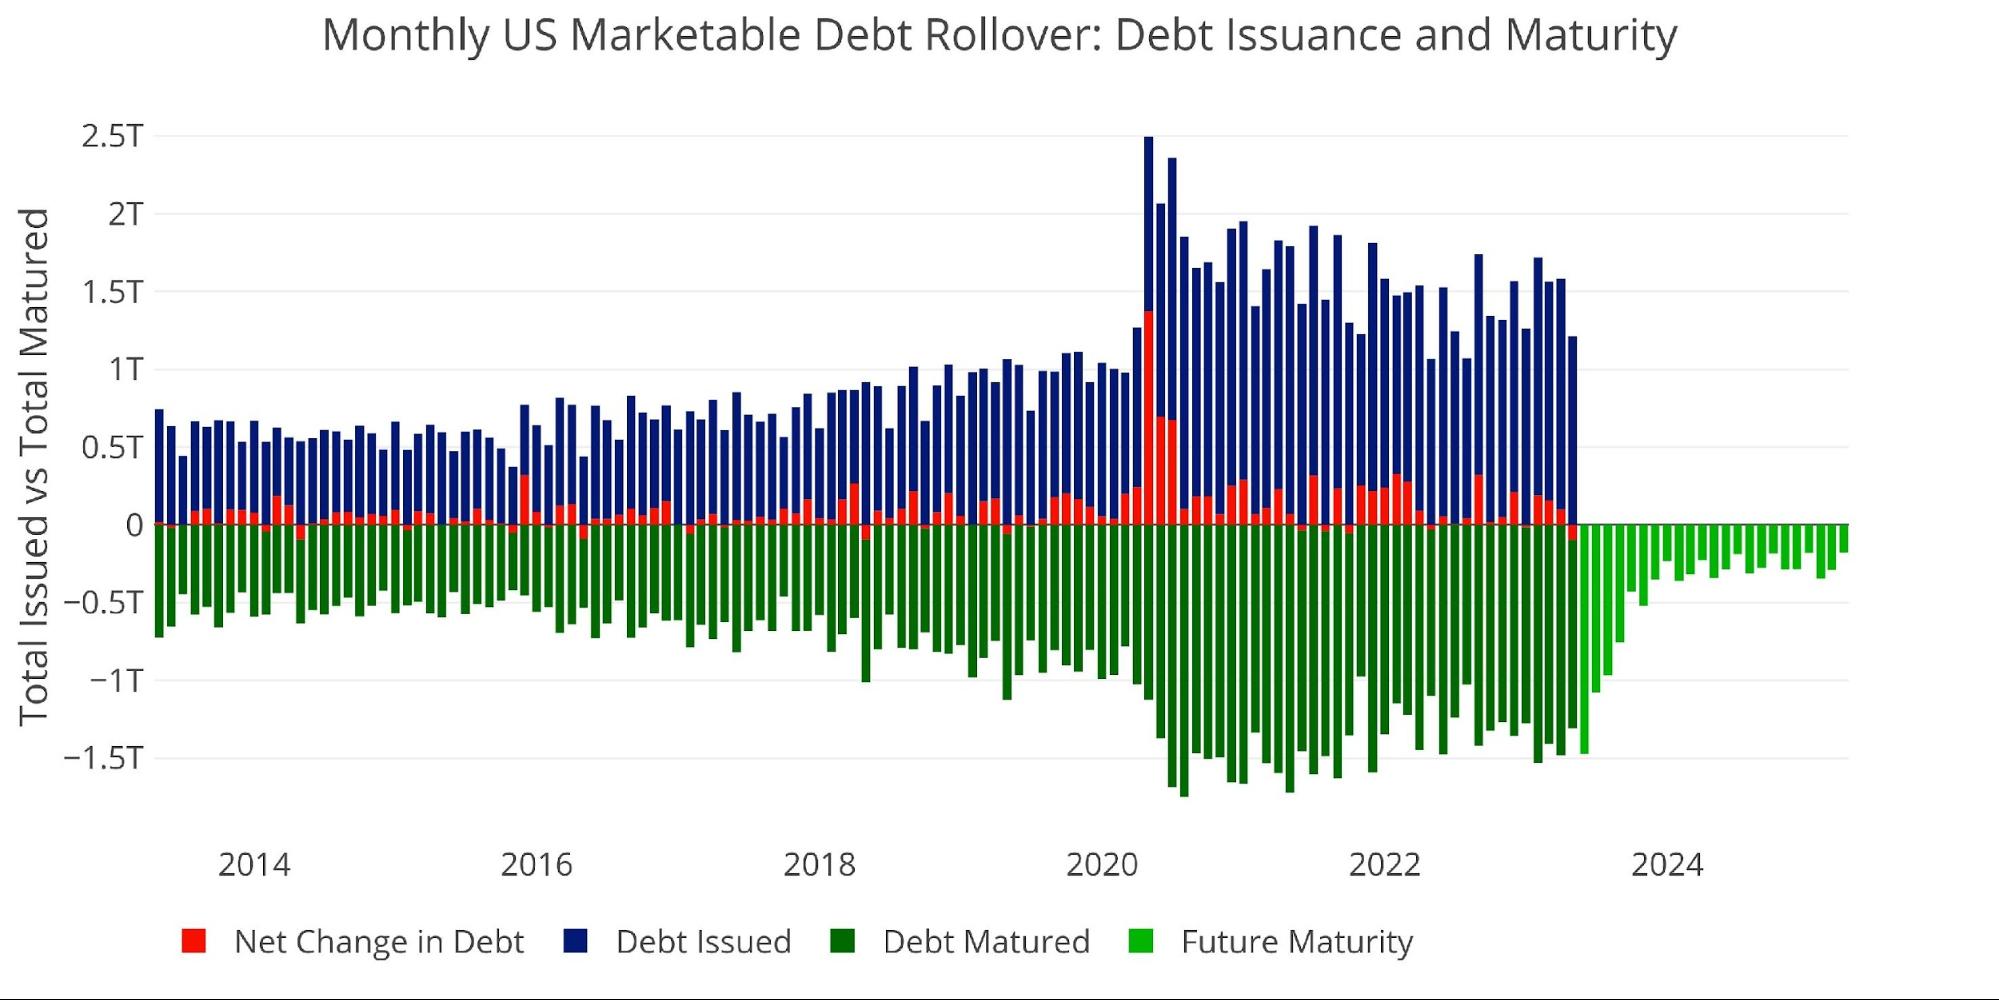
Figure: 7 Monthly Rollover
Note “Net Change in Debt” is the difference between Debt Issued and Debt Matured. This means when positive it is part of Debt Issued and when negative it represents Debt Matured
The chart below zooms on the annual rollover of Notes. As shown, almost $1.9T still needs to rollover this year with $2.9T set to rollover in 2024. This is driving the upcoming surge in interest expense. The Notes rolling over will be of 2-10 year maturities so are still locked in at rates near zero. When they rollover, they will drive massive increases in Net Interest expense, costing 3.5%+. Keep in mind that this is existing debt that needs to rollover so it is coming with or without the debt ceiling.
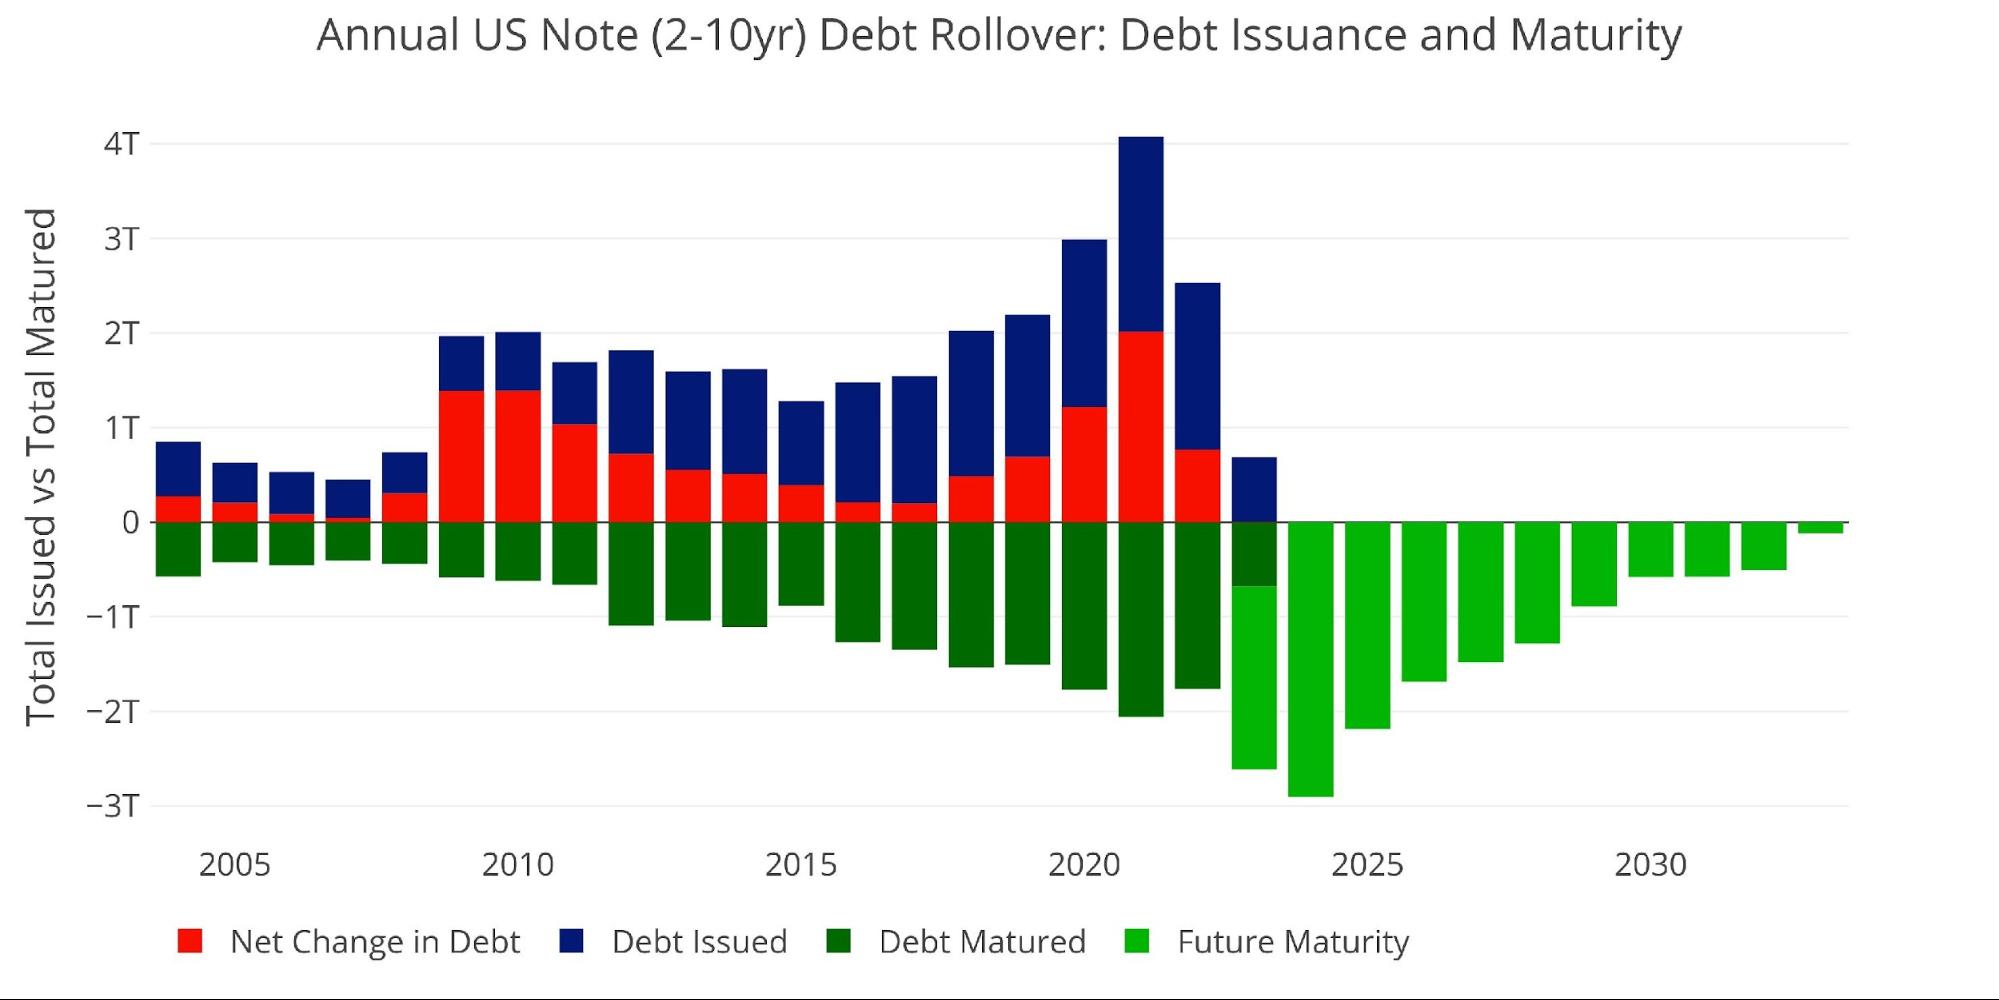
Figure: 8 Treasury Note Rollover
Digging into the Debt
The table below summarizes the total debt outstanding. A few key takeaways:
On a monthly basis:
-
- As mentioned, the Treasury used tax receipts to retire $126B in short-term debt and replenish $96B in Non-Marketable
- Even with the debt ceiling in place for 5 months now, the Treasury has averaged $90B of new debt issuance over the last 12 months
-
- This will explode higher once the debt ceiling is lifted
-
On a TTM Basis:
-
- Debt issuance is clearly down, falling from $2.2T to $1.1T
-
- It should be noted that $1.1T is still a lot of debt issuance, especially when it came over 7 months!
-
- With the recession set to worsen, tax receipts to fall, and government expenses to rise – debt issuance will likely get back over $2T in the very near future
- Debt issuance is clearly down, falling from $2.2T to $1.1T
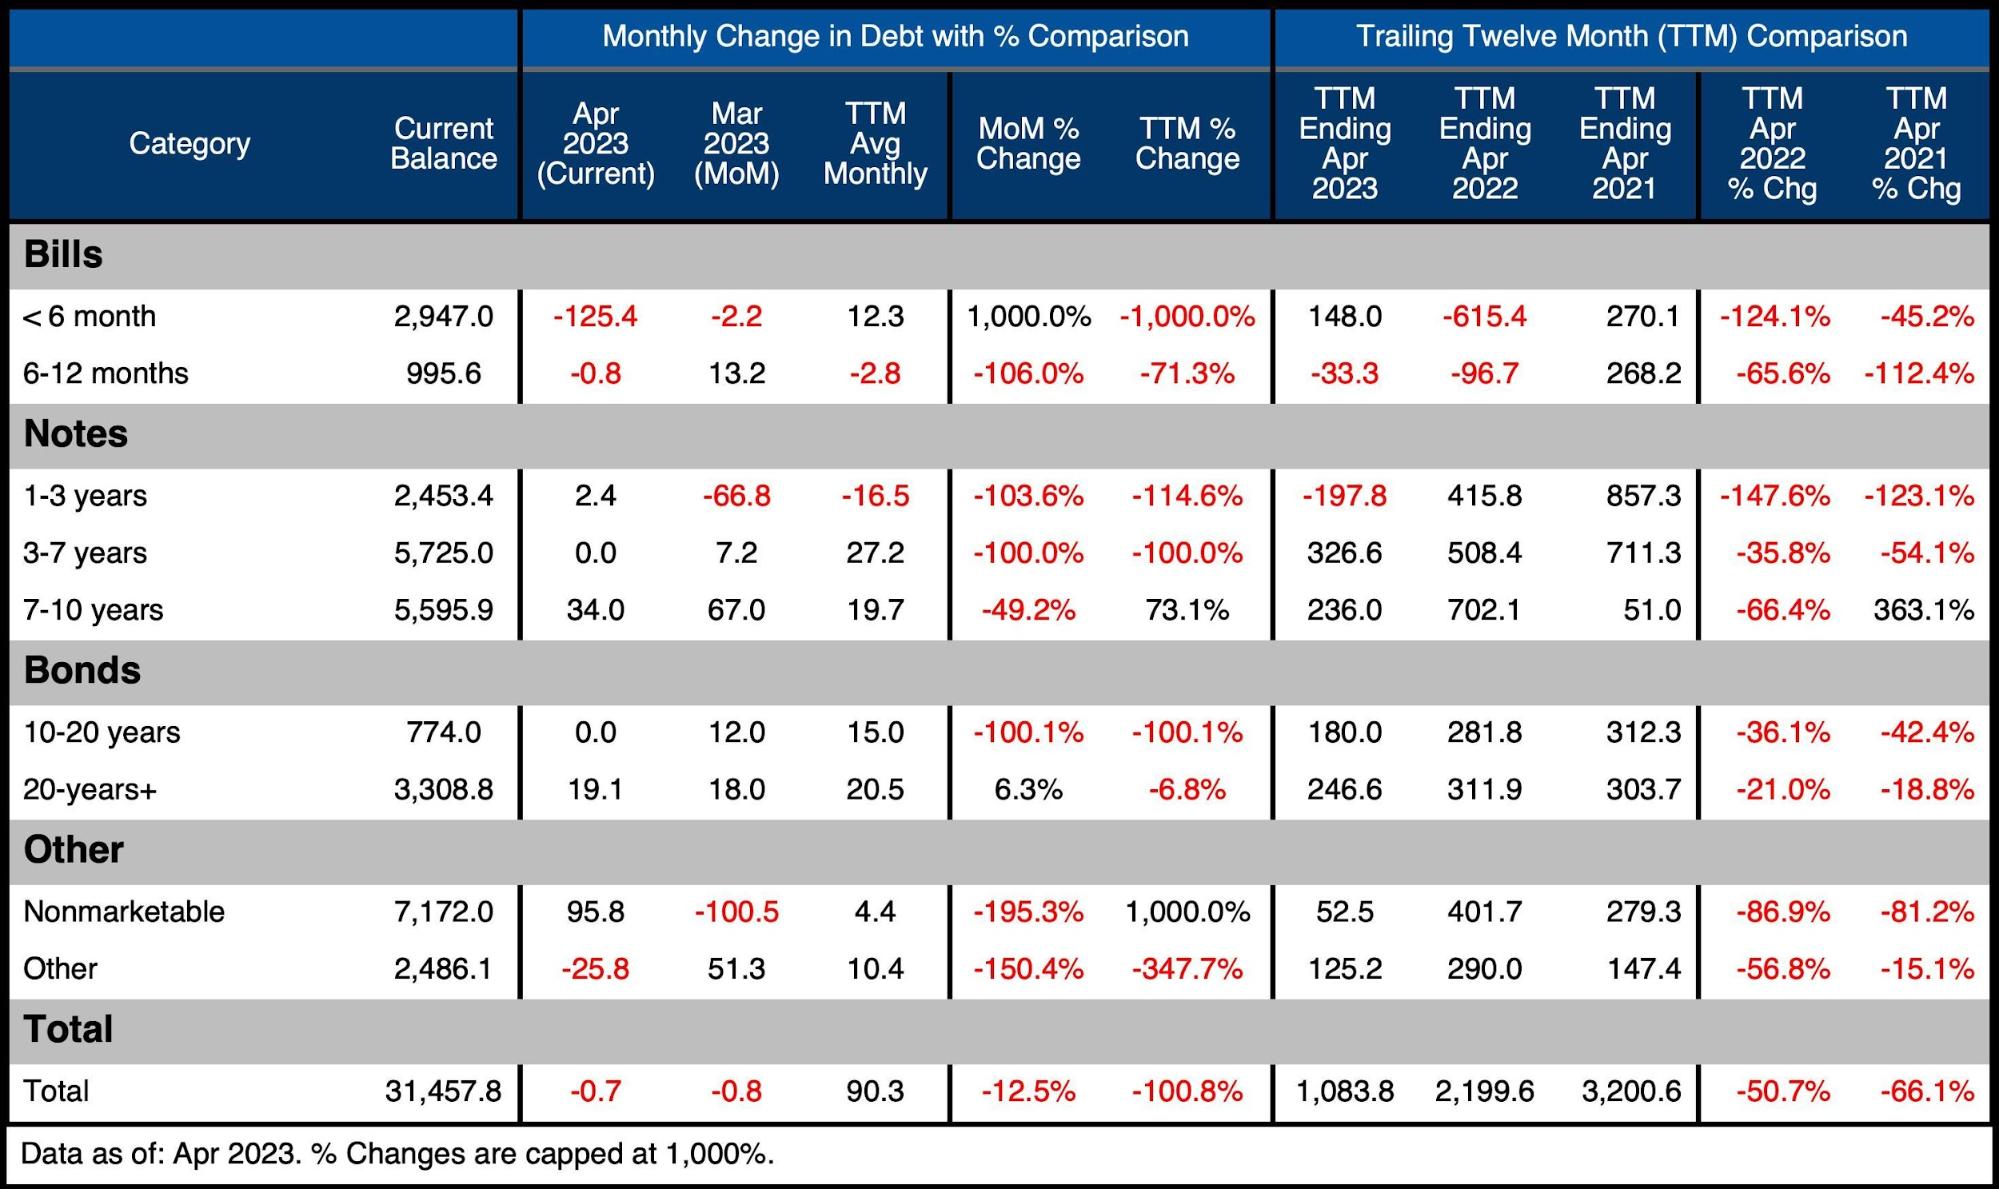
Figure: 9 Recent Debt Breakdown
A Looming Recession
The current or looming recession has been very clear to the bond market for some time. The Yield Curve has been inverted since July last year and remains inverted at a spread of -38Bps.
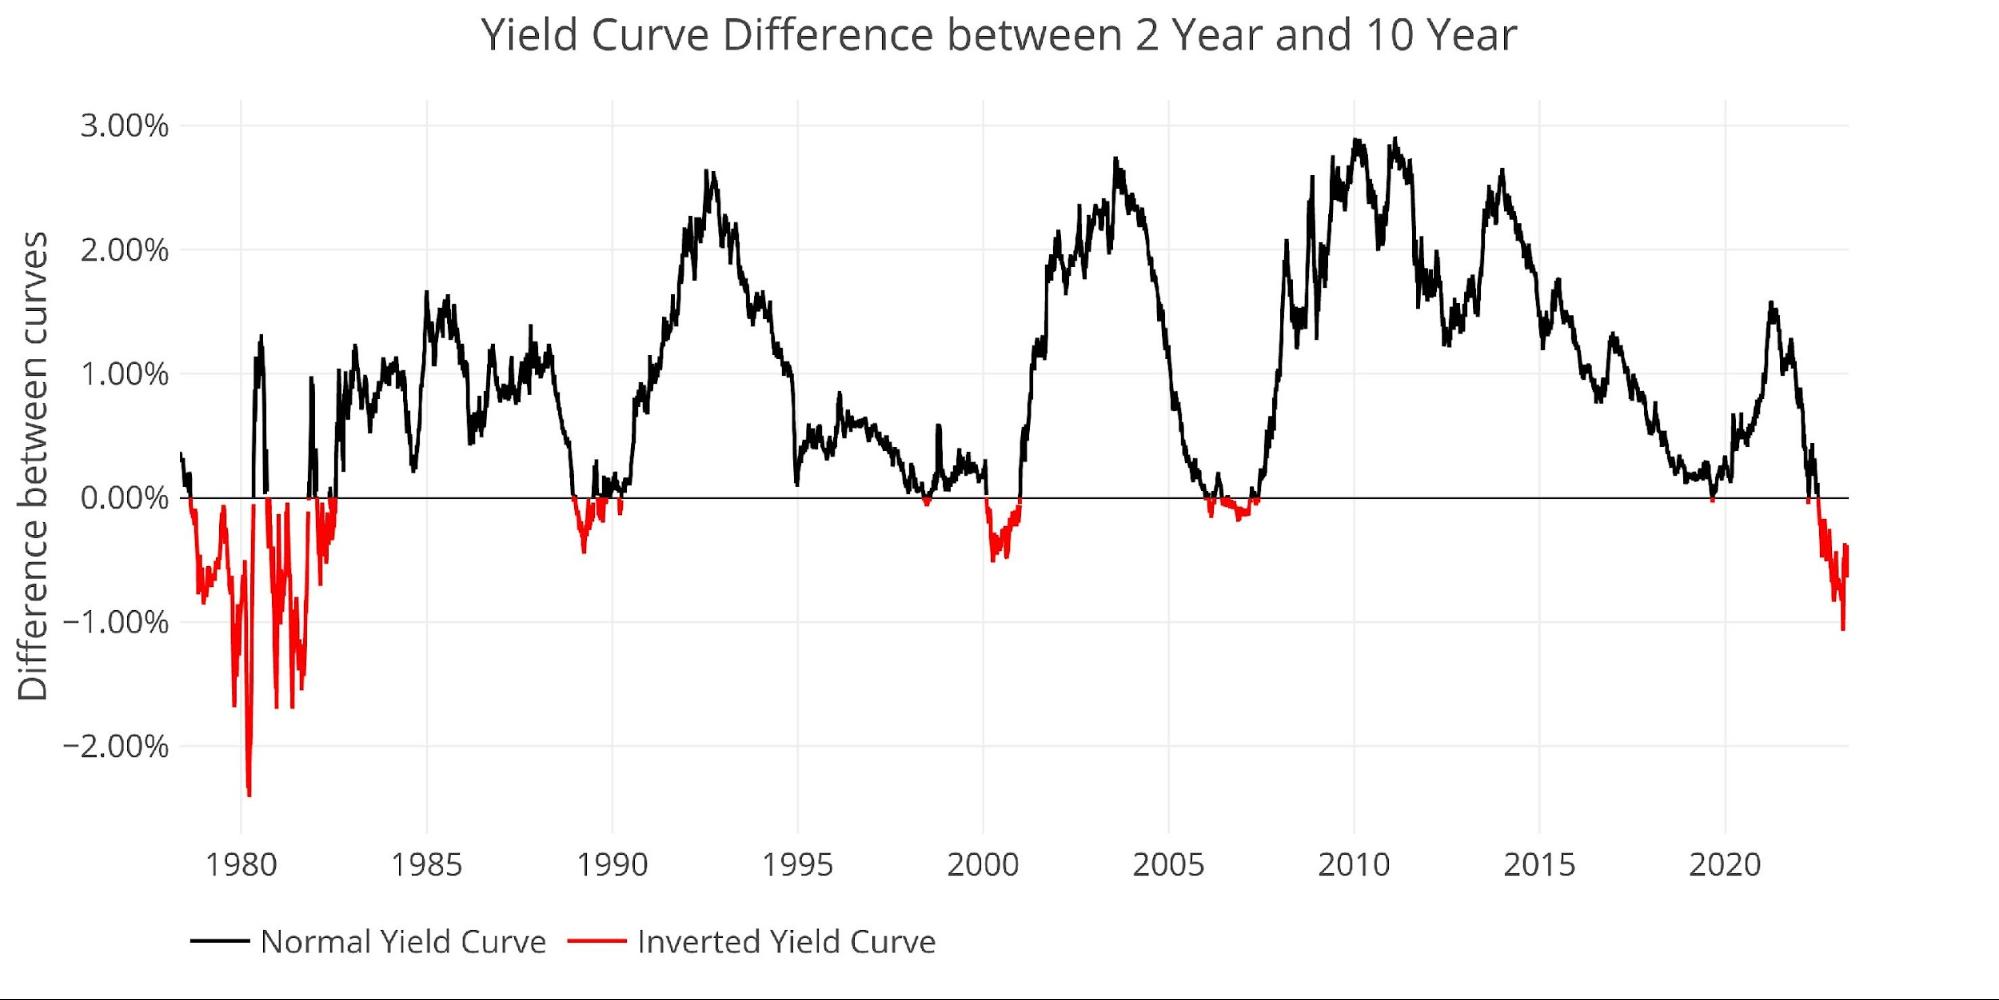
Figure: 10 Tracking Yield Curve Inversion
Bid-to-cover ratios have stayed relatively consistent over the last several years. A change here will indicate a major transformation in the bond market.
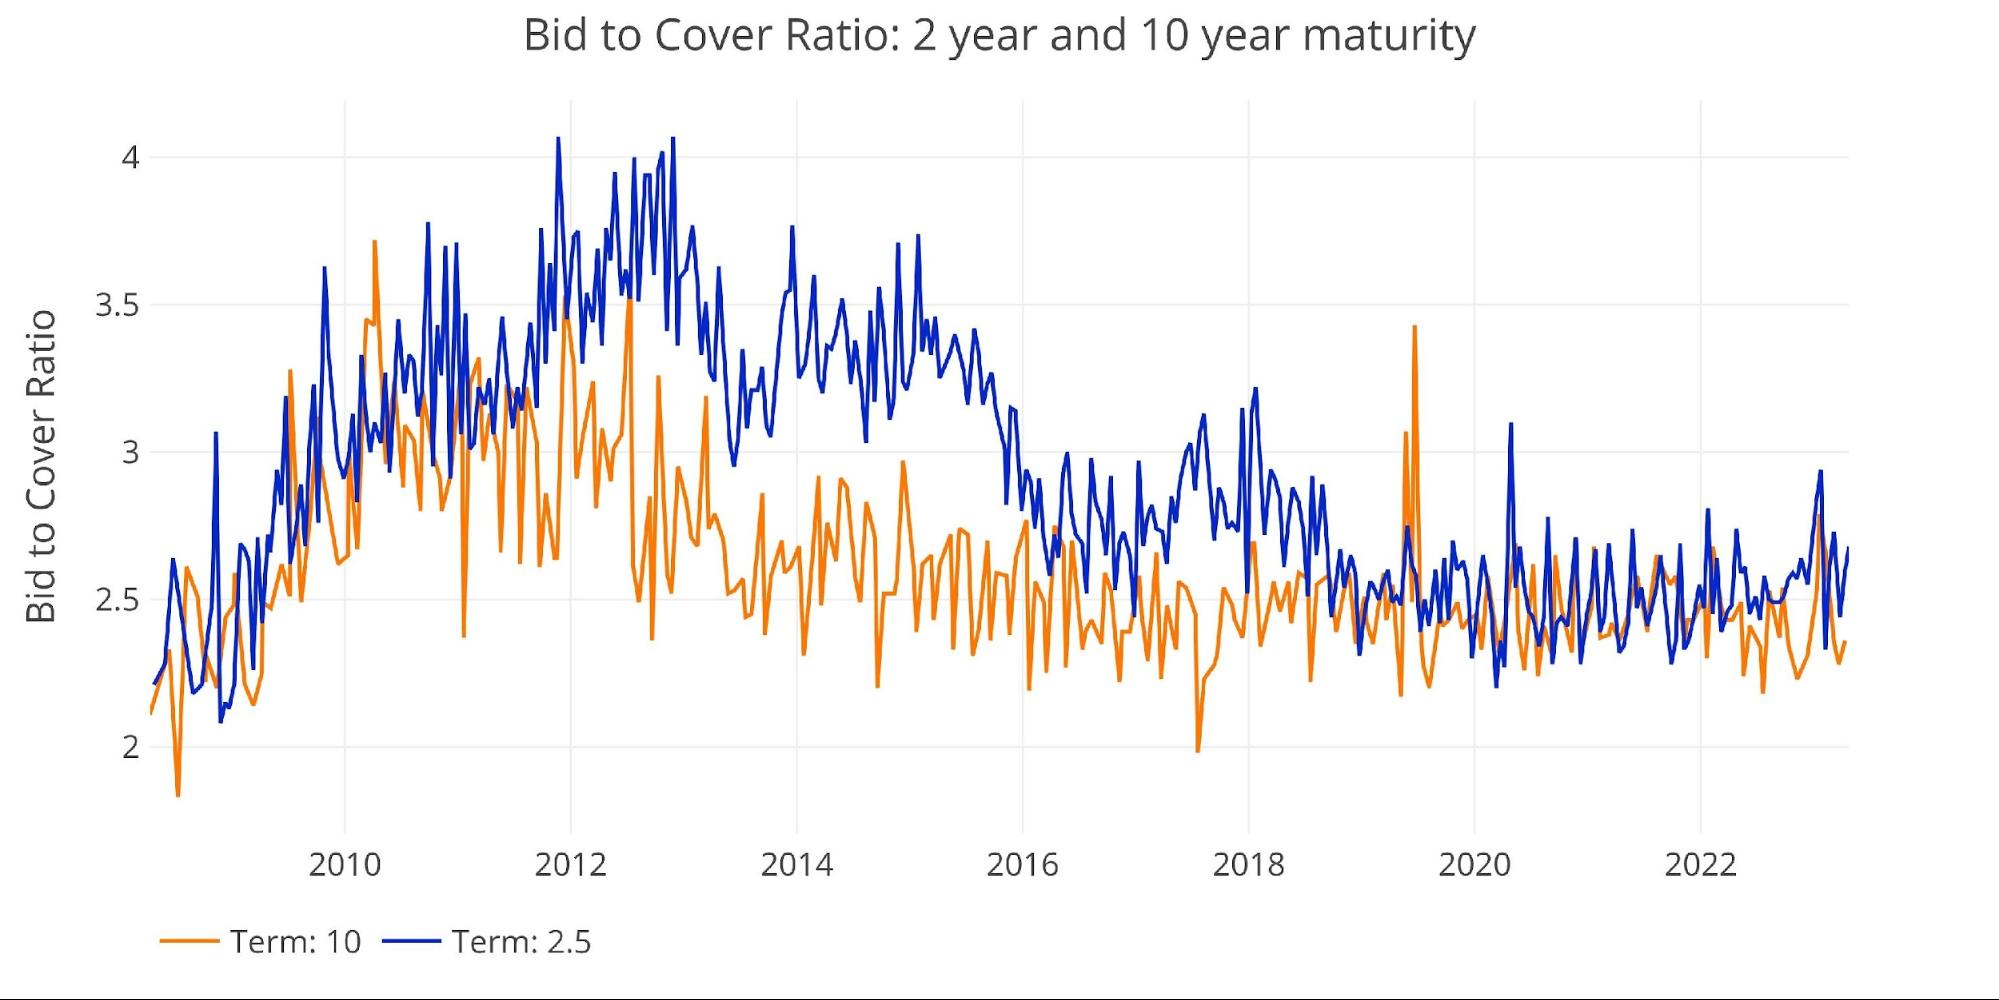
Figure: 11 2 year and 10 year bid to cover
Historical Perspective
While total debt now exceeds $31T, not all of it poses a risk to the Treasury. There is $7.1T+ of Non-Marketable securities which are debt instruments that cannot be resold and the government typically owes itself (e.g., Social Security), or to government employees in the form of pensions.
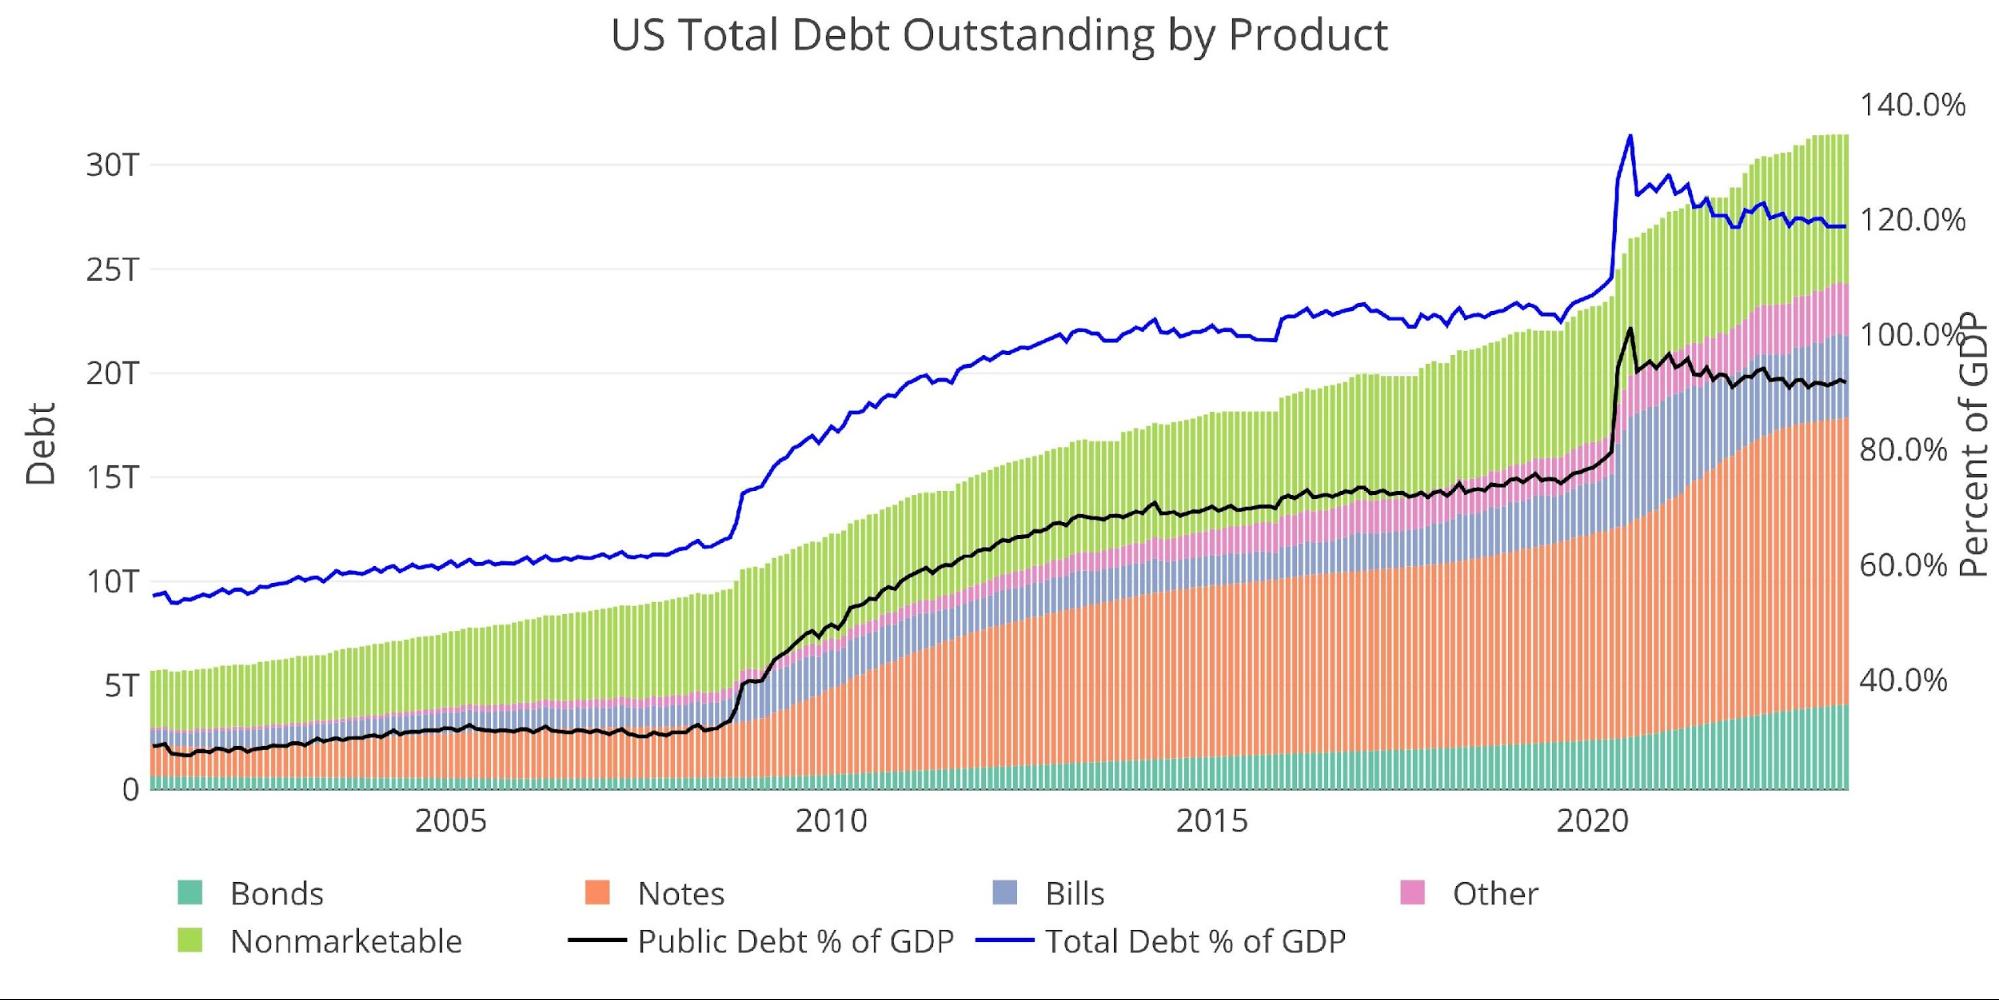
Figure: 12 Total Debt Outstanding
Unfortunately, the reprieve offered by Non-Marketable securities has been fairly limited in recent years, as the Treasury has been forced to rely more heavily on private markets. This has made Non-Marketable fall from over 50% of the debt to less than 23% of total debt outstanding.
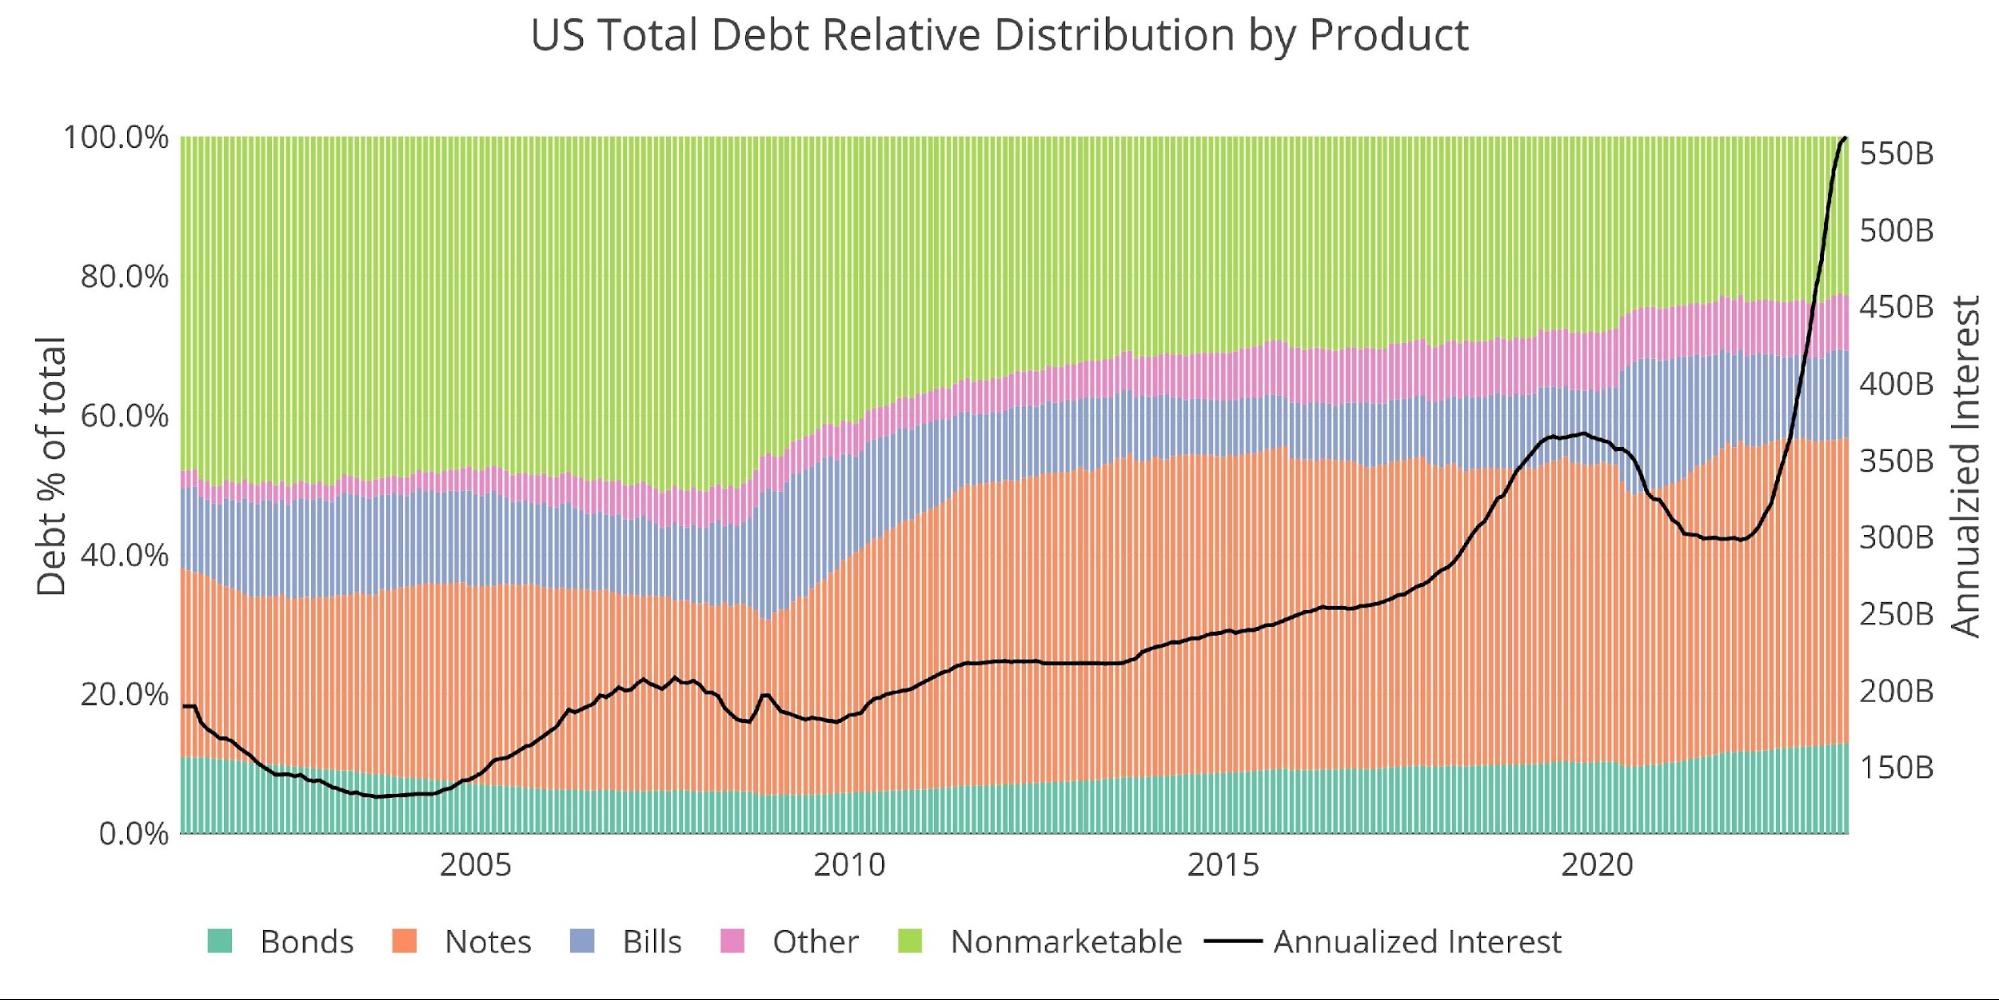
Figure: 13 Total Debt Outstanding
Historical Debt Issuance Analysis
The table below breaks down the trends shown above with specific numbers.
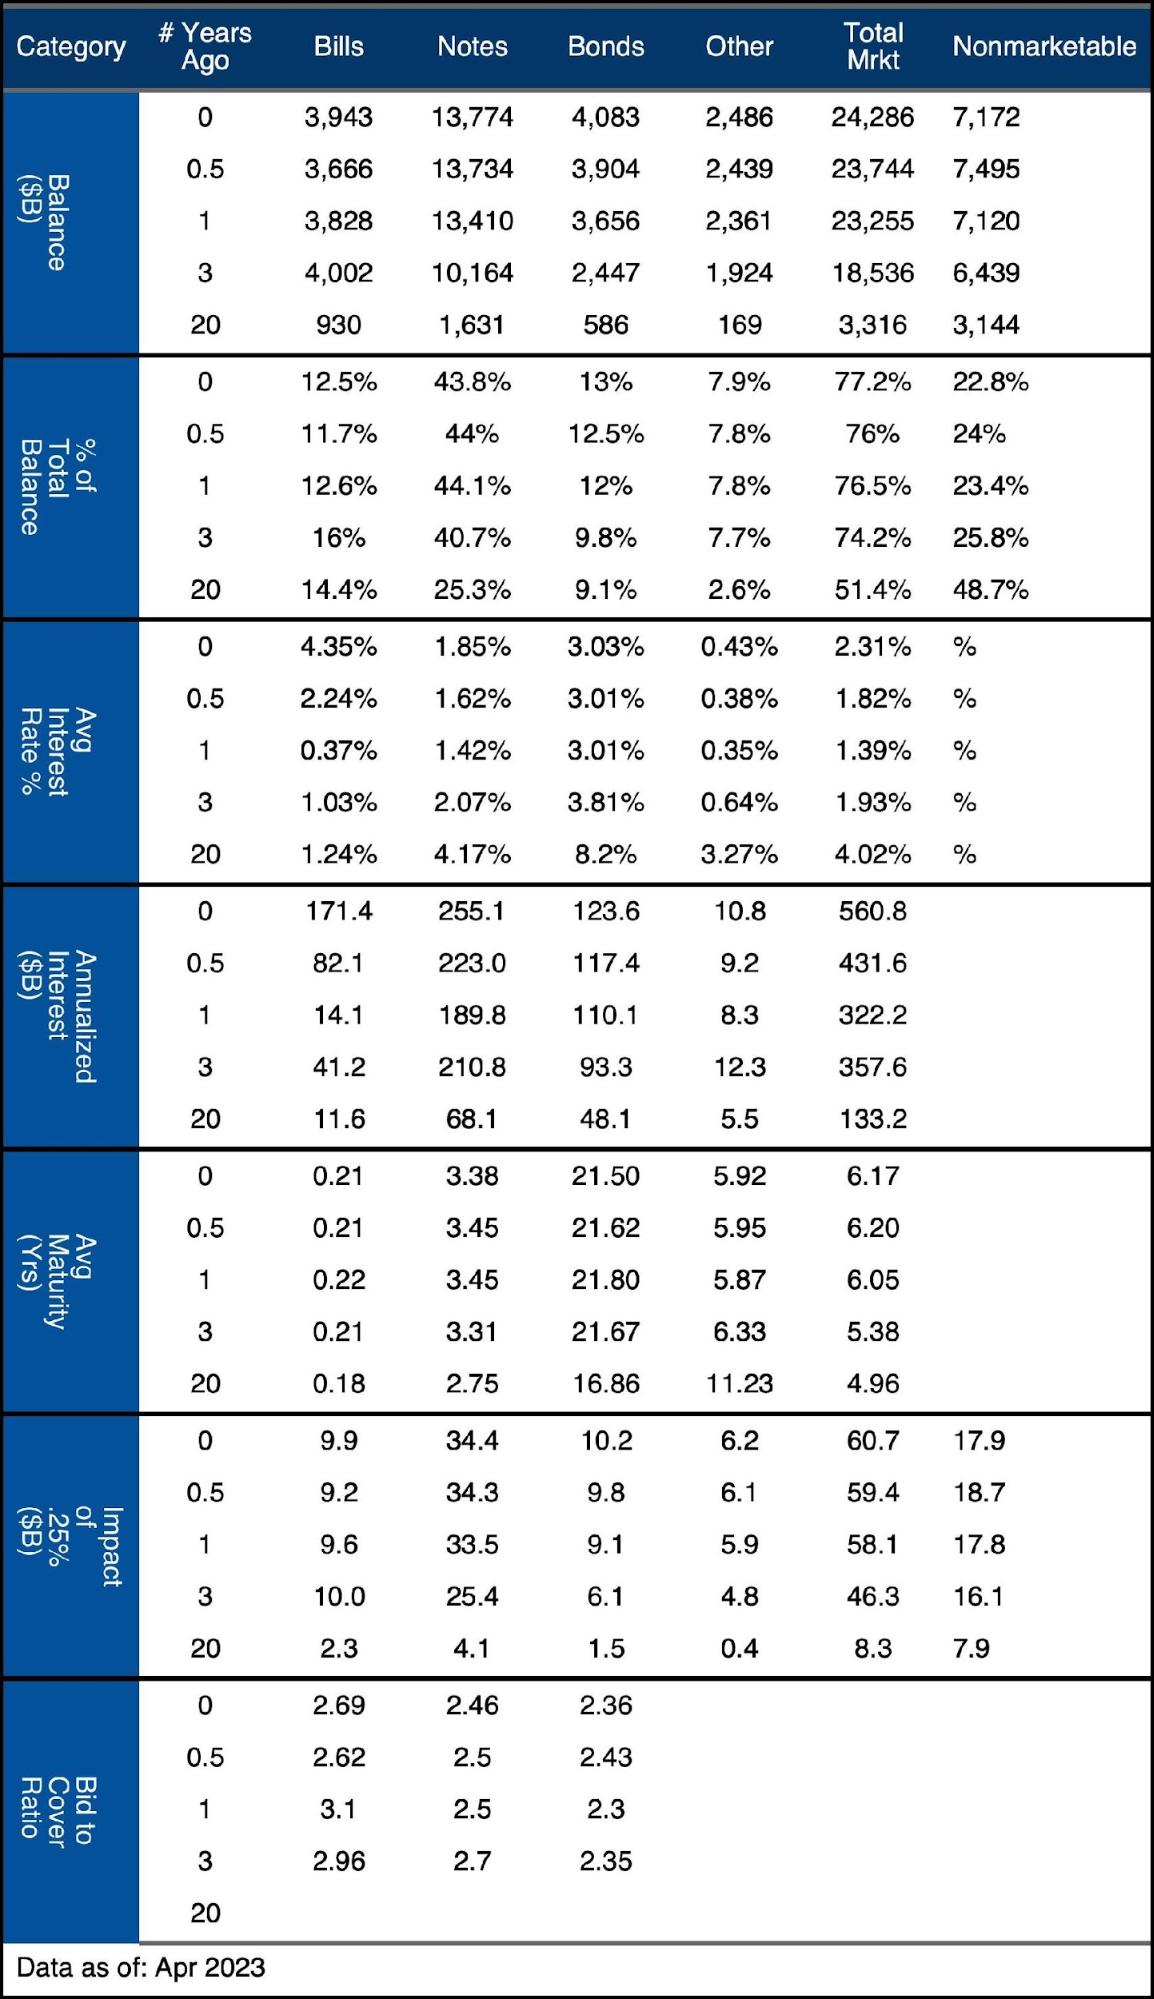
Figure: 14 Debt Details over 20 years
It can take time to digest all the data above. Below are some main takeaways:
-
- Annualized interest has surged by over $150B on Bills in the last year and $65B on Notes
-
- Considering the balance on Notes is more than 3 times the size, this means the impact on Notes has barely begun
-
- The average interest on Notes is only 1.85%, up from 1.42% a year ago
-
- This is less than half of the yield currently on Notes across the yield curve
-
- Every 25bps increase on Notes will have a fully loaded effect of $34B increased interest expense
-
- This means if average interest on Notes reached 3.8%, then that would translate to an additional $272B of interest expense per year
-
- Annualized interest has surged by over $150B on Bills in the last year and $65B on Notes
Wrapping Up
The Fed continues to surprise markets with its hawkish talk. They seem to be the only ones without a working calculator. Powell has certainly gone further than I anticipated. I would have expected a pivot much sooner, but that’s also because I am doing the math and could see the freight train coming. Well, that freight train is here and Powell still has his head in the sand.
The Treasury cannot afford $550B in interest expense, much less $700B or $800B. This is why the Fed will have to fold. Because if the Treasury cannot afford those higher rates, you can bet that most private companies cannot either. As the rest of the economy rolls over its debt, the impact on the Treasury will look modest by comparison.
This is not to even mention the issue that arises from falling bond values. This is what has blown up the regional banks. Make no mistake, this is the start of the crisis… not the end.
Data Source: https://www.treasurydirect.gov/govt/reports/pd/mspd/mspd.htm
Data Updated: Monthly on fourth business day
Last Updated: Apr 2023
US Debt interactive charts and graphs can always be found on the Exploring Finance dashboard: https://exploringfinance.shinyapps.io/USDebt/

Call 1-888-GOLD-160 and speak with a Precious Metals Specialist today!
Buka akaun dagangan patuh syariah anda di Weltrade.
Source link