Breaking Down the Balance Sheet
The Fed has finally met (and exceeded) its targeted $47.5B a month balance sheet reduction. To be fair, they had a full 5 weeks to pull off the reduction since the Thursday updates are as of the day before (in this case Aug 31). As of last week, they were still short of the target at only $39B. Furthermore, MBS was still seeing an increase as of last week.
As August closed, the balance sheet shrunk by $64B, but only reduced MBS by $8B (less than half the target). In the two prior months, MBS had increased by nearly $10B. This means that over the last three months, where MBS was supposed to shrink by $52.5B, MBS actually increased by about $1.8B. Could this have anything to do with the tanking housing market as the 30-year fixed rate rapidly approaches 6%?
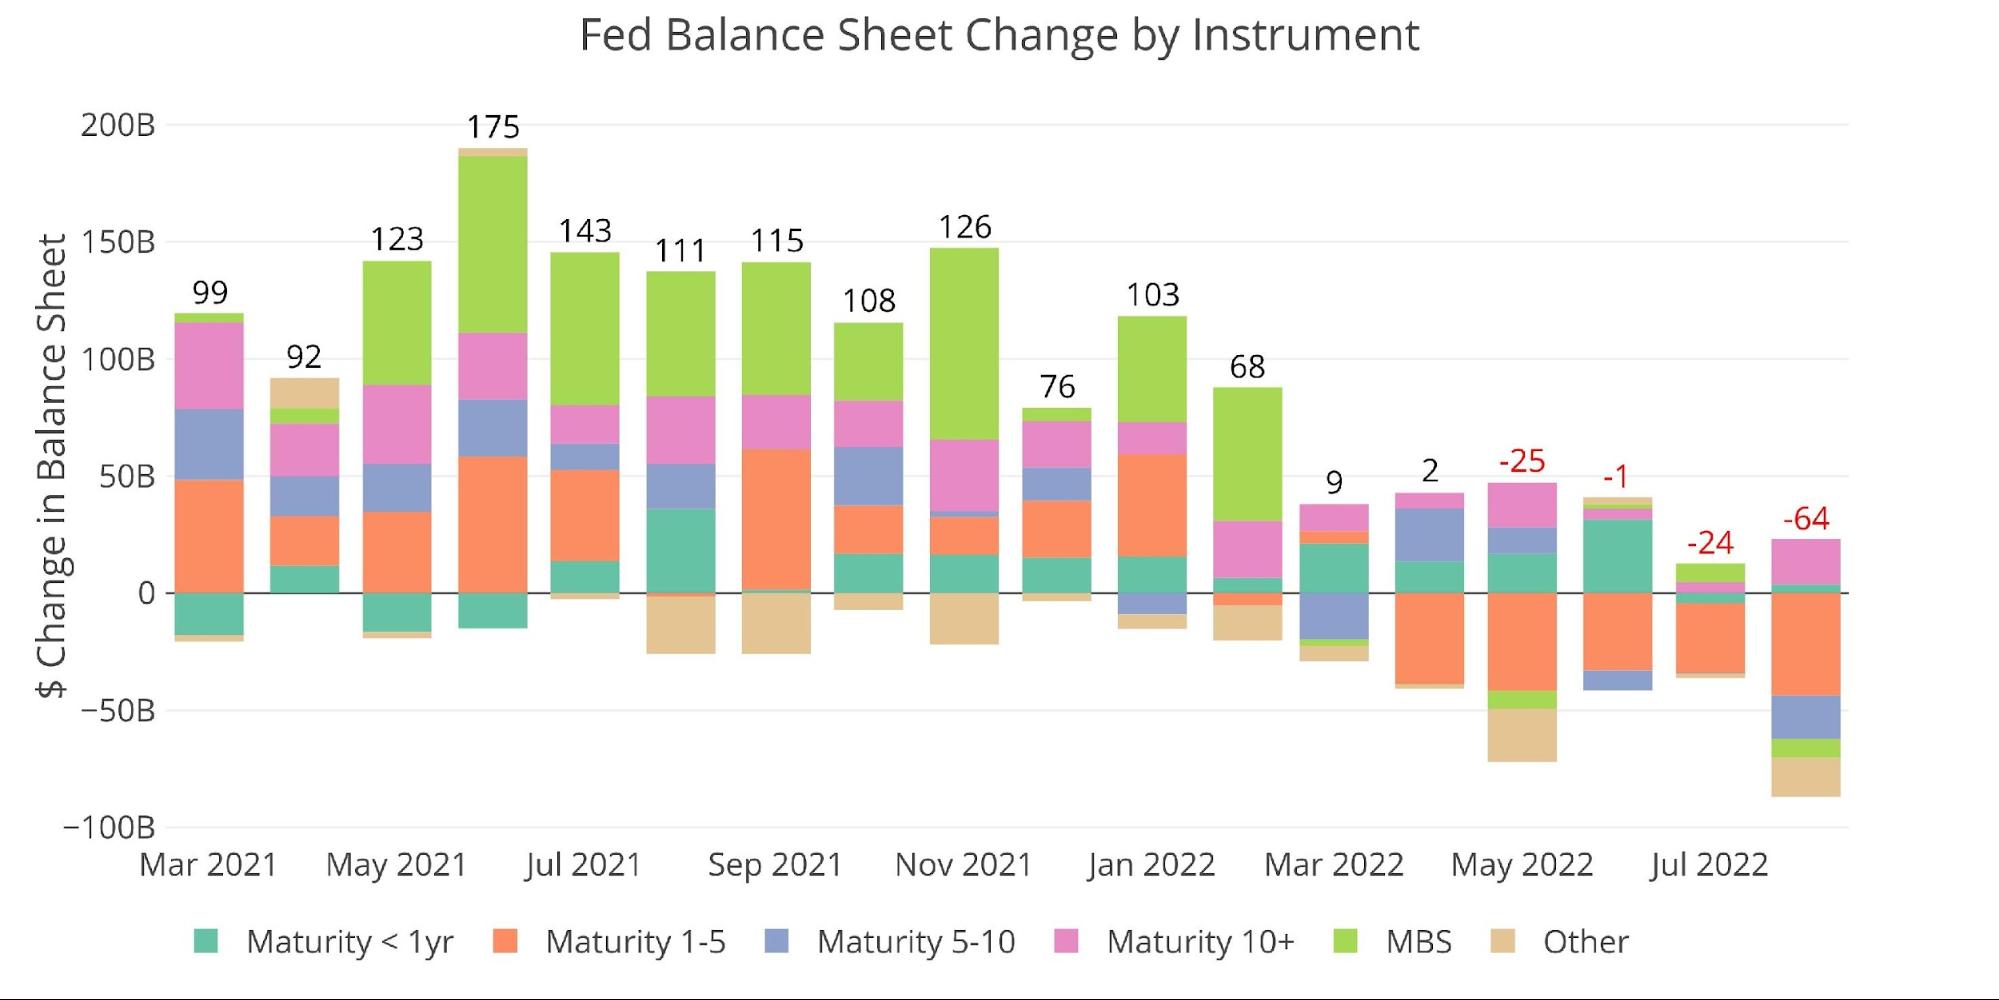
Figure: 1 Monthly Change by Instrument
The table below details the movement for the month:
-
- The Fed reduced MBS during August by $8.1B, entirely due to the activity in the latest week
- The majority of the reduction came from a $43.7B reduction in 1–5-year maturities
-
- This is the largest holding of Treasuries on the balance sheet so it’s not very surprising it sees the biggest reduction
-
- It’s surprising to see increases in <1yr maturities as this requires active purchases against Bills that mature

Figure: 2 Balance Sheet Breakdown
Looking at the weekly data shows that activity has finally started to pick up in the last three weeks. The Fed is clearly swapping out shorter-dated maturity (1-10yr) with bonds that mature in more than 10 years. The chart also shows the MBS drop in the most recent week as highlighted above. This is the largest drop since June 29th.

Figure: 3 Fed Balance Sheet Weekly Changes
The Fed has clearly defended the mortgage market over the last year. As the chart below shows, MBS has increased as a percentage of the balance sheet from 29.2% to 30.7%. This means MBS is increasing relative to other debt. Bonds have also increased over the last year, rising from 15.2% to 16.5%.
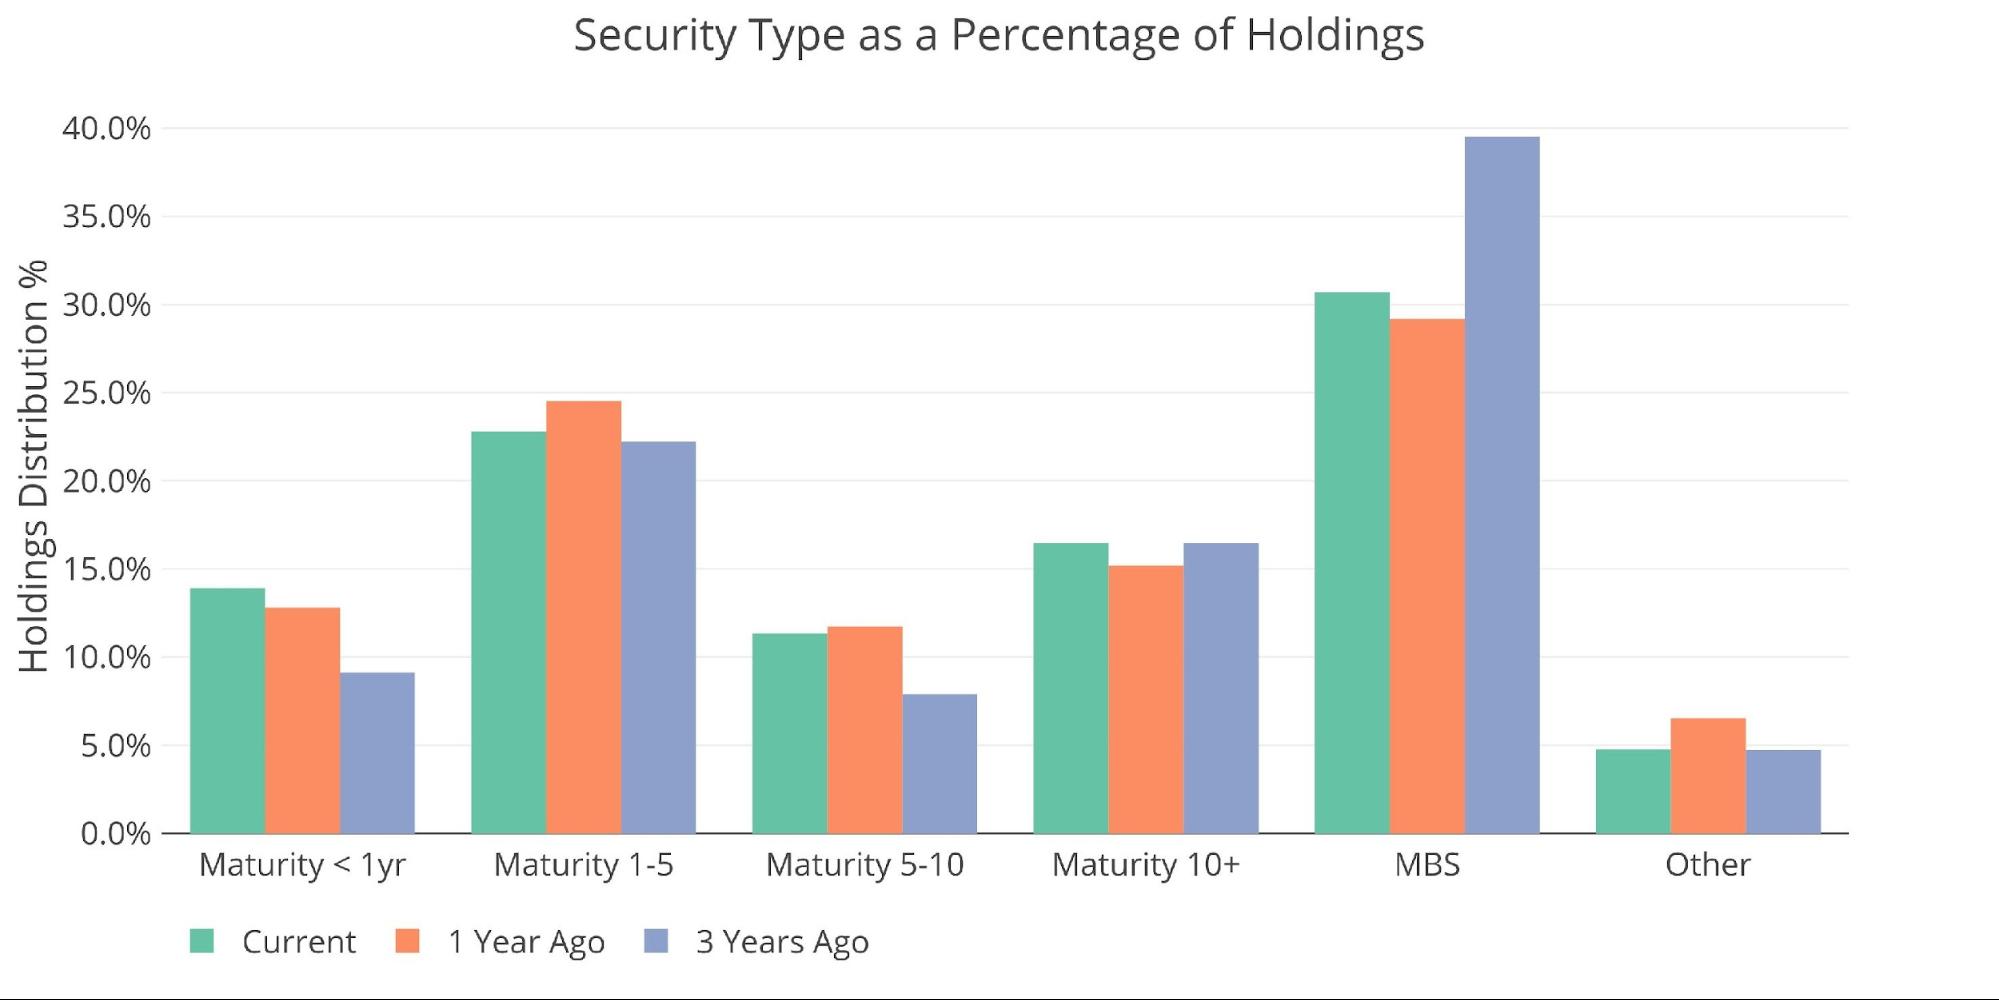
Figure: 4 Total Debt Outstanding
The market is front-running the moves by the Fed, driving up interest rates. Not only is the yield curve more congested than even October 2018, but interest rates are the highest since October 2014.

Figure: 5 Interest Rates Across Maturities
This is showing up in the yield curve which has not been this inverted since August of 2000.
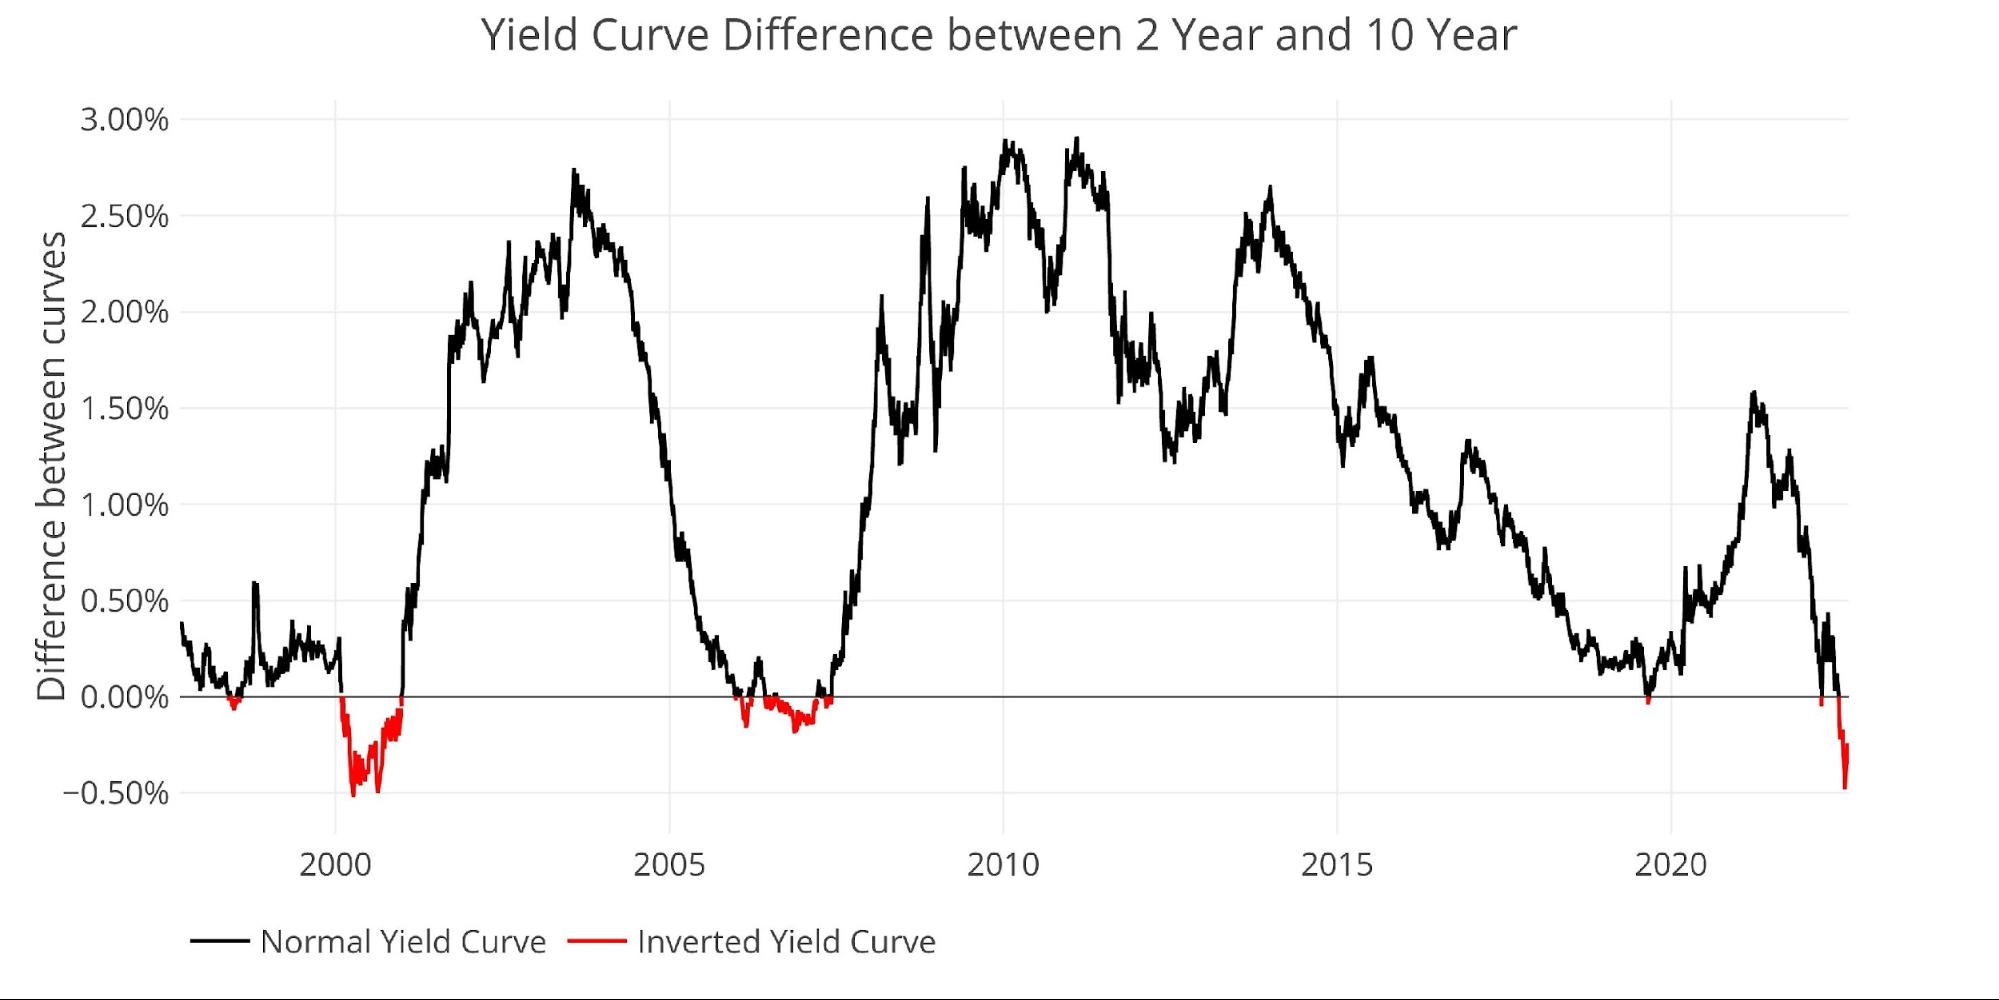
Figure: 6 Tracking Yield Curve Inversion
Looking at the entire yield curve shows how much has changed over the last month and year. The entire curve has shifted up in the last month by about 40bps and is well above and flatter than the at the same point last year.
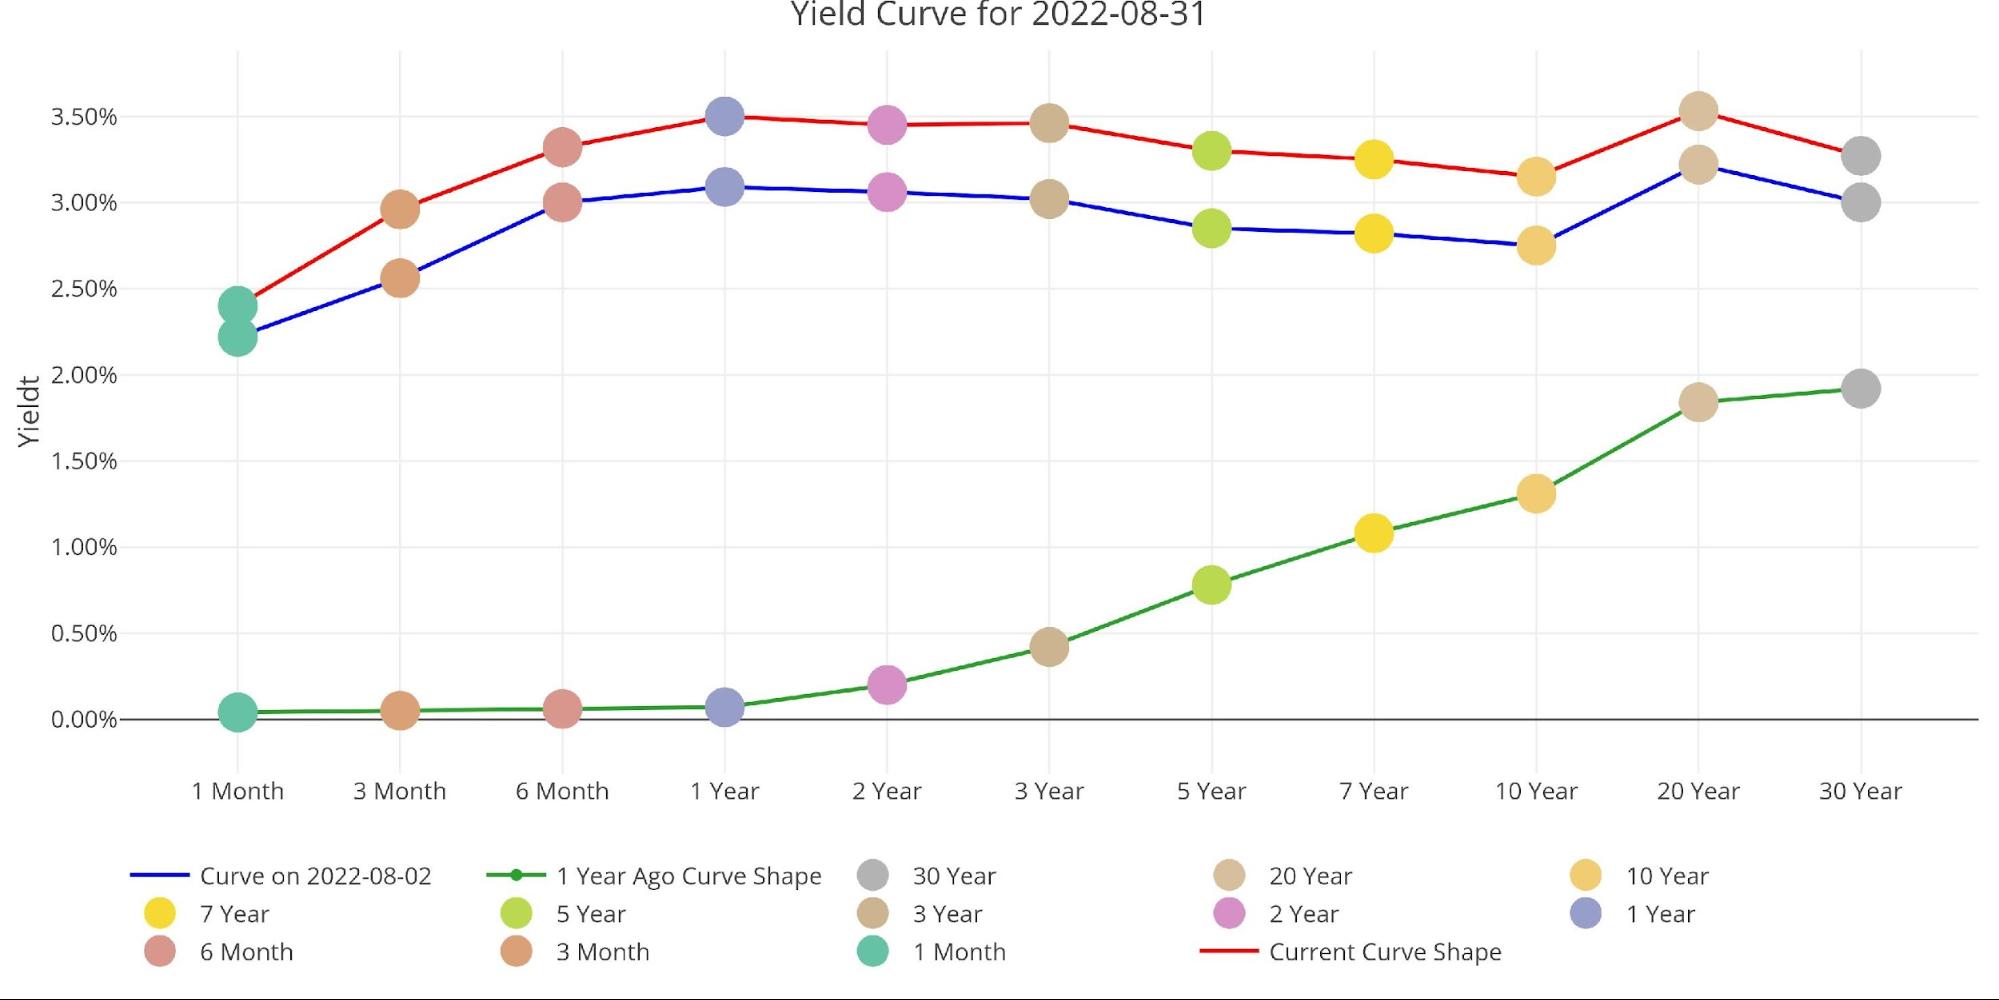
Figure: 7 Tracking Yield Curve Inversion
Who Will Fill the Gap?
As the Fed leaves the market, someone will need to step in and purchase the debt the Fed has been buying. The chart below looks at international holders of Treasury securities. International holdings continue to fall rapidly. Because of the delay in reporting, the impact of the Ukraine war is only now being seen. International holdings are down by more than $400B since it peaked at $7.8T last November.
This is a major development that no one is talking about! International holders are now shedding US Treasuries at the fastest pace since at least 2015! China holdings have dropped to $967B, falling below $1T for the first time in over a decade. China’s holdings have fallen every single month since November 2021.
Note: Data was last published as of June
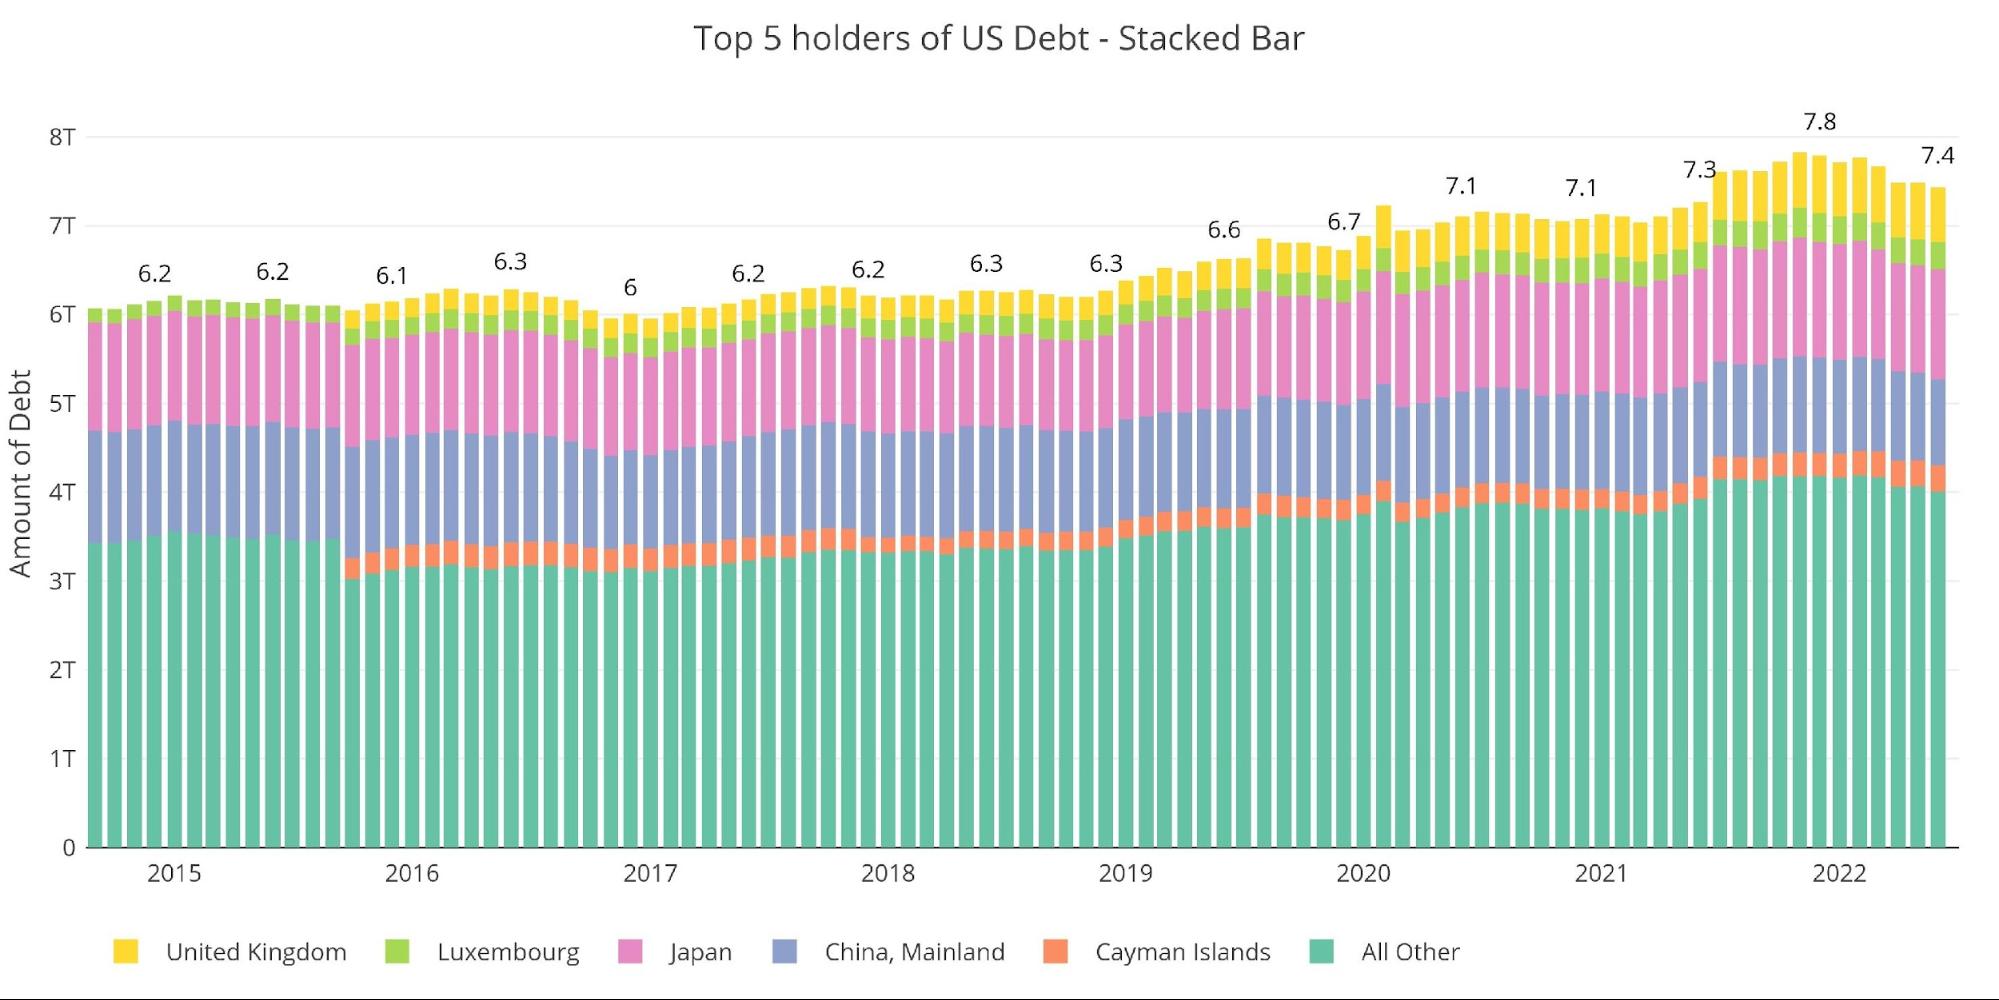
Figure: 8 International Holders
The table below shows how debt holding has changed since 2015 across different borrowers. While the net change is positive over the last year, there are some major countries reducing exposure. As mentioned, China is now below $1T and Japan has shed $40B in the last year alone. Smaller countries are picking up some slack, but it won’t be enough to offset the decrease from the larger holders.
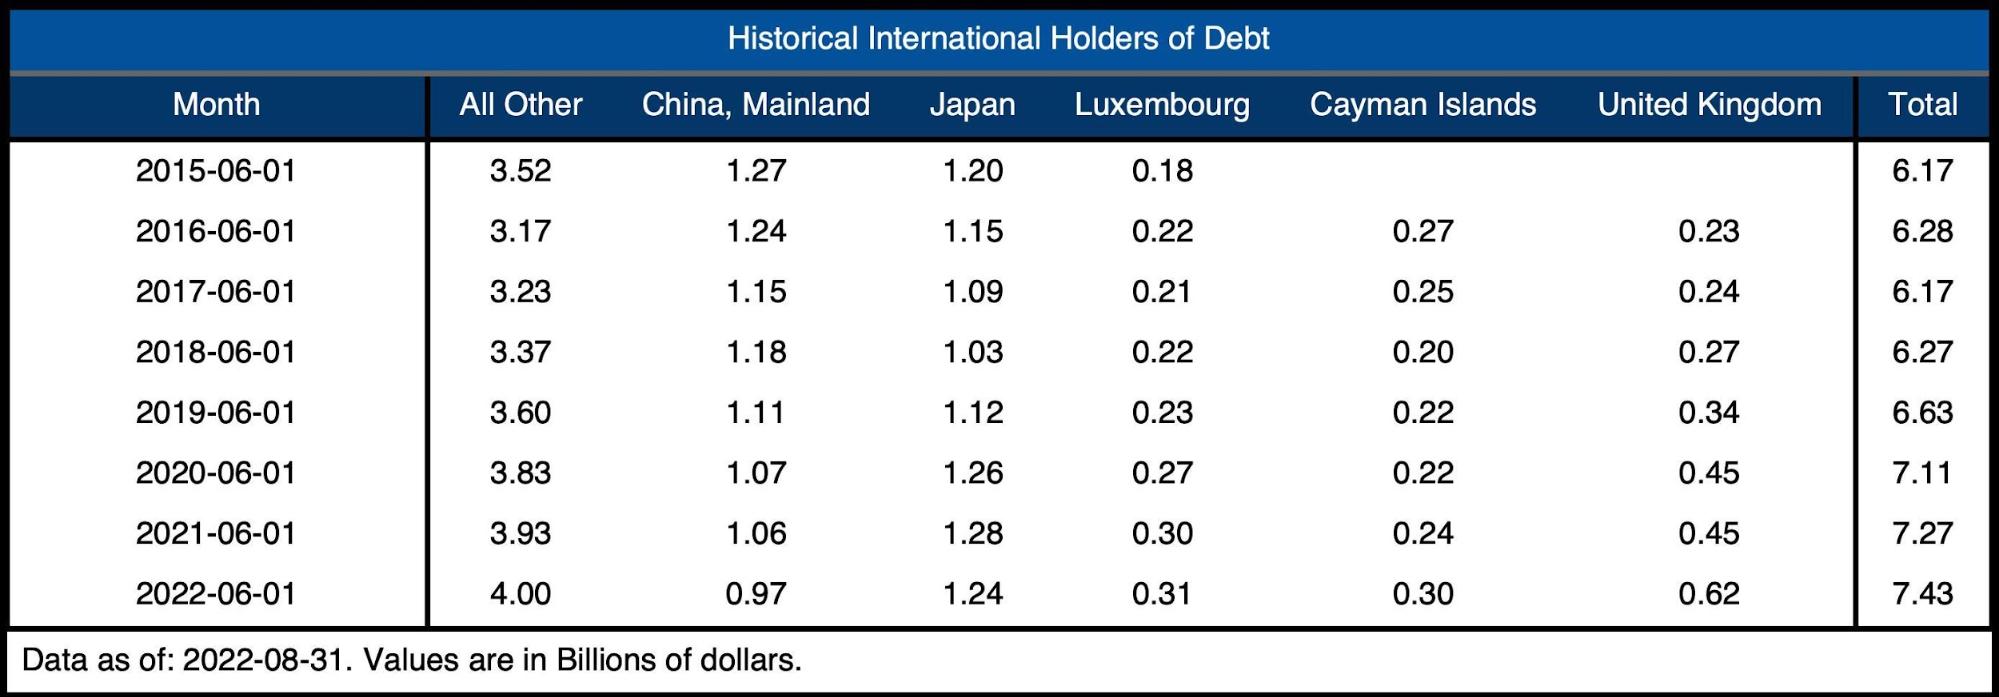
Figure: 9 Average Weekly Change in the Balance Sheet
Historical Perspective
The final plot below takes a larger view of the balance sheet. It is clear to see how the usage of the balance sheet has changed since the Global Financial Crisis. The tapering from 2017-2019 can be seen in the slight dip before the massive surge due to Covid. It’s highly unlikely the new round of QT will last as long or shrink the balance sheet as much as it did in 2018. Furthermore, the current QT pales in comparison to the growth of the balance sheet seen in the latest QE binge.
During the last QT period, the Fed shrunk its balance sheet by ~15%. A similar reduction would be $1.34T. Even after QT hits full speed this month, it would take more than a year. Will the Fed continue QT as the economy flounders in recession and potentially dips into depression territory?
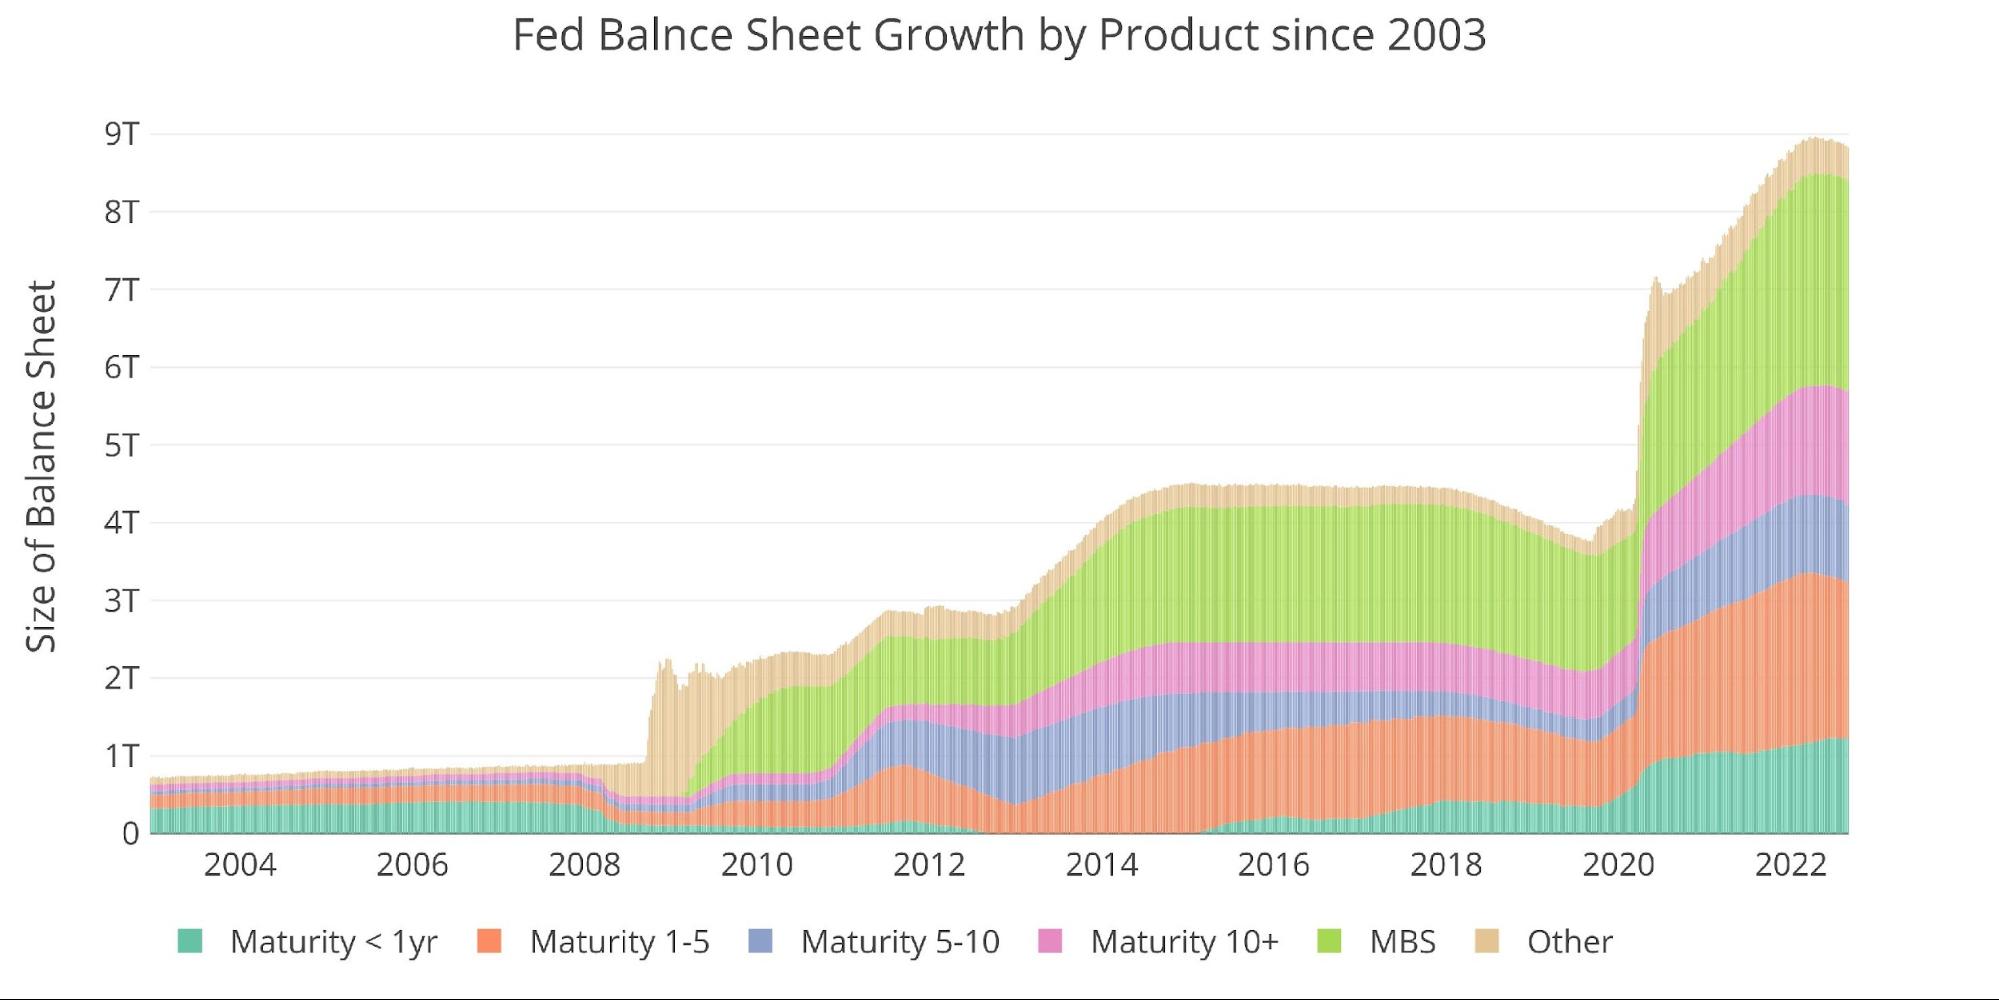
Figure: 10 Historical Fed Balance Sheet
What it means for Gold and Silver
The Fed is sticking to a hawkish tone. At Jackson Hole, Powell left no doubt that they are committed to fighting inflation. Despite the tough talk, there are still two very pertinent questions to be considered:
- If the Fed is so committed to fighting inflation, why are rates still below the rate of inflation? In all past inflation battles, the Fed raises rates above the rate of inflation.
- The market is already starting to buckle from the higher rates, will the Fed really continue to raise rates? This will clearly lead to a debt spiral for the US Treasury.
Based on current inflation, the Fed is moving far too slowly. However, based on the over-leveraged economy that is incredibly dependent on cheap money, the Fed is moving incredibly fast. They are moving so fast that they will unlikely realize the damage they have inflicted until it is way too late.
The actions of the Fed will bring destruction across the economy that will be felt too late for the Fed to do anything. Things could get very ugly in the months ahead, perhaps even bringing down the price of precious metals in the short-term. However, when the dust settles, gold and silver will offer the best insurance policy against the current economic backdrop.
Data Source: https://fred.stlouisfed.org/series/WALCL and https://fred.stlouisfed.org/release/tables?rid=20&eid=840849#snid=840941
Data Updated: Weekly, Thursday at 4:30 PM Eastern
Last Updated: Aug 31, 2022
Interactive charts and graphs can always be found on the Exploring Finance dashboard: https://exploringfinance.shinyapps.io/USDebt/

Call 1-888-GOLD-160 and speak with a Precious Metals Specialist today!
Buka akaun dagangan patuh syariah anda di Weltrade.
Source link