
Gold is wrapping up May which has slightly exceeded the last minor month in March.
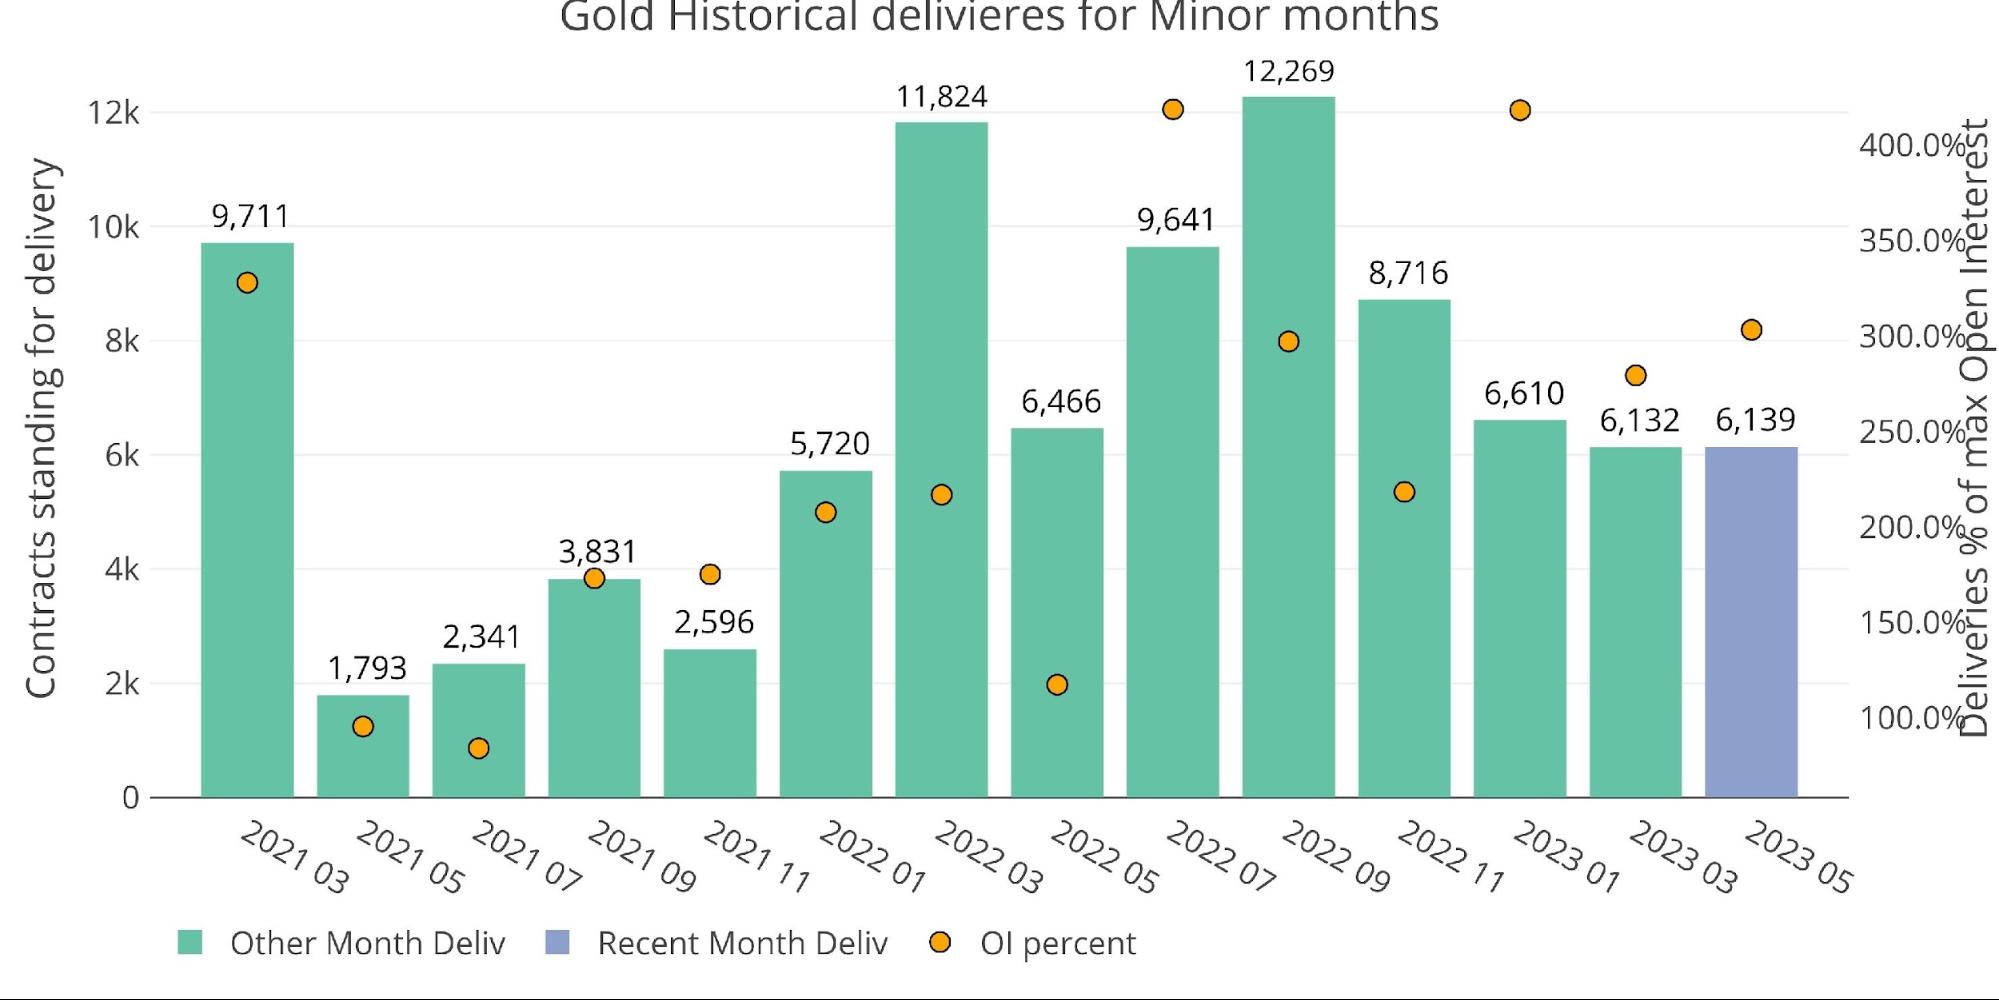
Figure: 1 Recent like-month delivery volume
Delivery volume has stayed robust on the back of more contracts opening mid-month for immediate delivery. Net new contracts exceeded 5k this month.
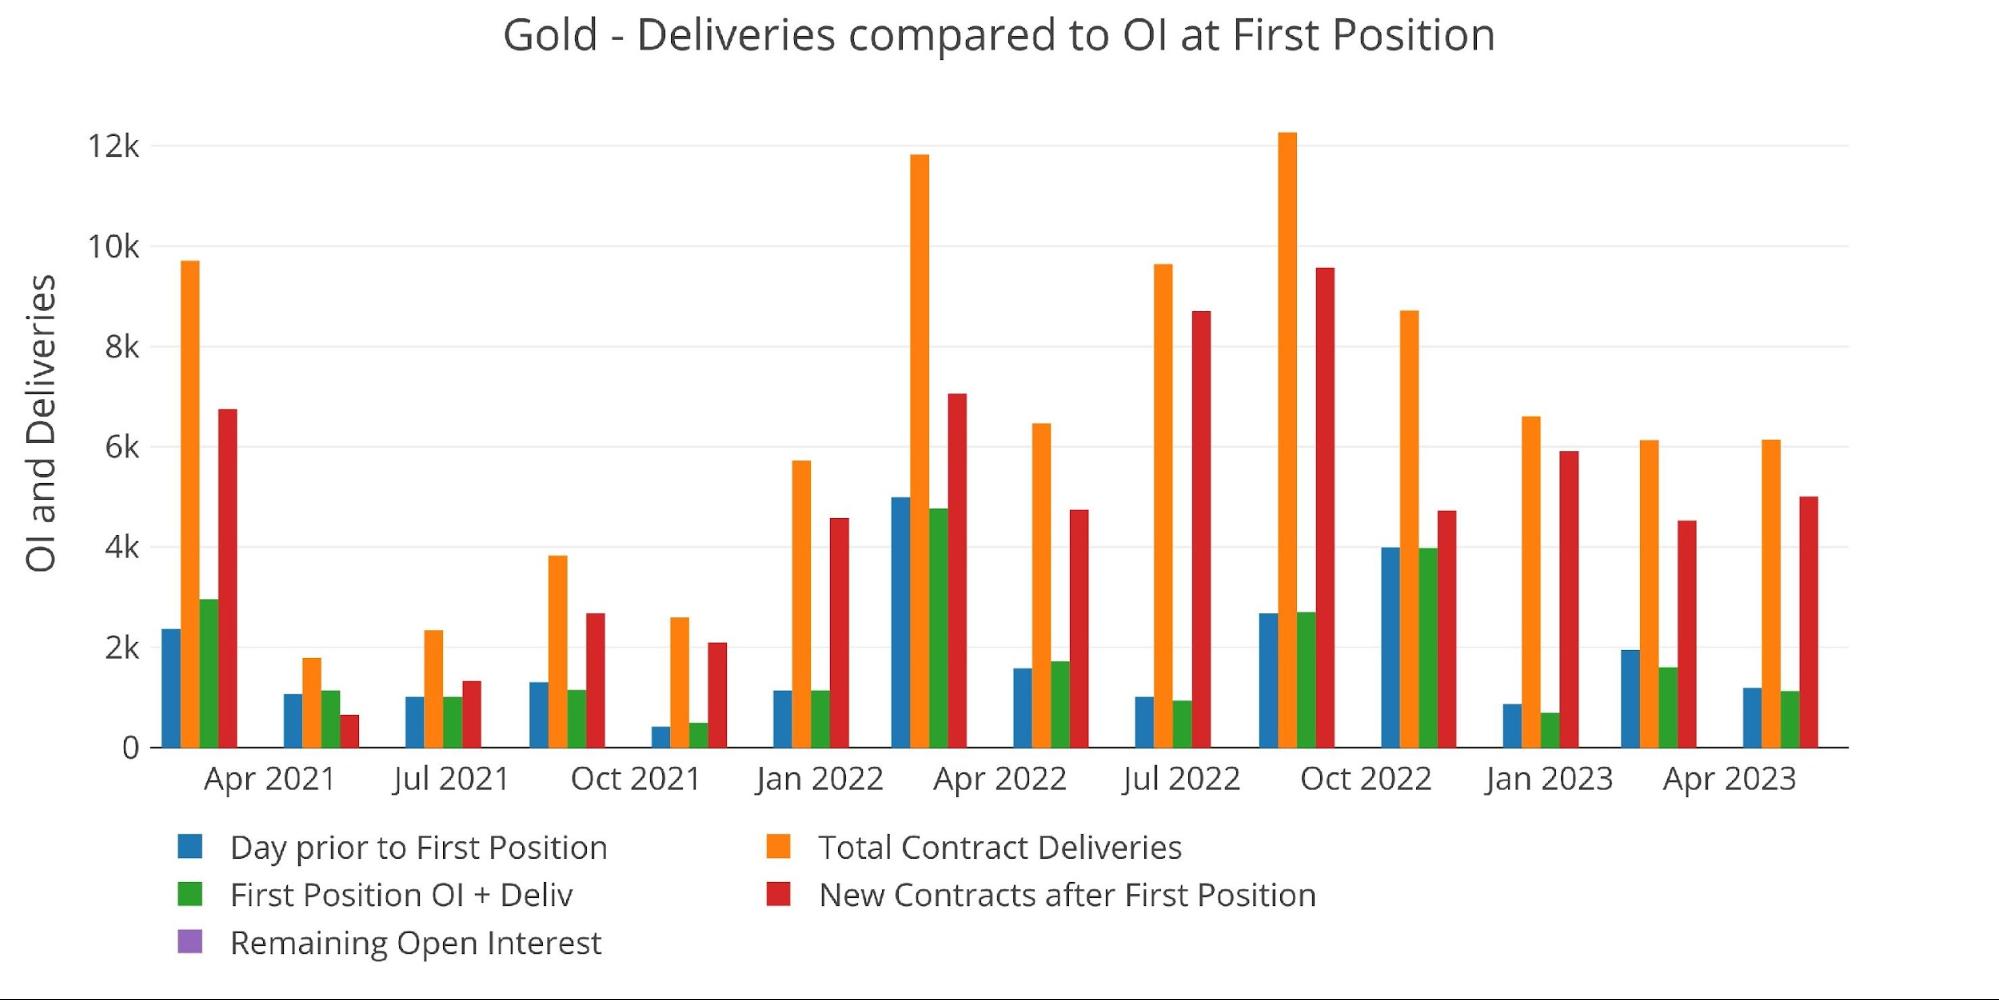
Figure: 2 24-month delivery and first notice
Interestingly, the month started as the strongest month on record before leveling off about 5 days after First Notice.
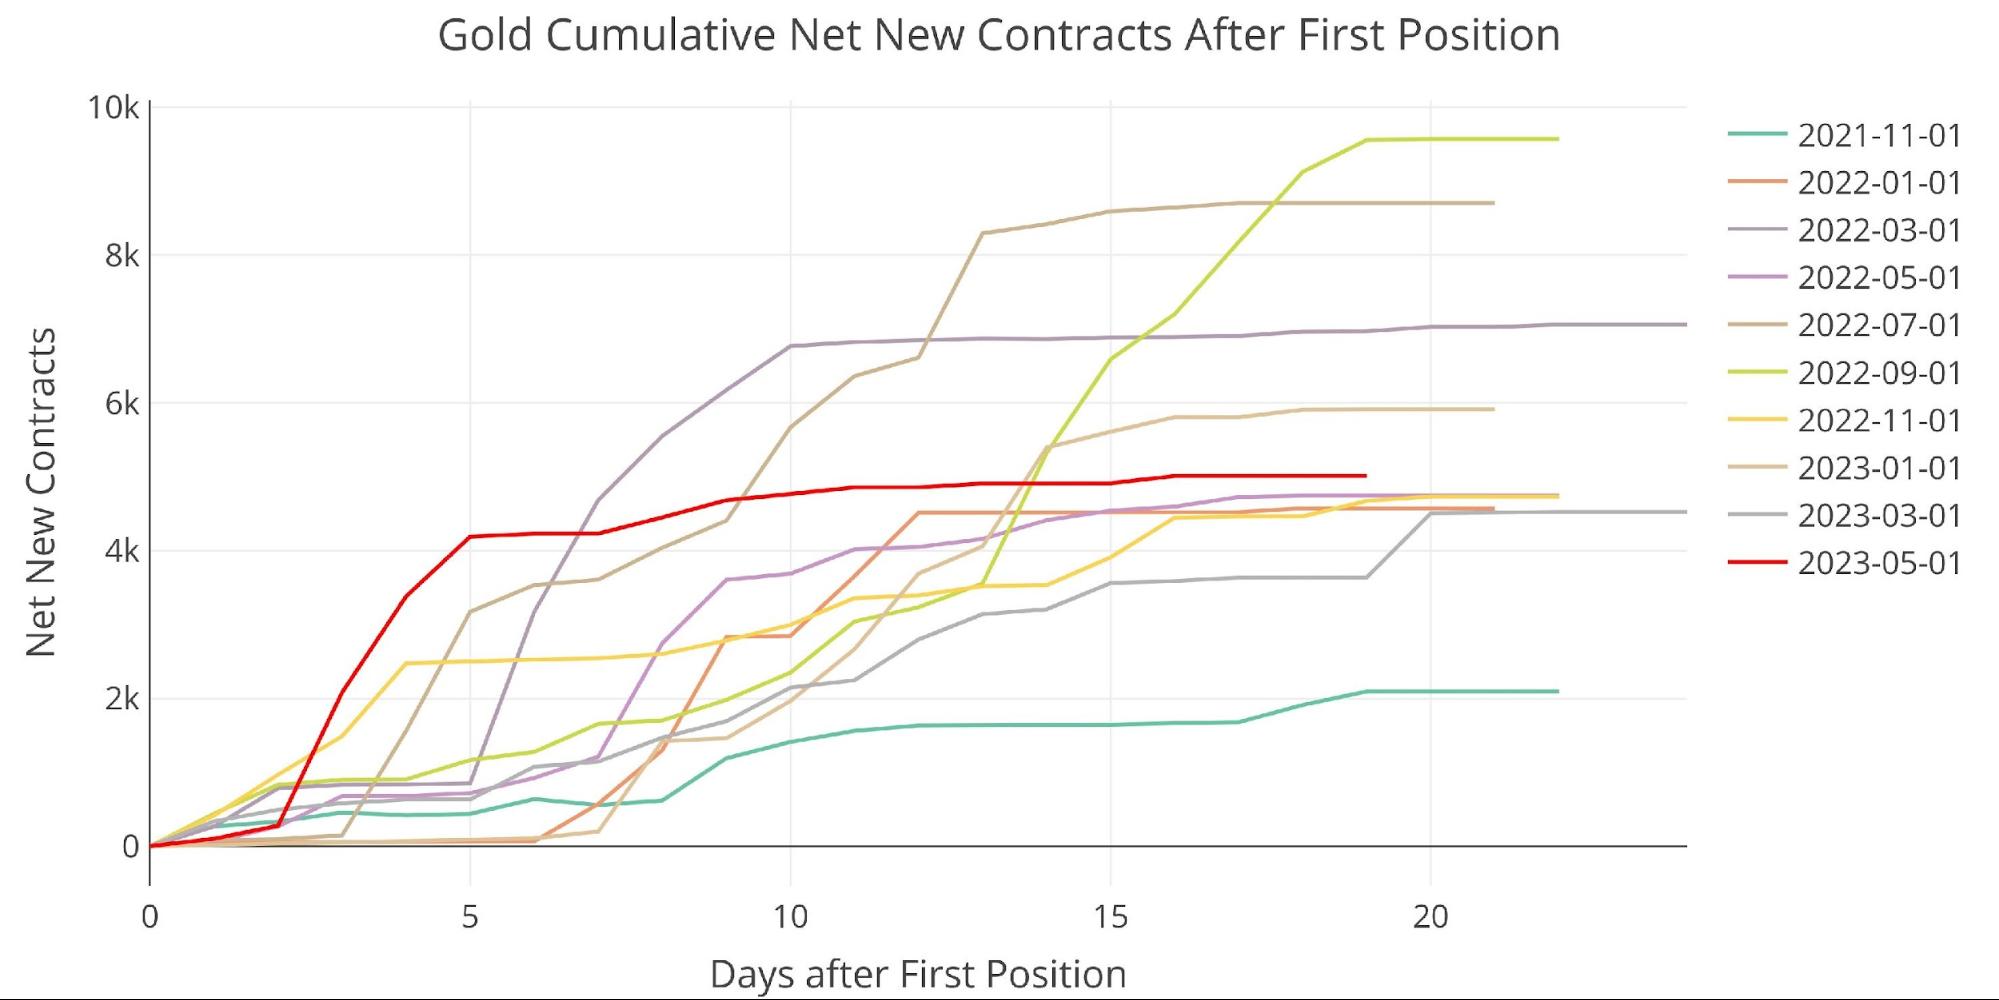
Figure: 3 Cumulative Net New Contracts
From a notional perspective, $1.2B of gold was delivered during May. This is the second largest May on record, trailing only May 2020 during the storm of the pandemic.
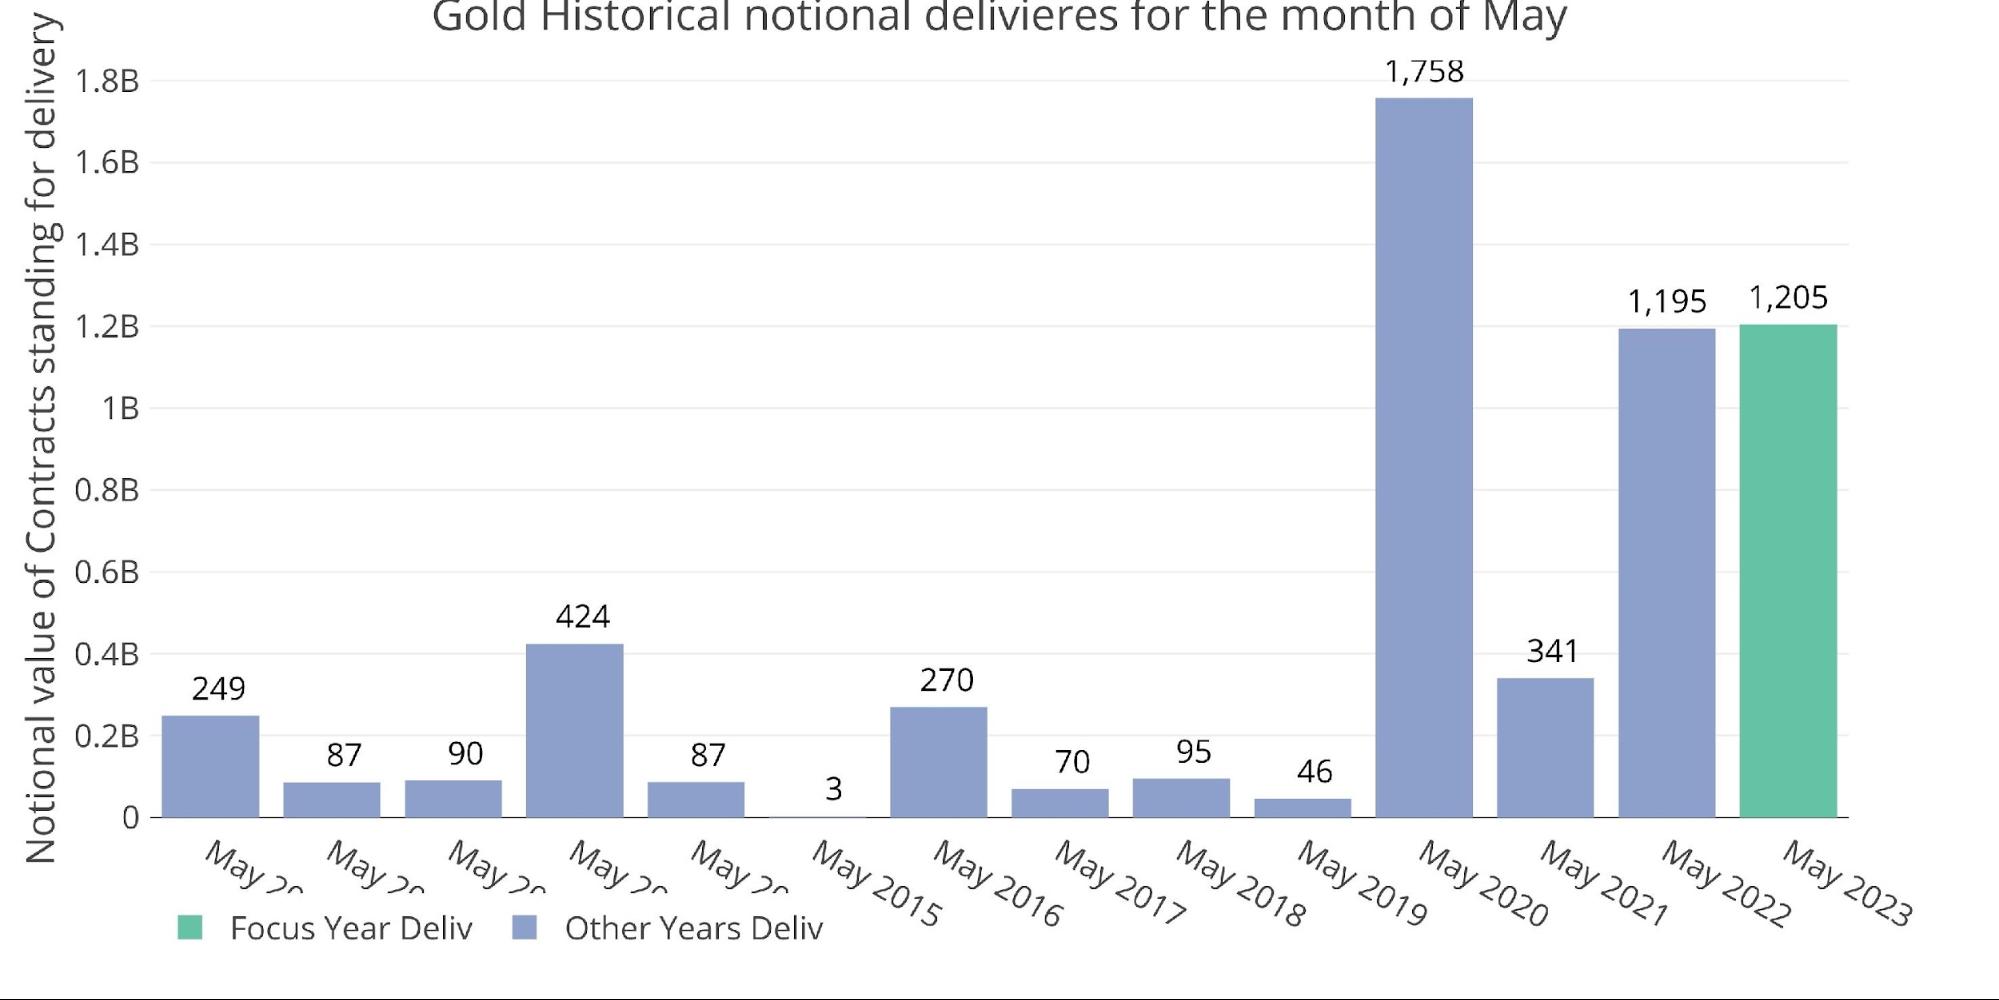
Figure: 4 Notional Deliveries
For the sixth month in a row, BofA was a big buyer. They scooped up 2k contracts while the rest of the other house accounts shed a combined 2,433 contracts. It certainly looks like BofA is preparing to backstop the market when needed.
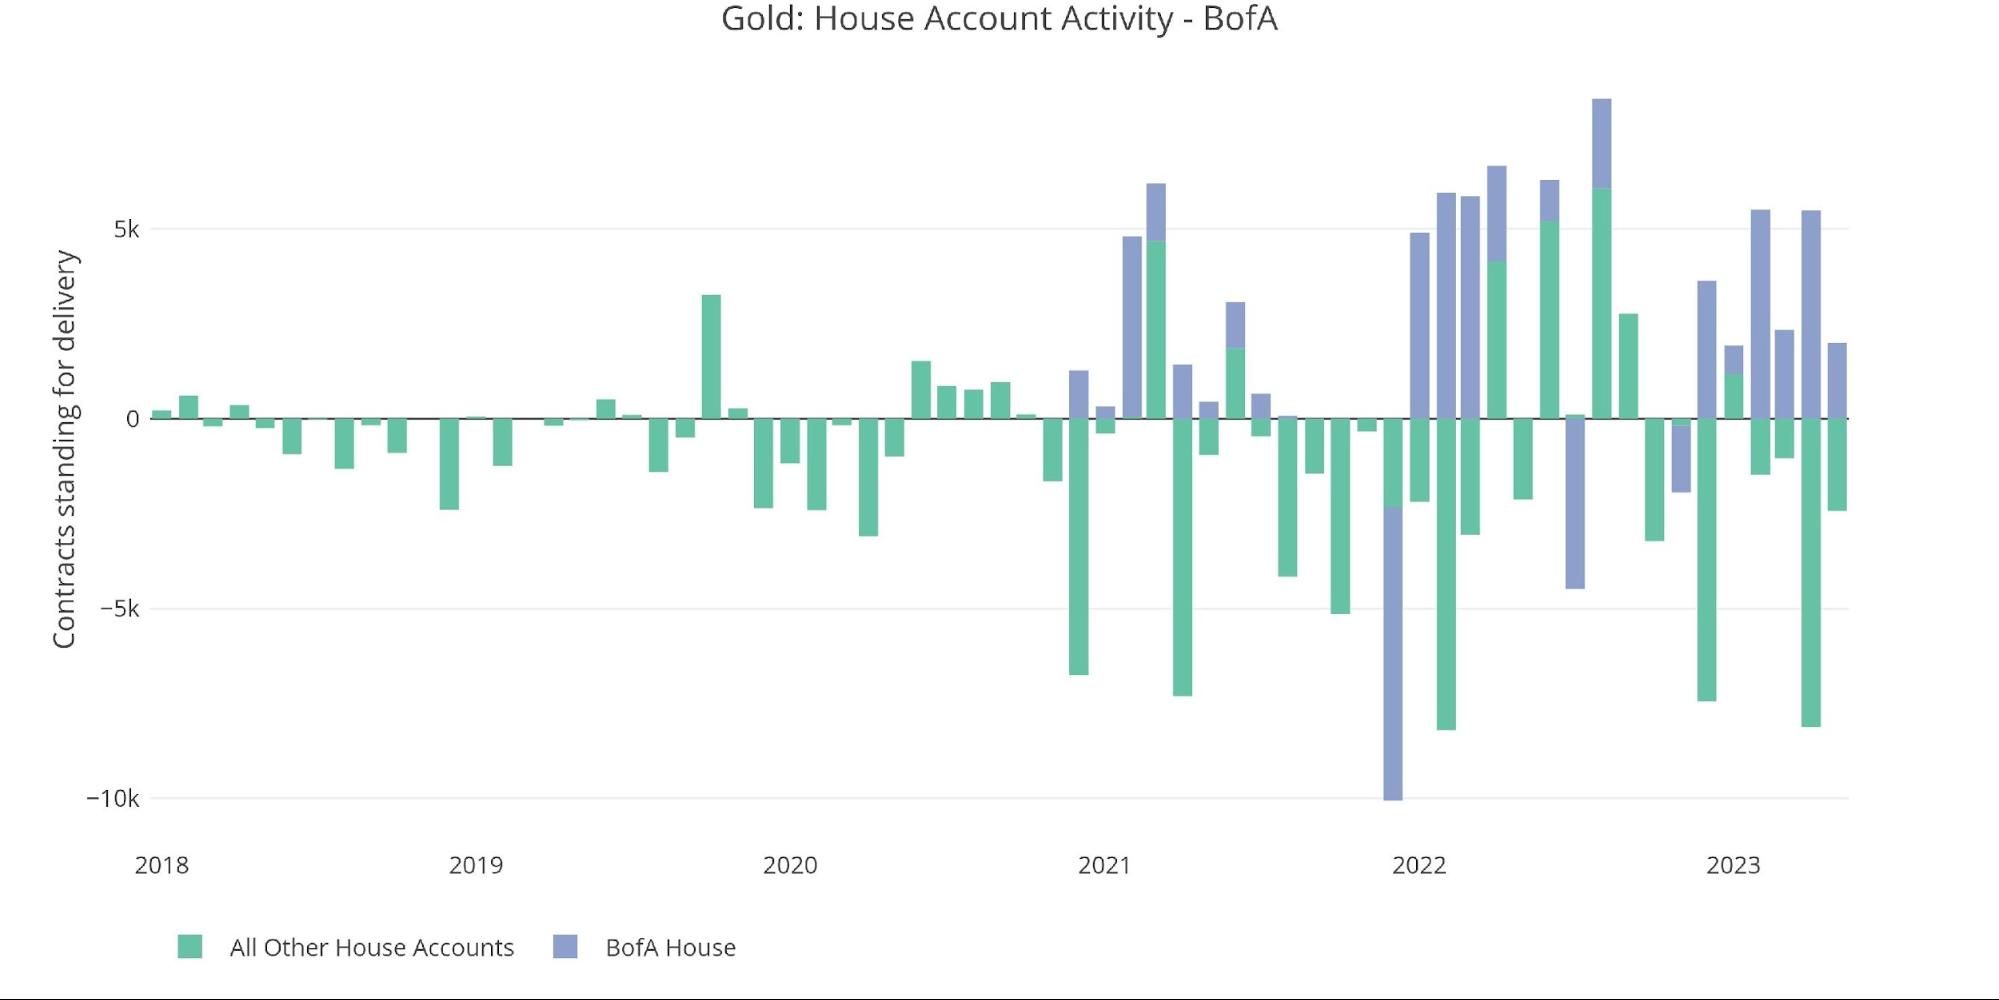
Figure: 5 House Account Activity
The vaults continue to display erratic activity as reported in the vault activity analysis. Back in March, JP Morgan moved a massive tranche of metal from Eligible to Registered. They then went on to replace their Eligible inventory with new metal from the outside. The latest report shows a big move (471k ounces) back into Eligible from Registered. It’s possible this metal changed ownership while in Registered and could be on its way out of the vault. The next couple of weeks should give insight into this theory.
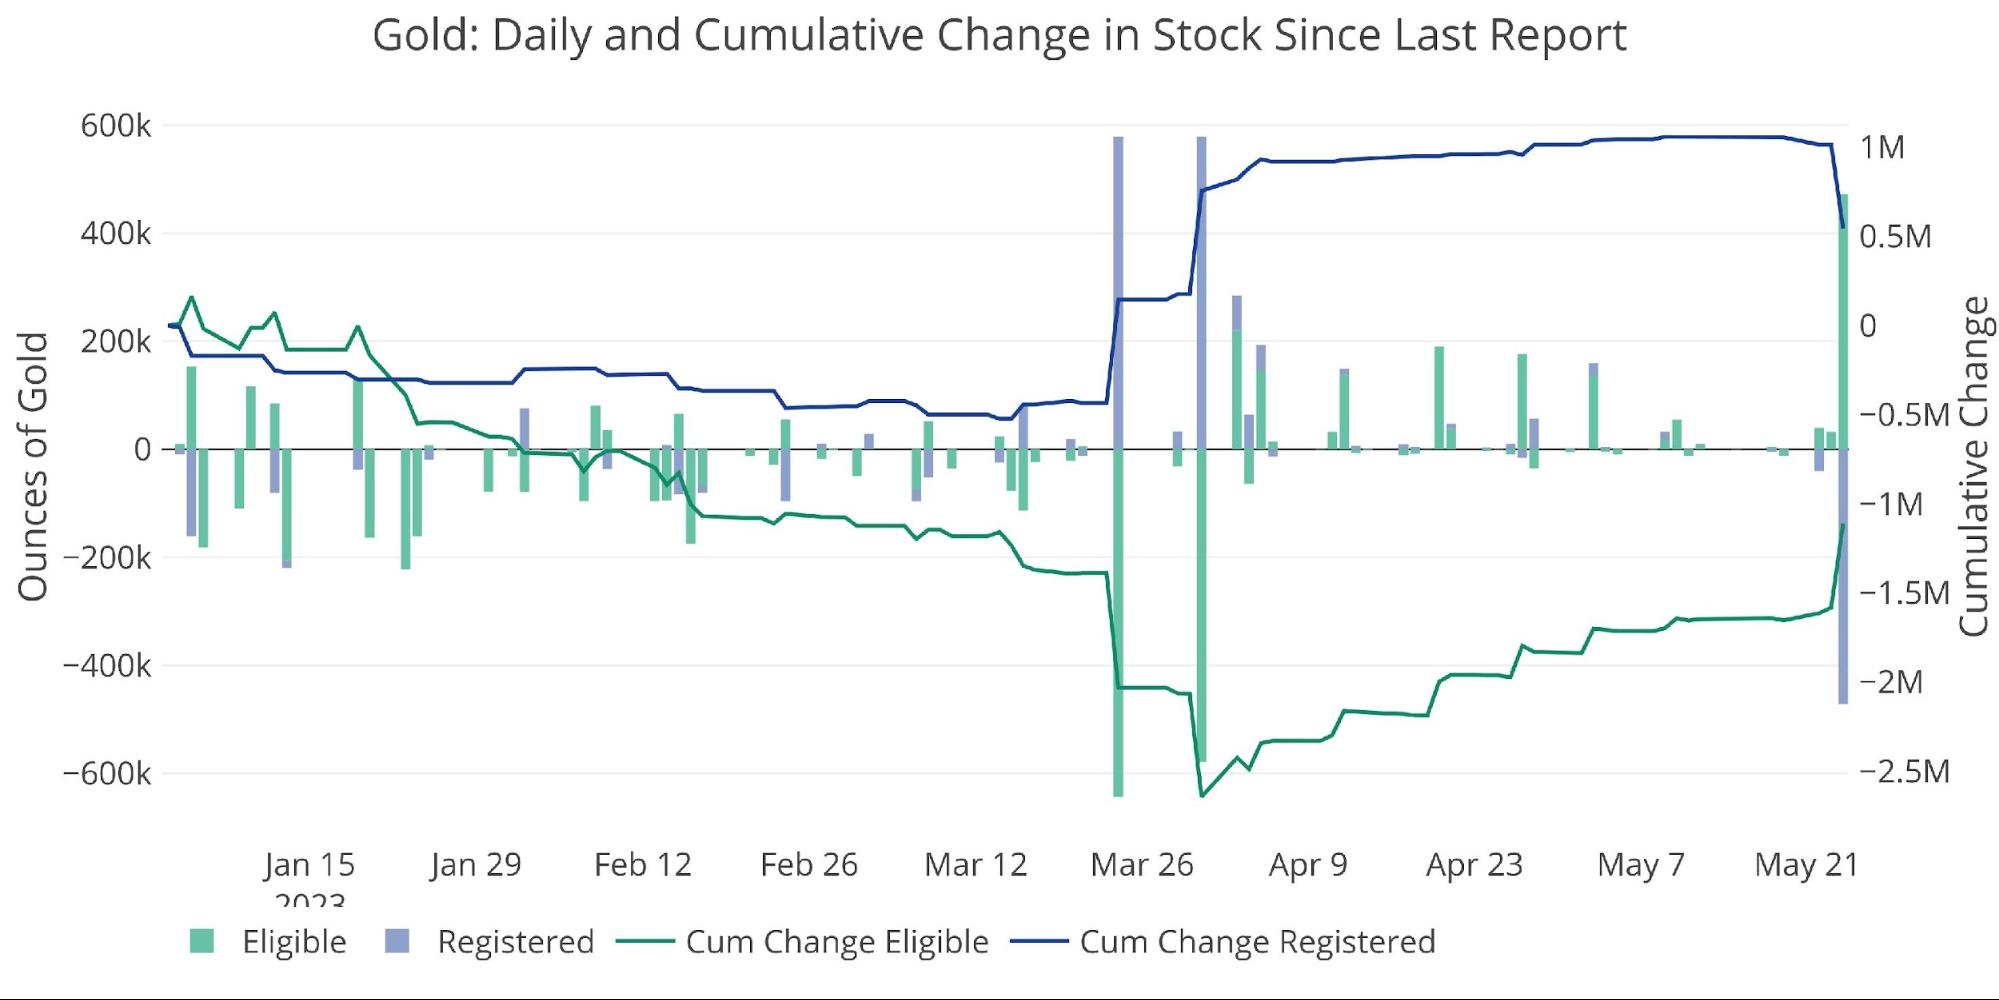
Figure: 6 Recent Monthly Stock Change
Gold: Next Delivery Month
June is the upcoming delivery month and is showing slightly above trend as the roll period continues.
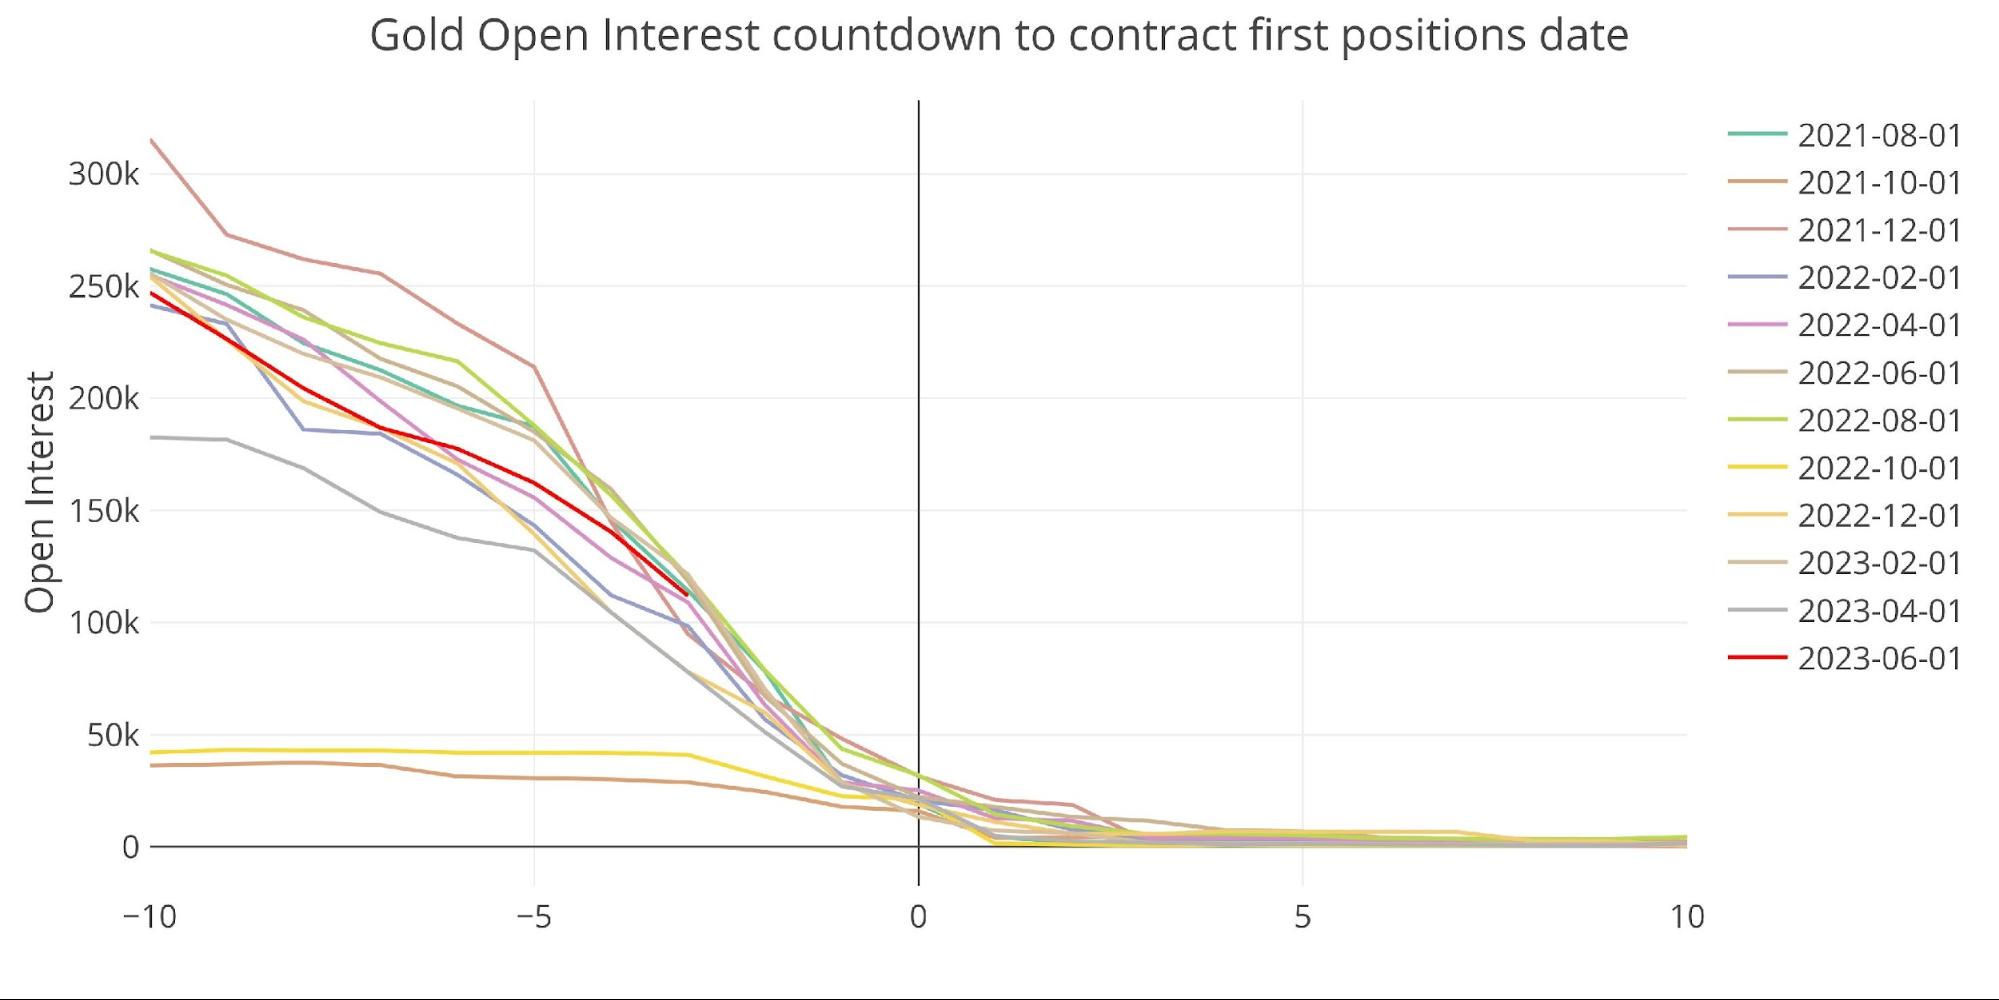
Figure: 7 Open Interest Countdown
On a relative basis to Registered gold, June trails only February of this year.
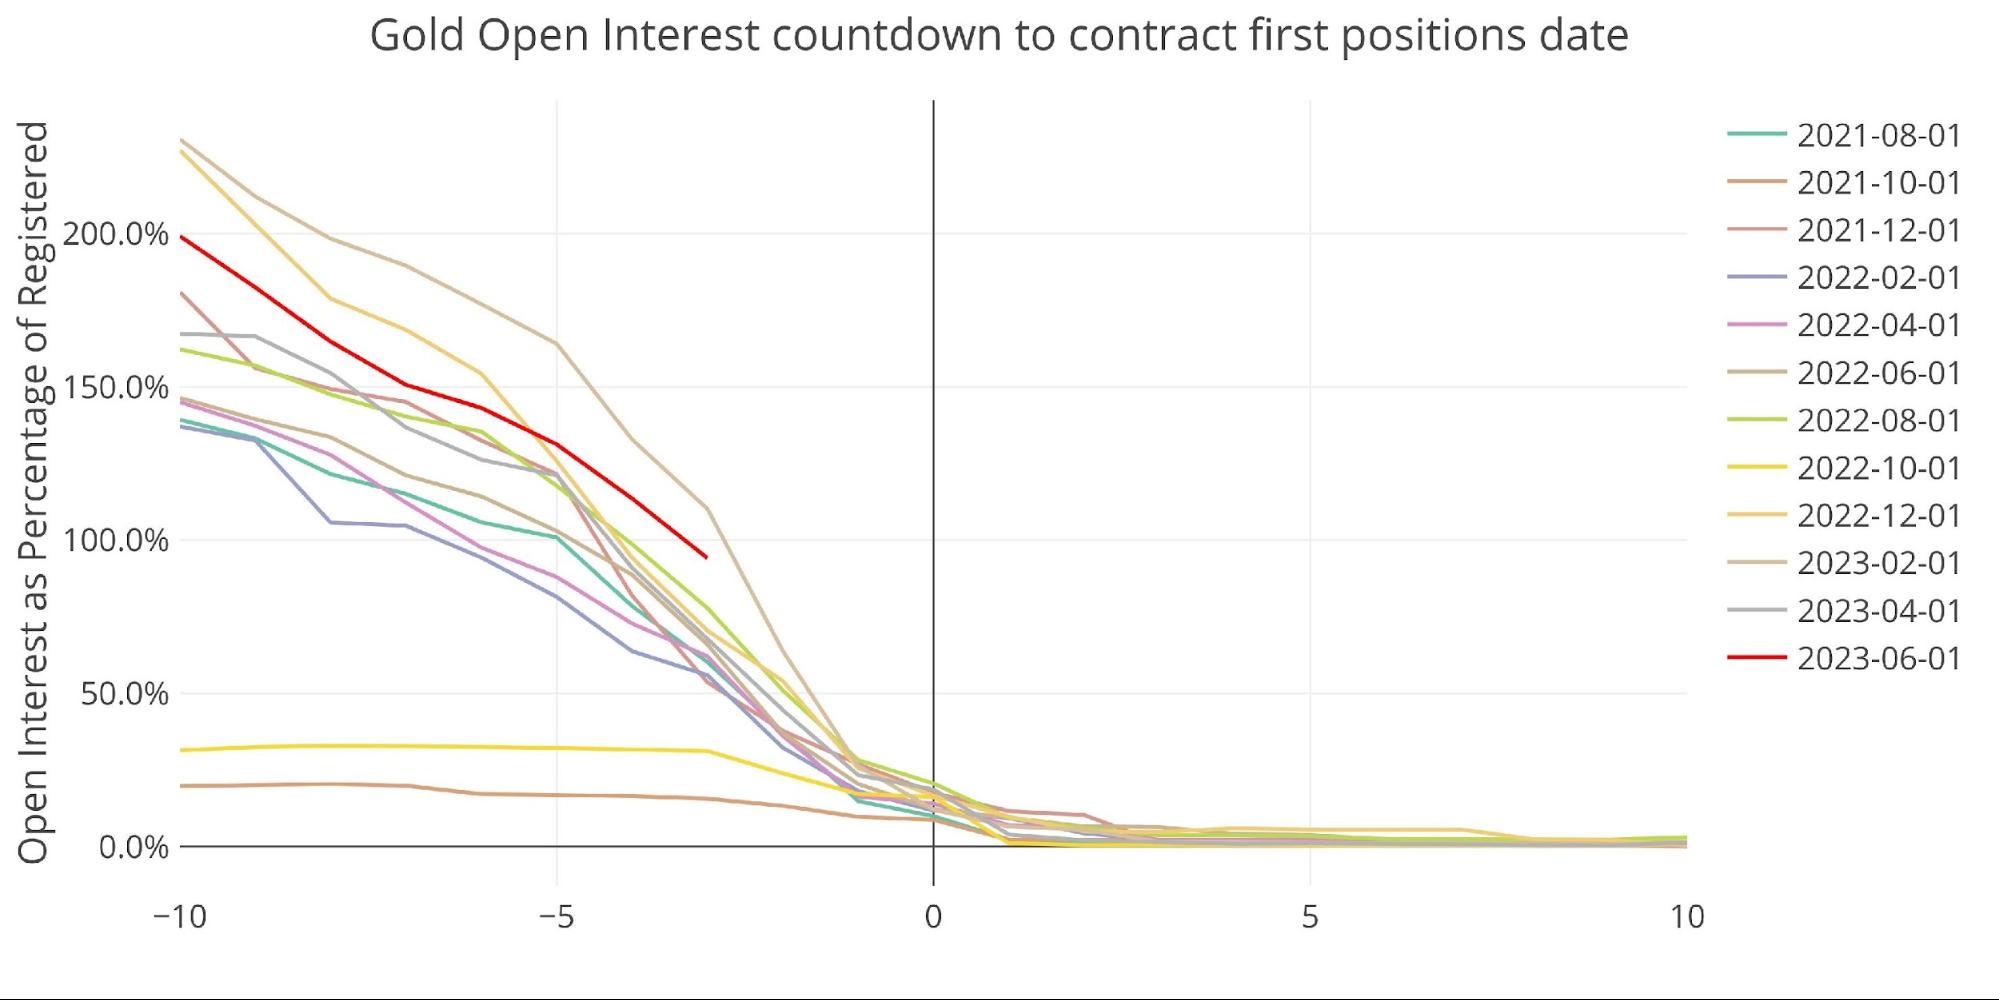
Figure: 8 Countdown Percent
February did end up disappointing, but April saw a strong rebound.
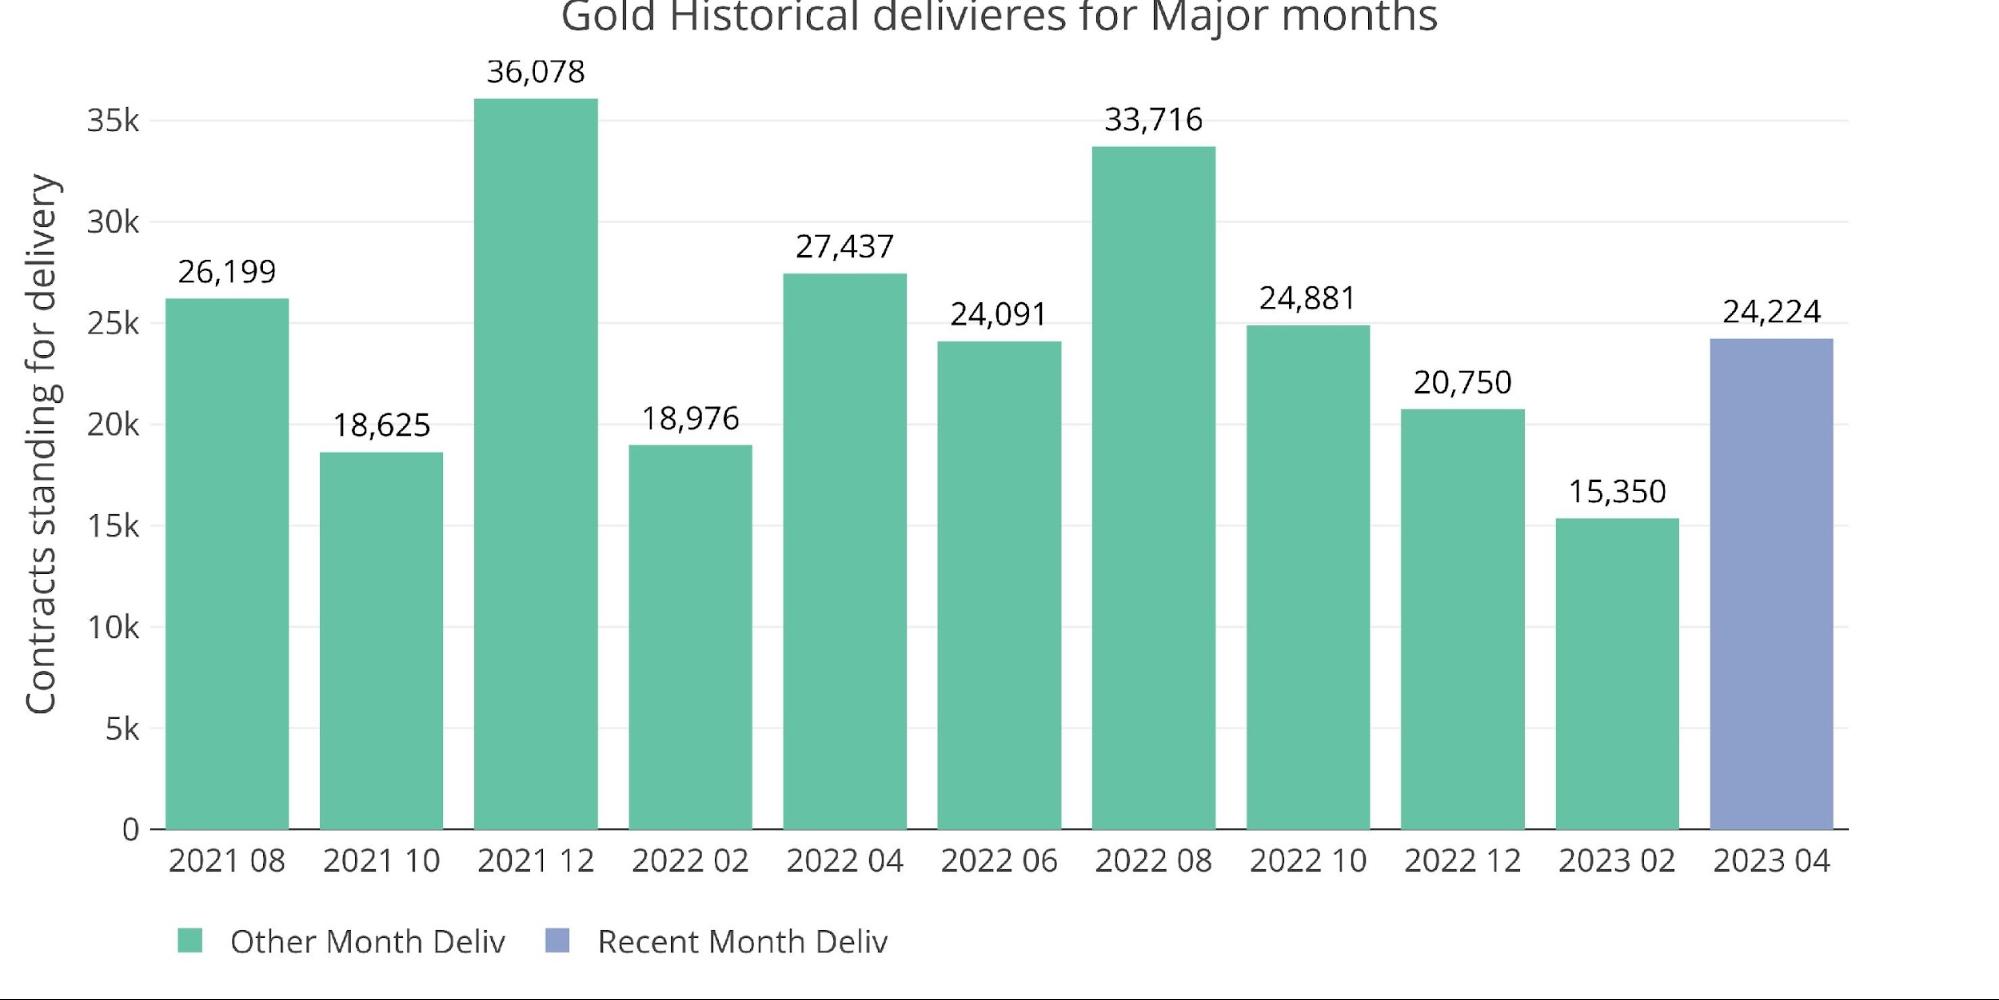
Figure: 9 Historical Deliveries
Spreads
The market remains in strong contango with the highest spreads seen since at least summer 2021.
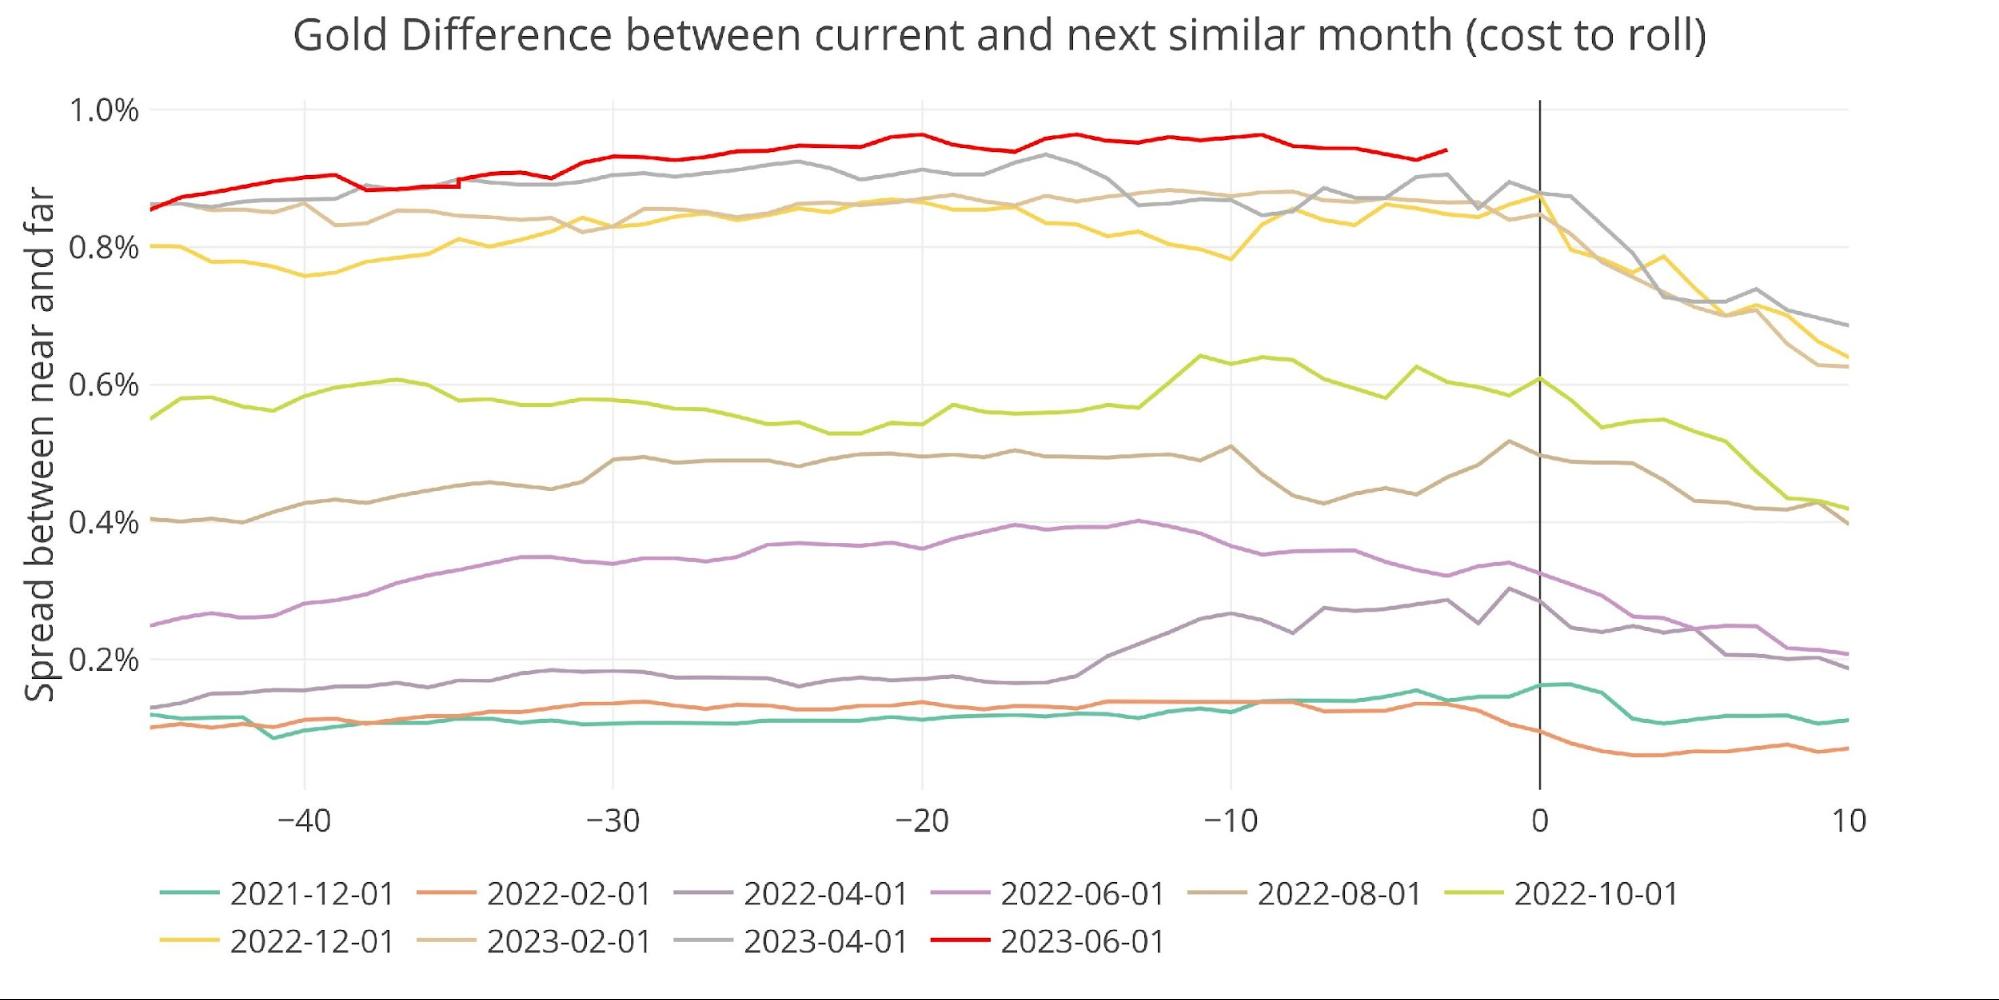
Figure: 10 Futures Spreads
The spread in the cash market looks like it has become very controlled and tightly managed. This started around October 2020 right after gold reached new all-time highs. The nature of the spread in the cash market looks quite deliberate.
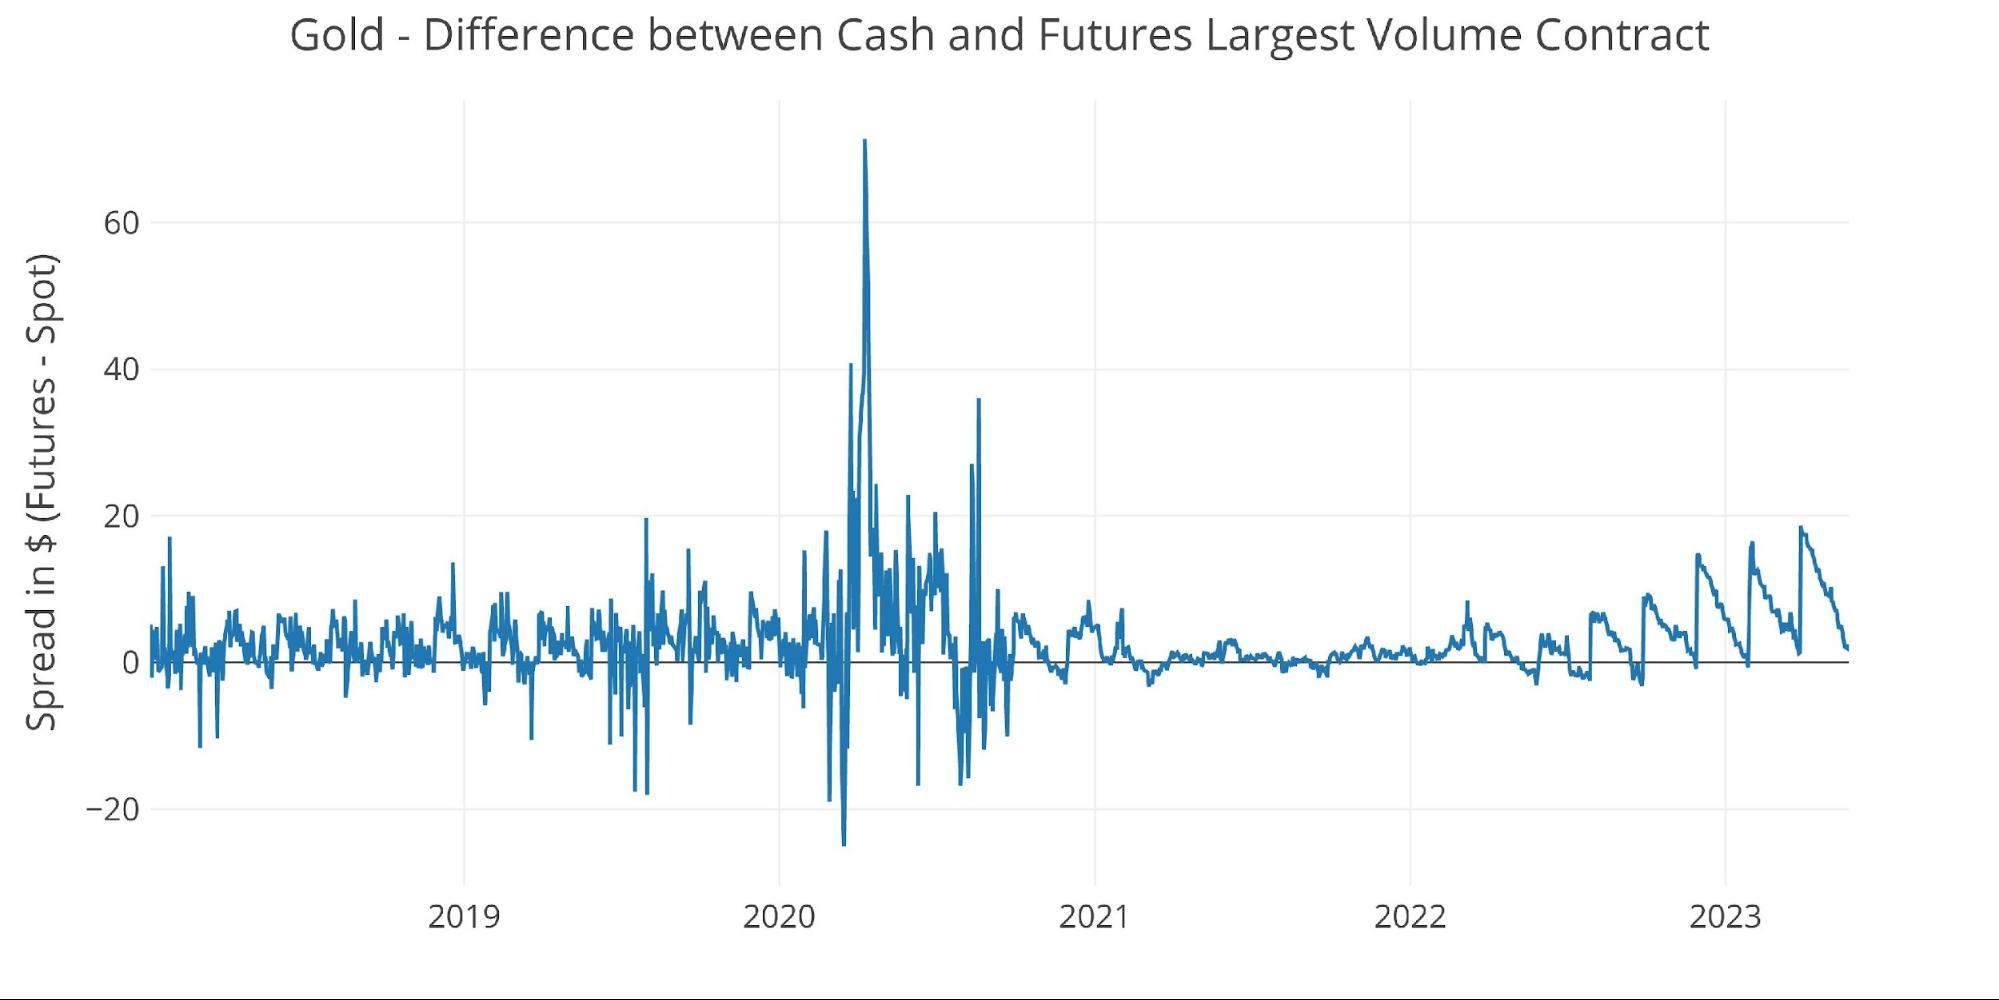
Figure: 11 Spot vs Futures
Silver: Recent Delivery Month
Silver delivery volume was low in May with only 2,558 contracts standing for delivery. This is the smallest major month in years. I have presumed many times that this is because there is simply not much metal to be delivered and cash settlement has been the more favorable option lately.
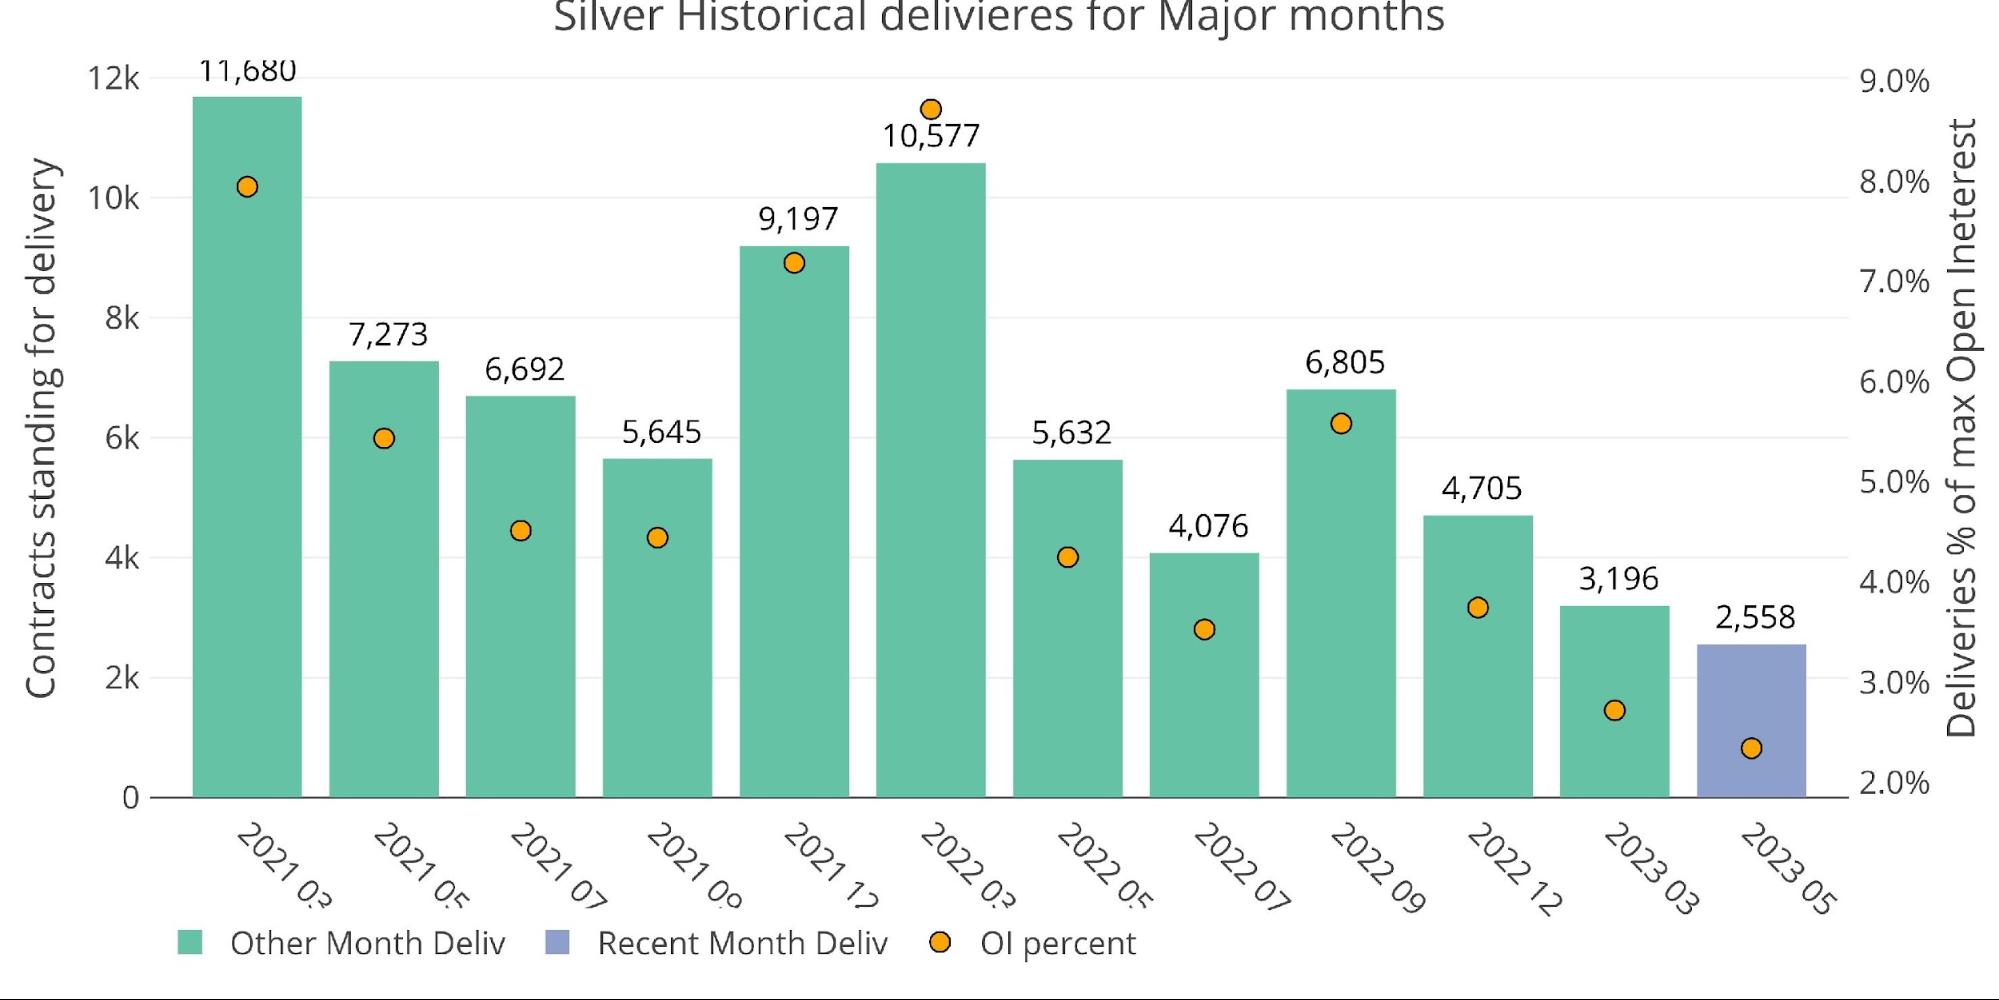
Figure: 12 Recent like-month delivery volume
The net new contract activity has fallen off a cliff.
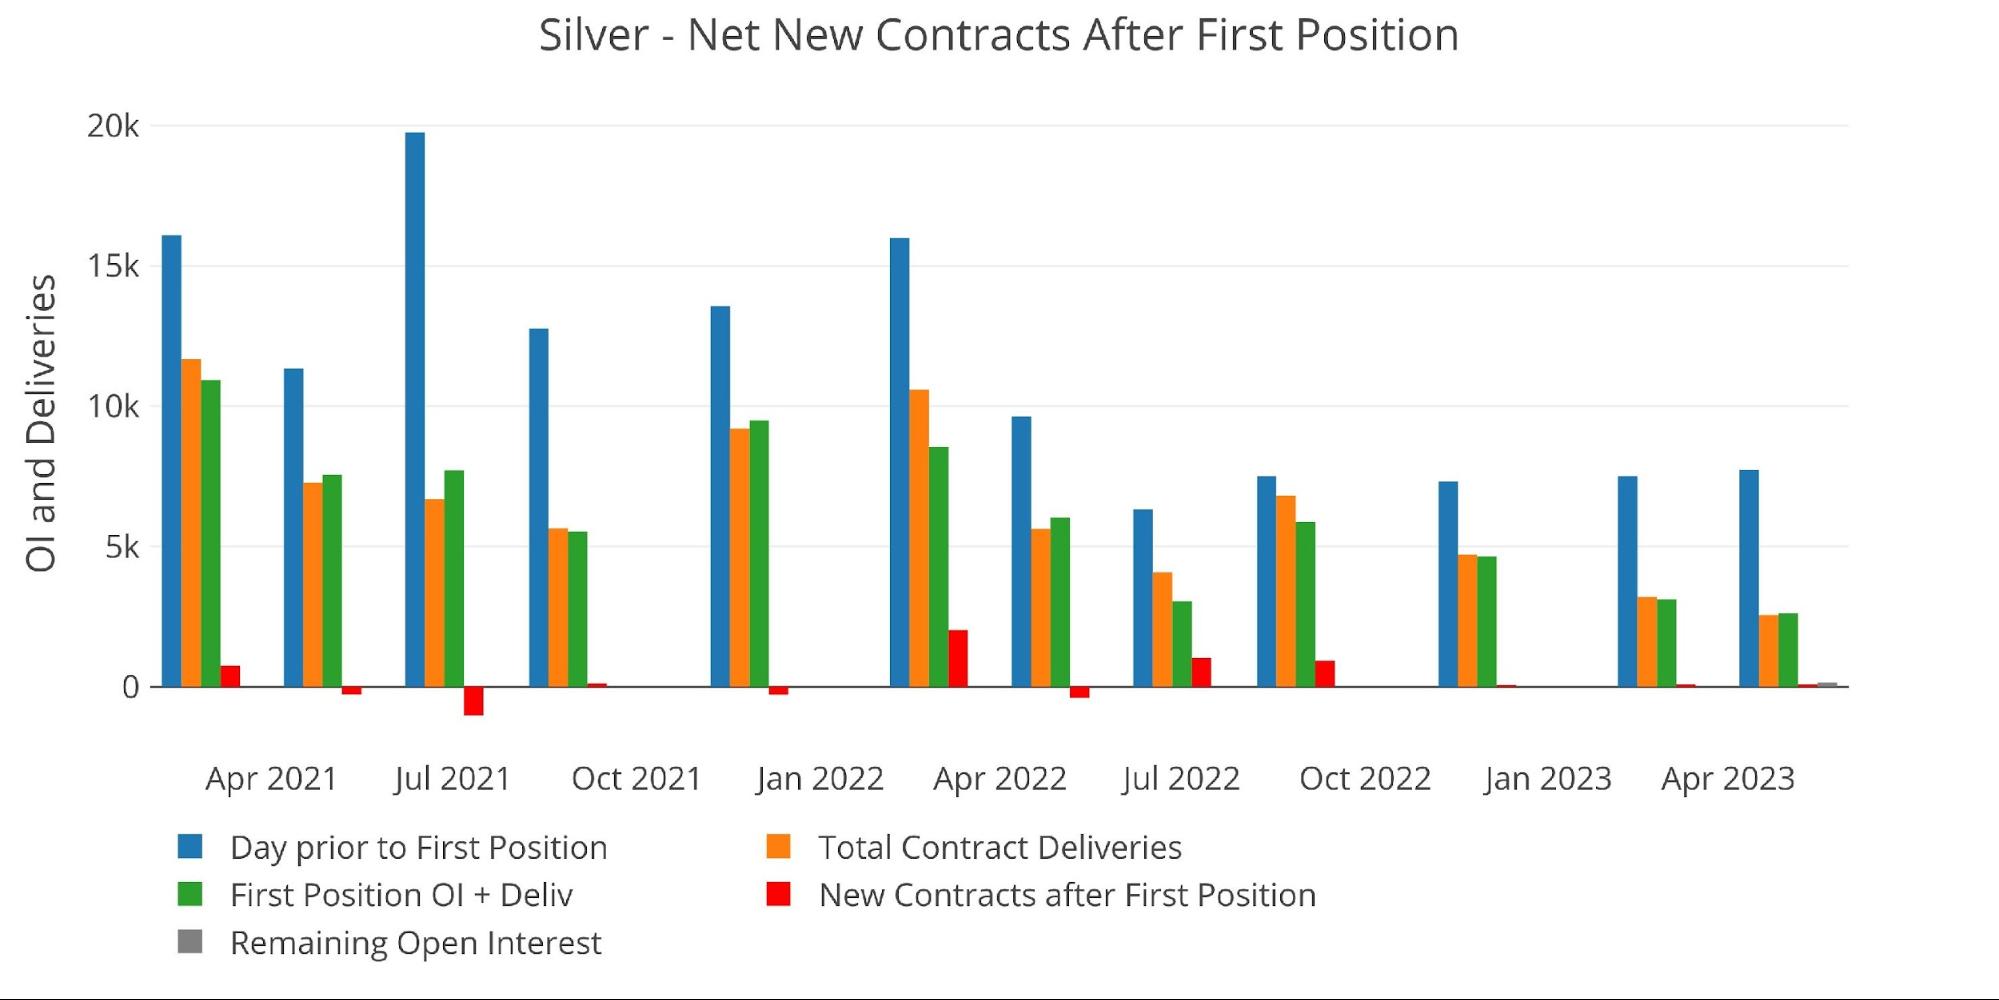
Figure: 13 24-month delivery and first notice
This can be seen below where the activity was completely flat throughout the entire month.
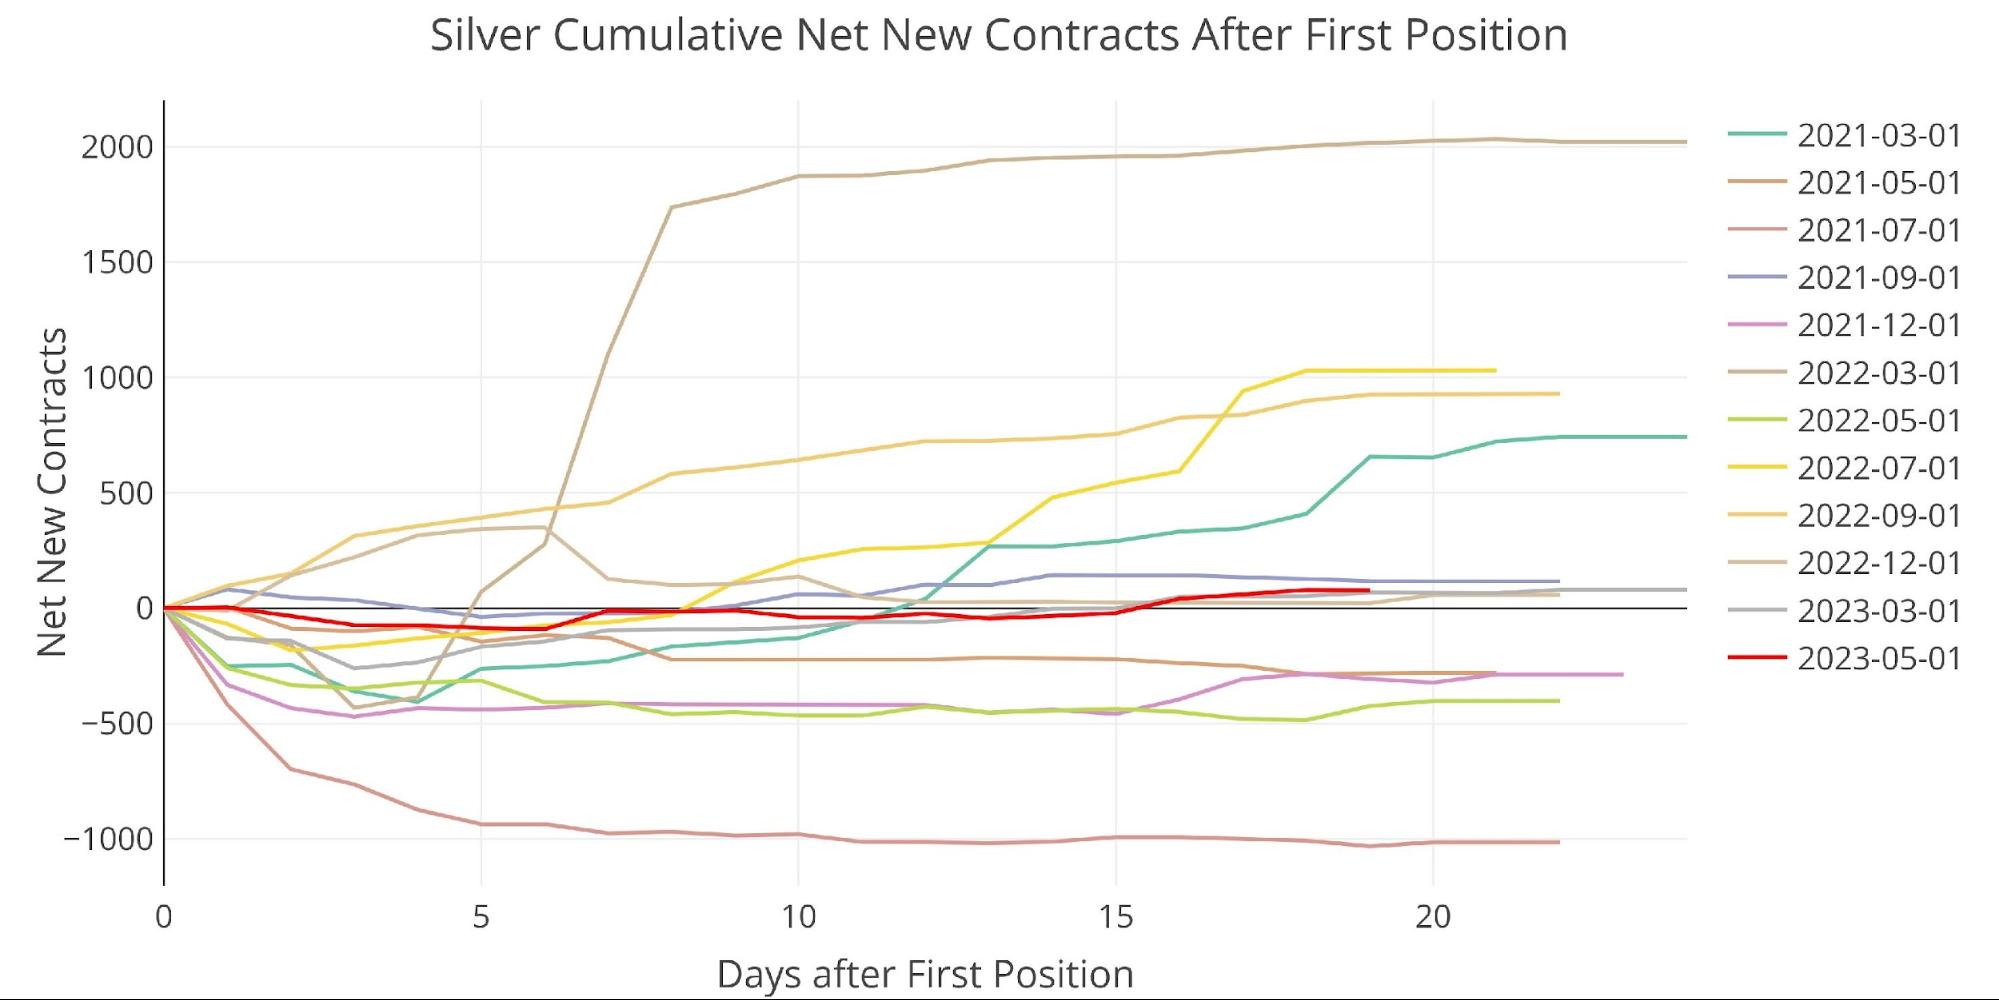
Figure: 14 Cumulative Net New Contracts
From a notional perspective, this May will be the smallest month since 2019 and trail even 2017 and 2018.

Figure: 15 Notional Deliveries
The bank house accounts only delivered metal out and did not take in any new metal. This could be further evidence of limited supplies.
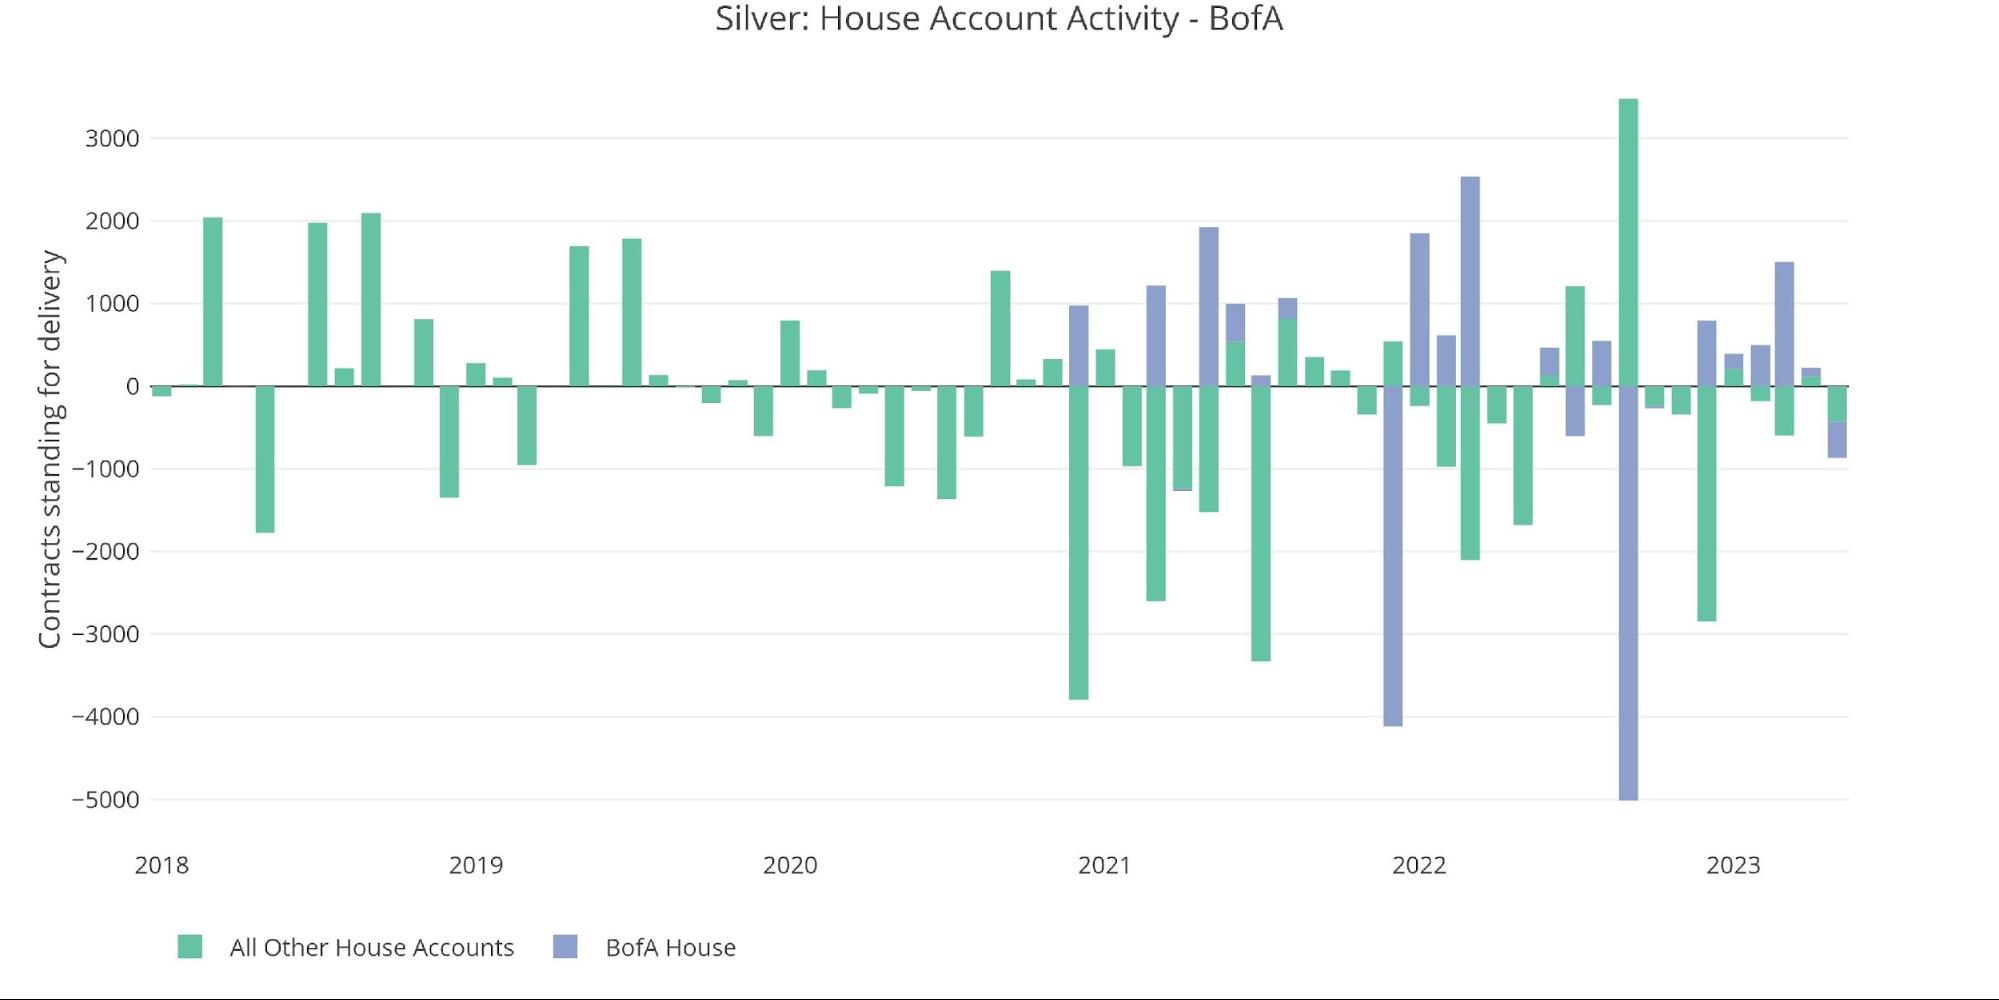
Figure: 16 House Account Activity
The vaults have been restocking some over the last couple of weeks, but a big outflow two days ago has already negated 25% of the restocking efforts.
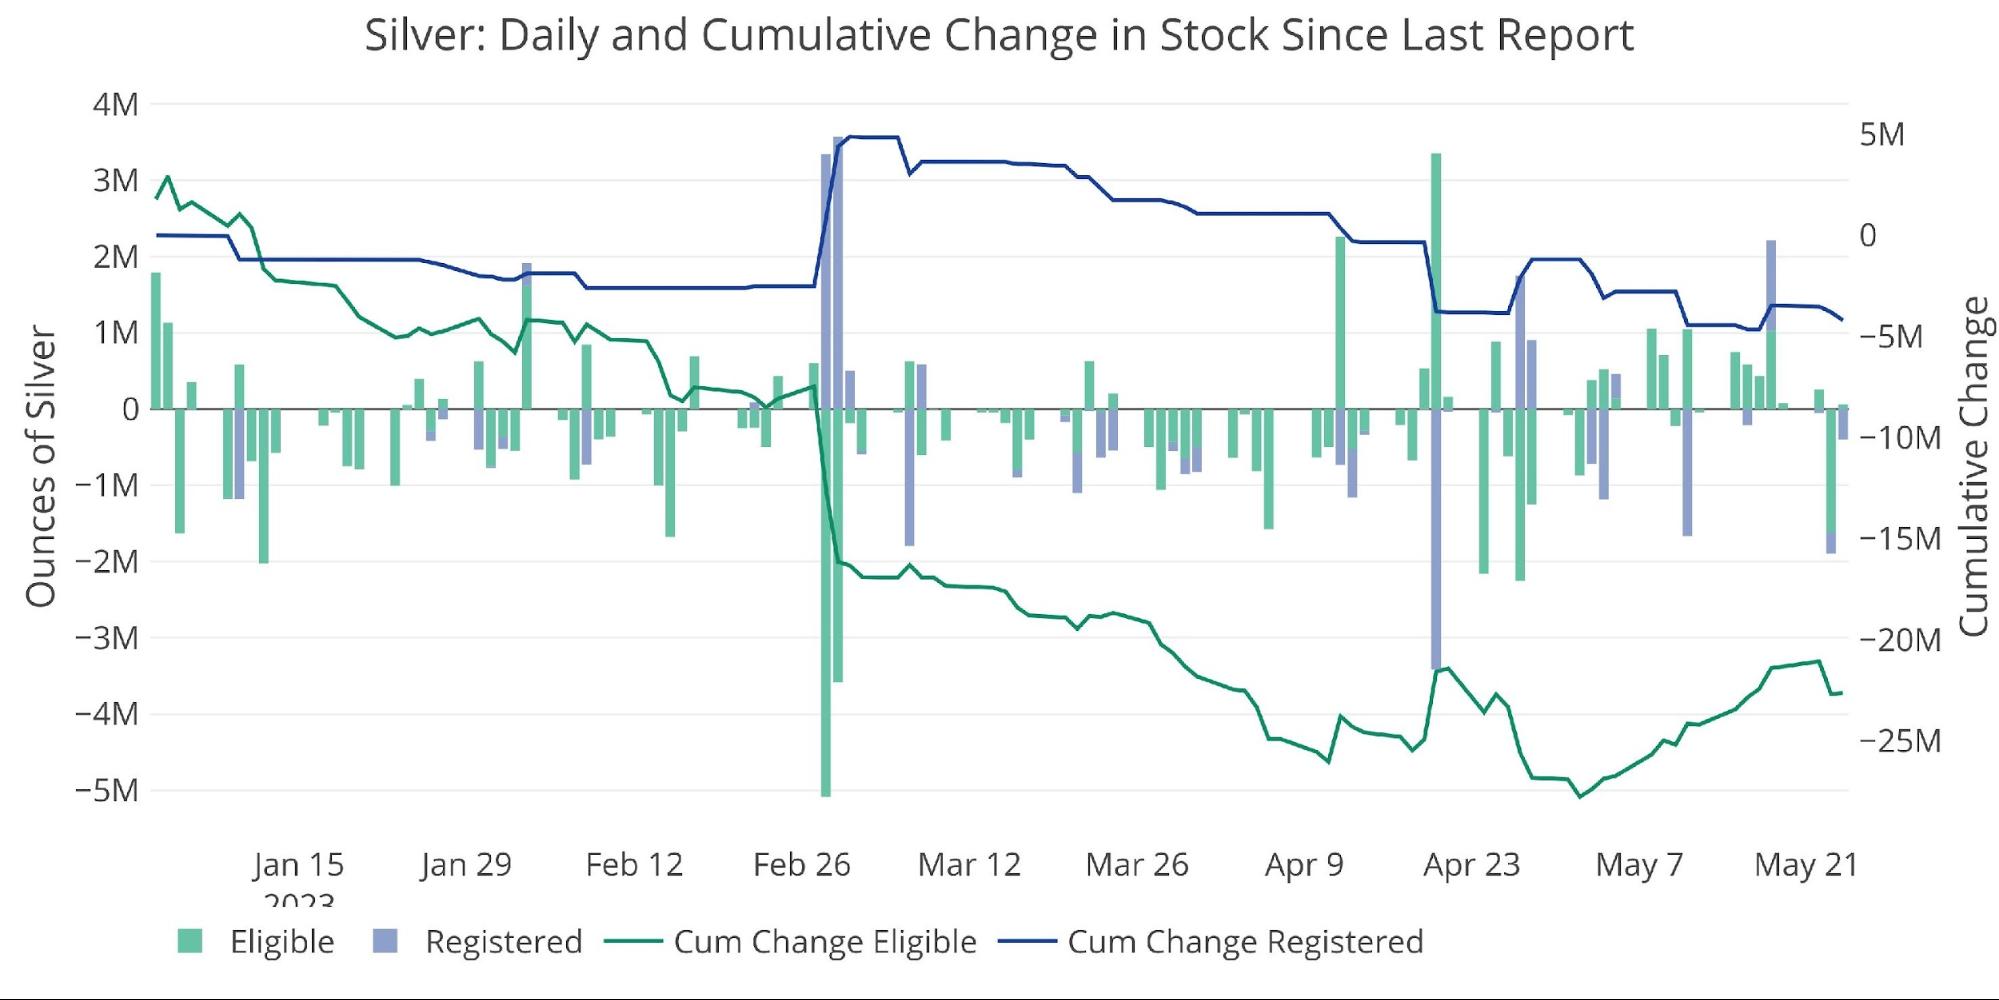
Figure: 17 Recent Monthly Stock Change
Silver: Next Delivery Month
Silver June is actually showing some strength. It currently trails only January 2023 and June 2022.
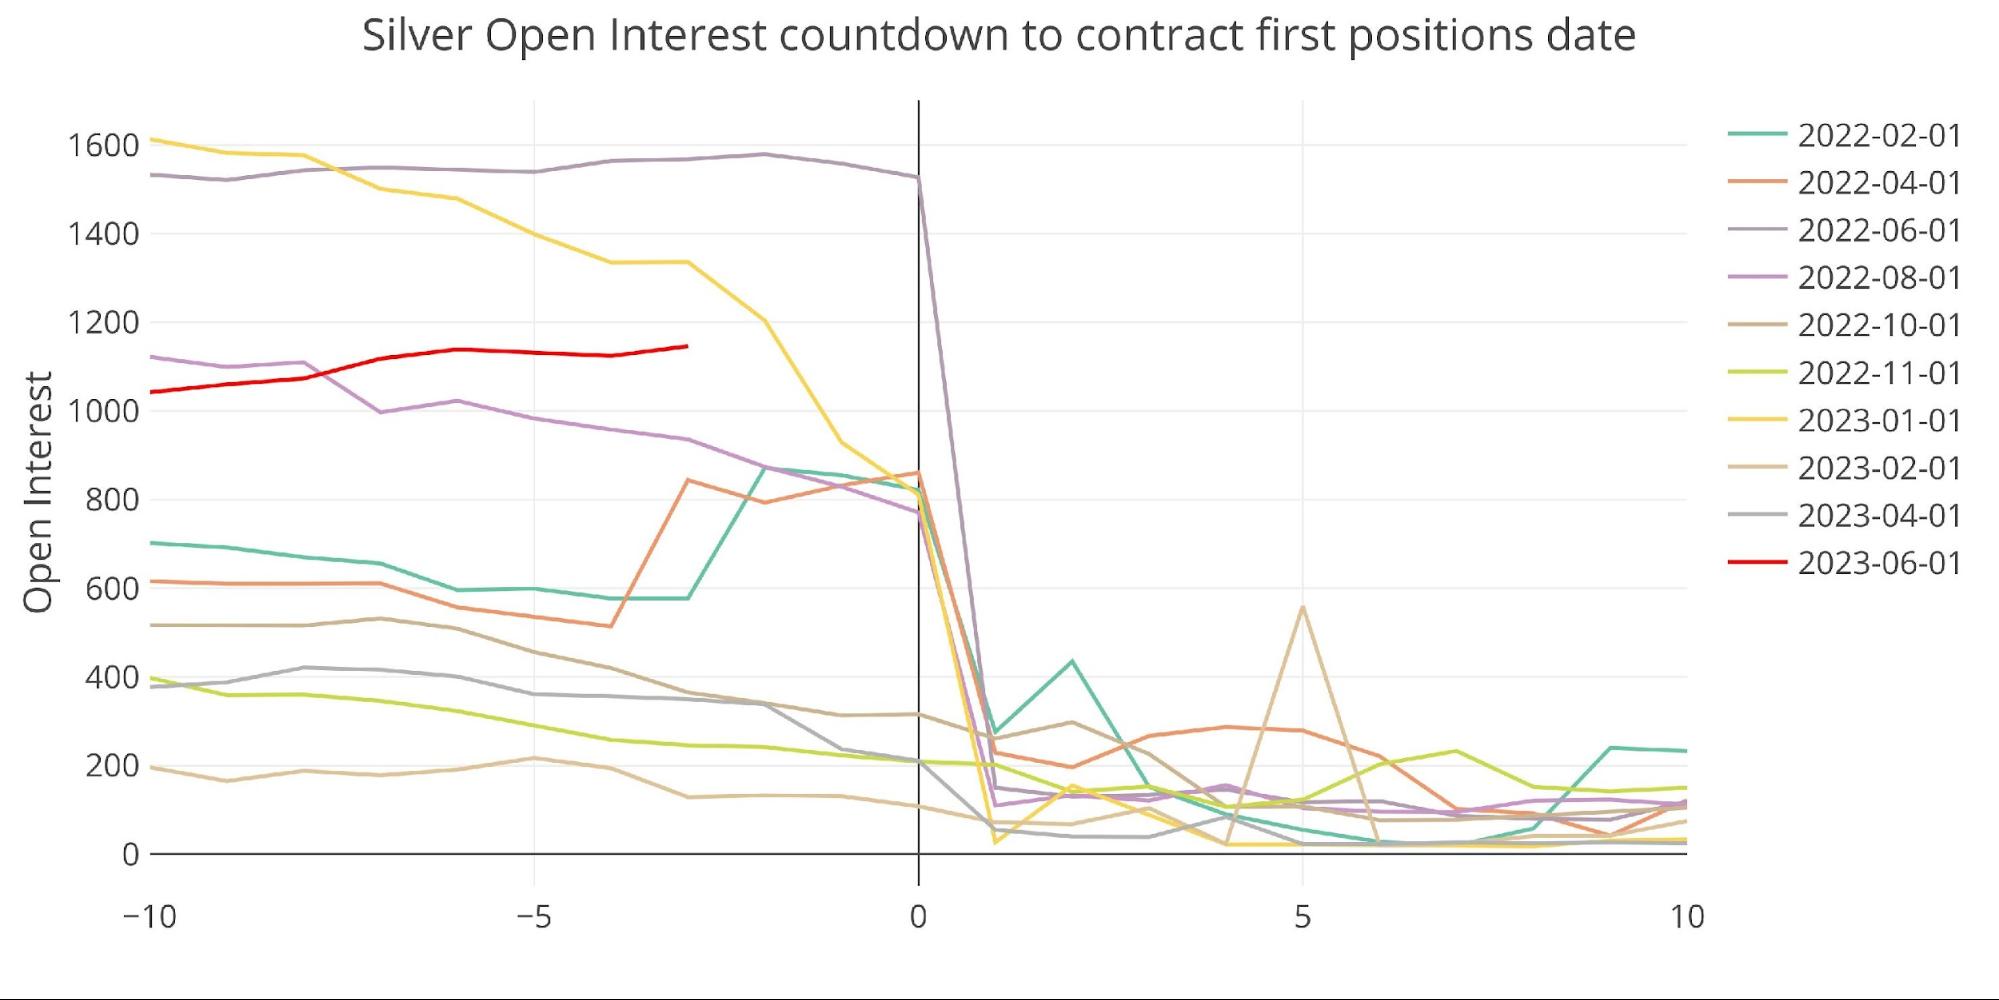
Figure: 18 Open Interest Countdown
On a relative basis, this month has crossed January to become the strongest minor month in at least 2 years with 3 days to go.
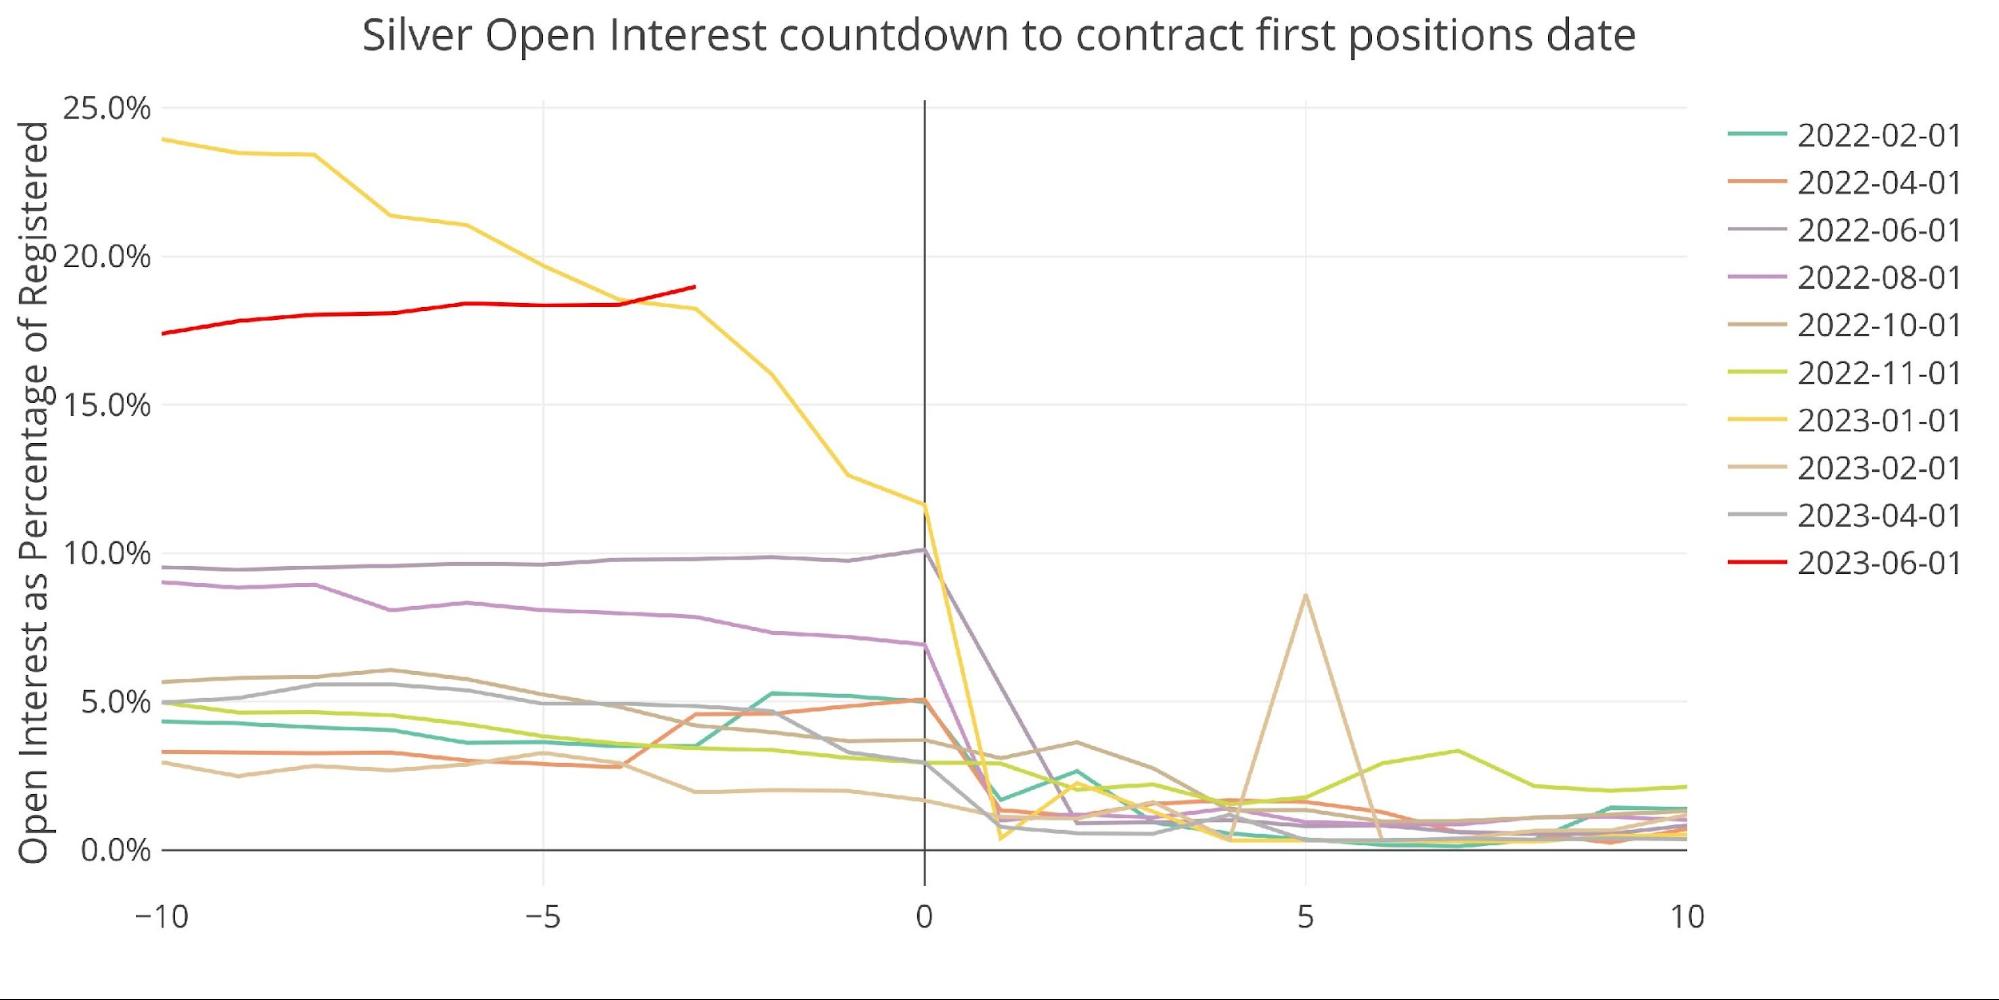
Figure: 19 Countdown Percent
The trend in minor months has been down with April being incredibly weak. June should bounce back some given the current open interest levels.
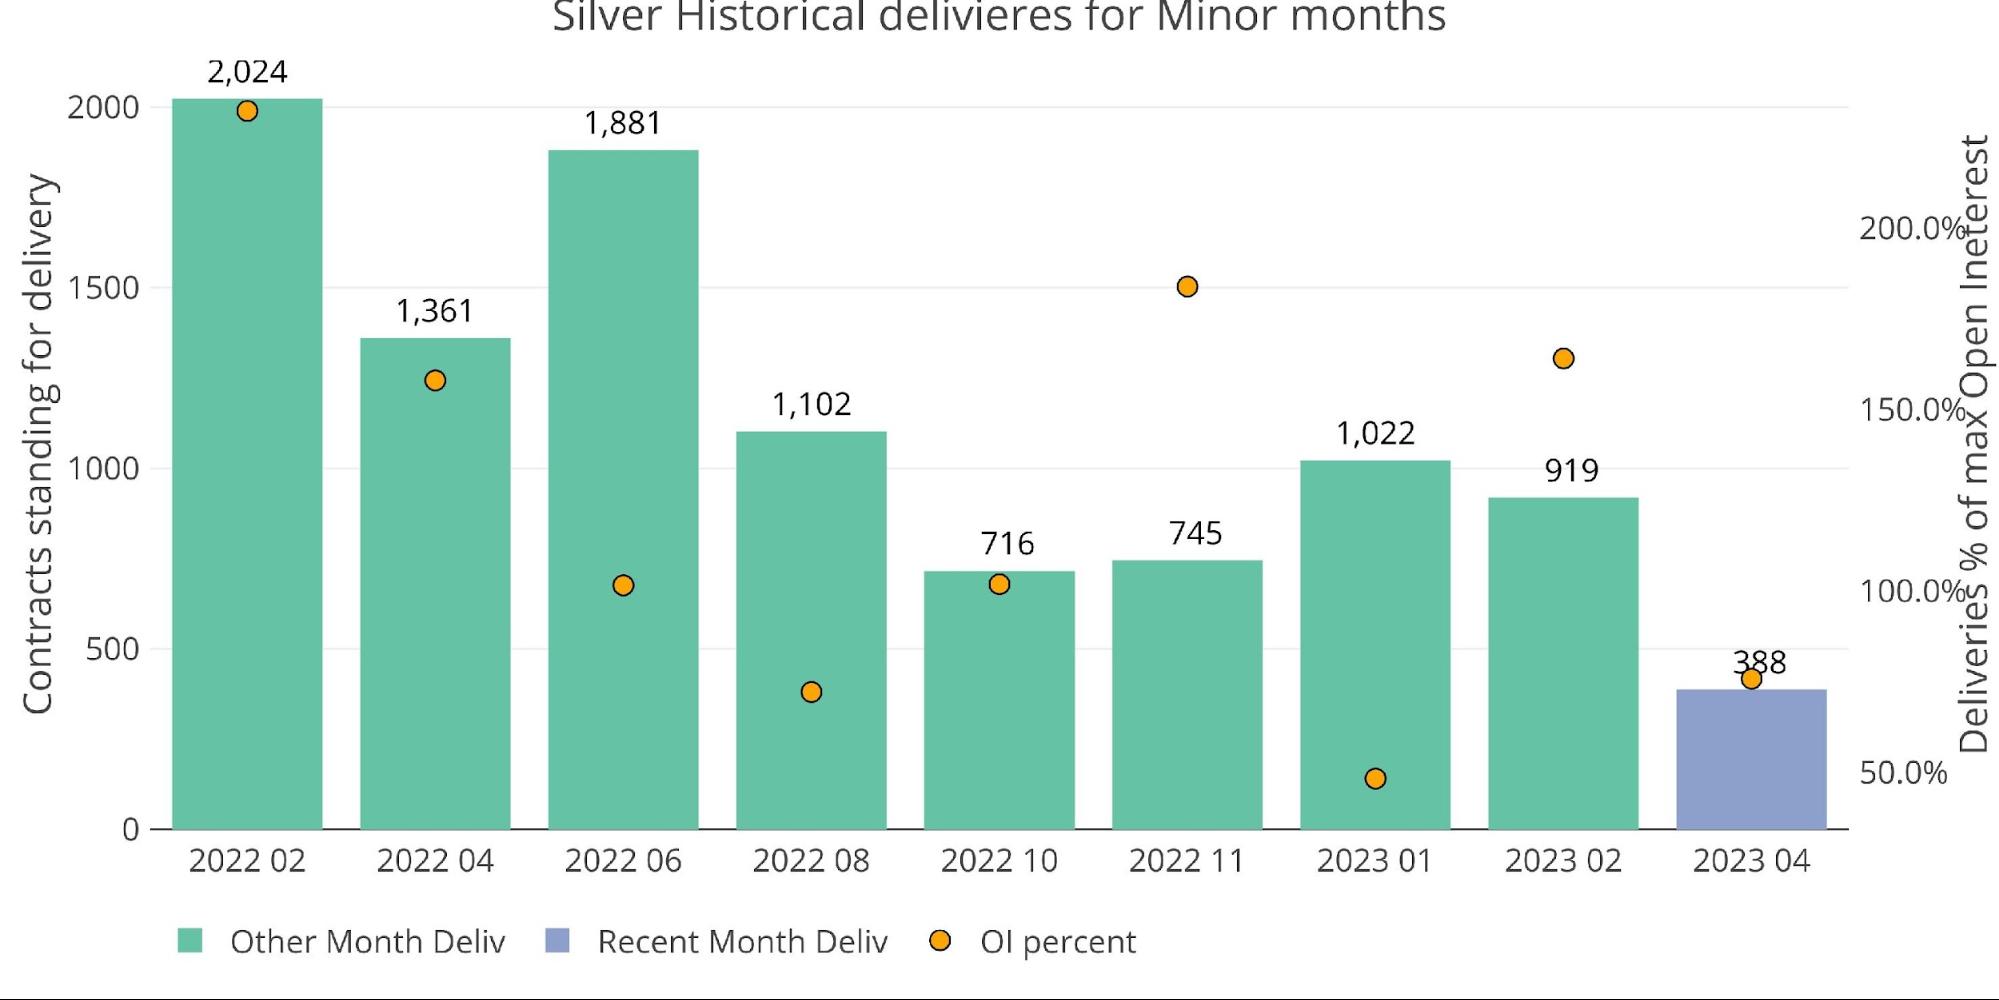
Figure: 20 Historical Deliveries
Spreads
Finally, the cash market remains in Contango after a few periods of backwardation over the last year.
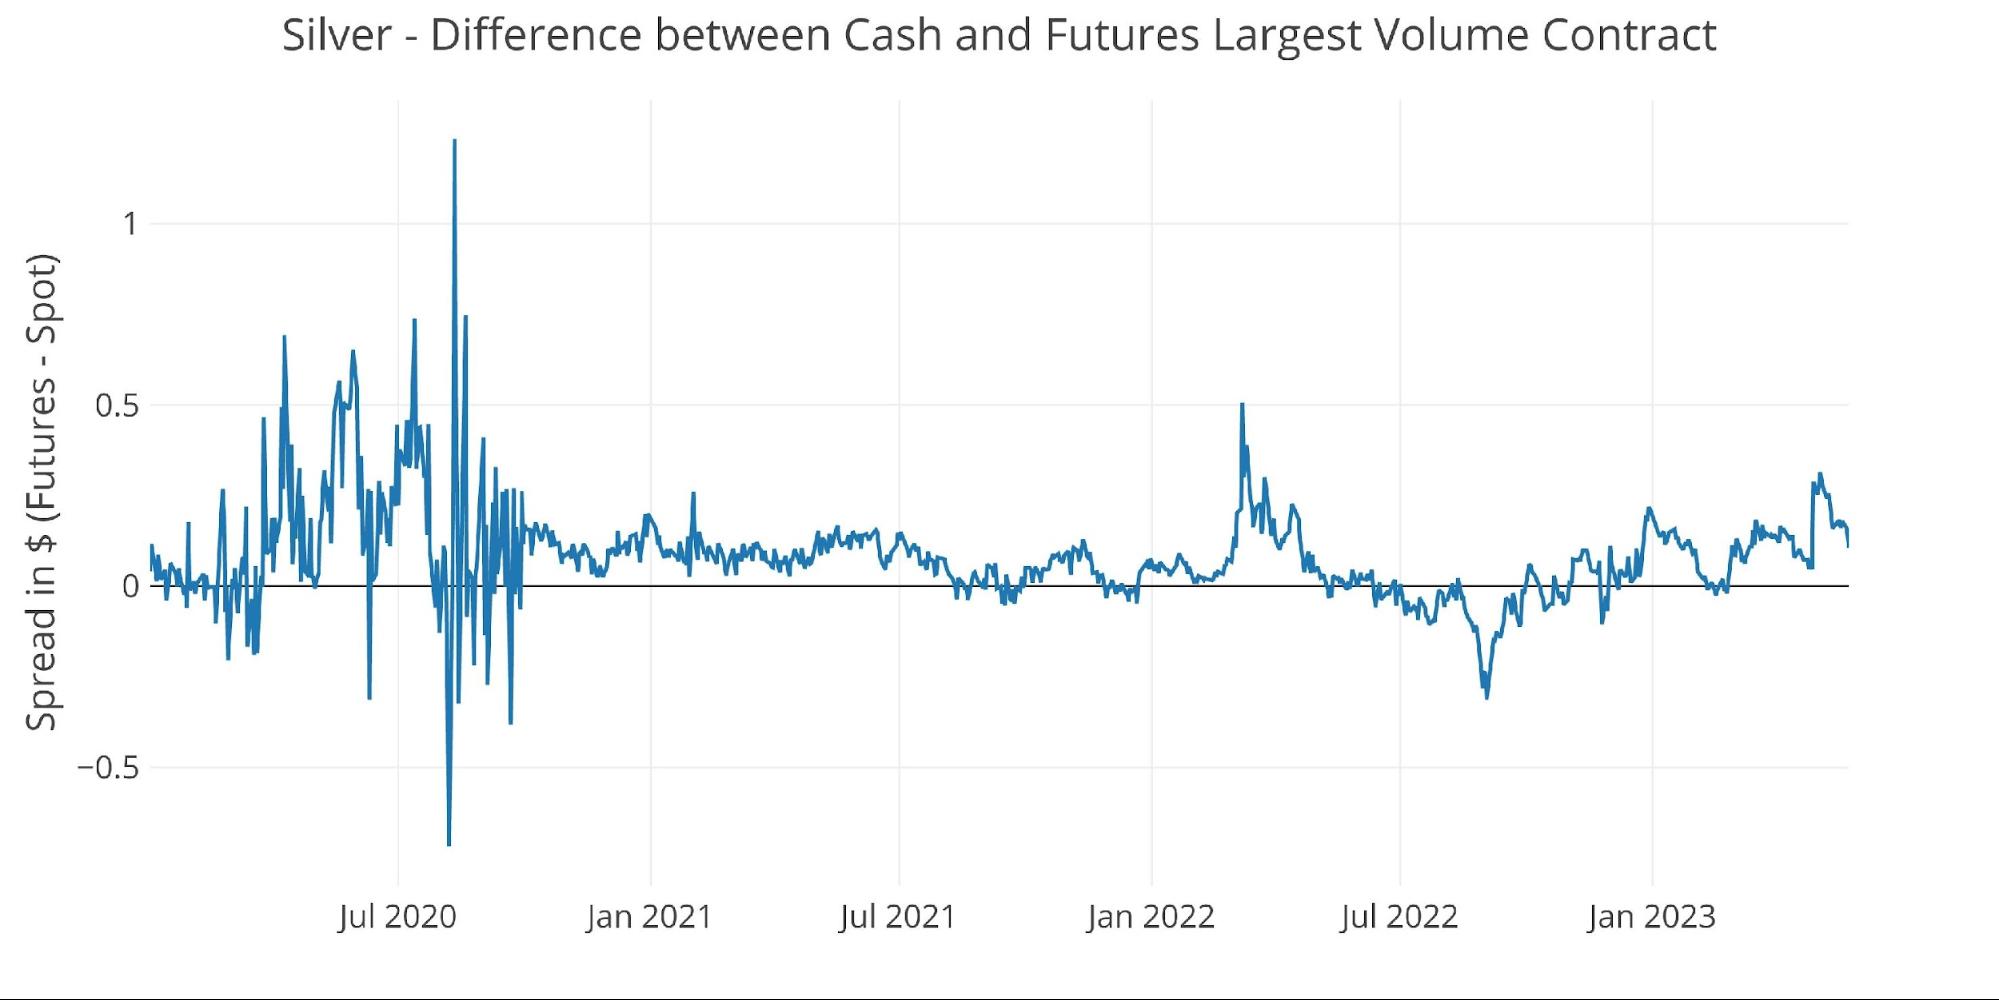
Figure: 21 Spot vs Futures
Palladium
Volume in Palladium has been steady for the last several major months (major months are at each quarter end).
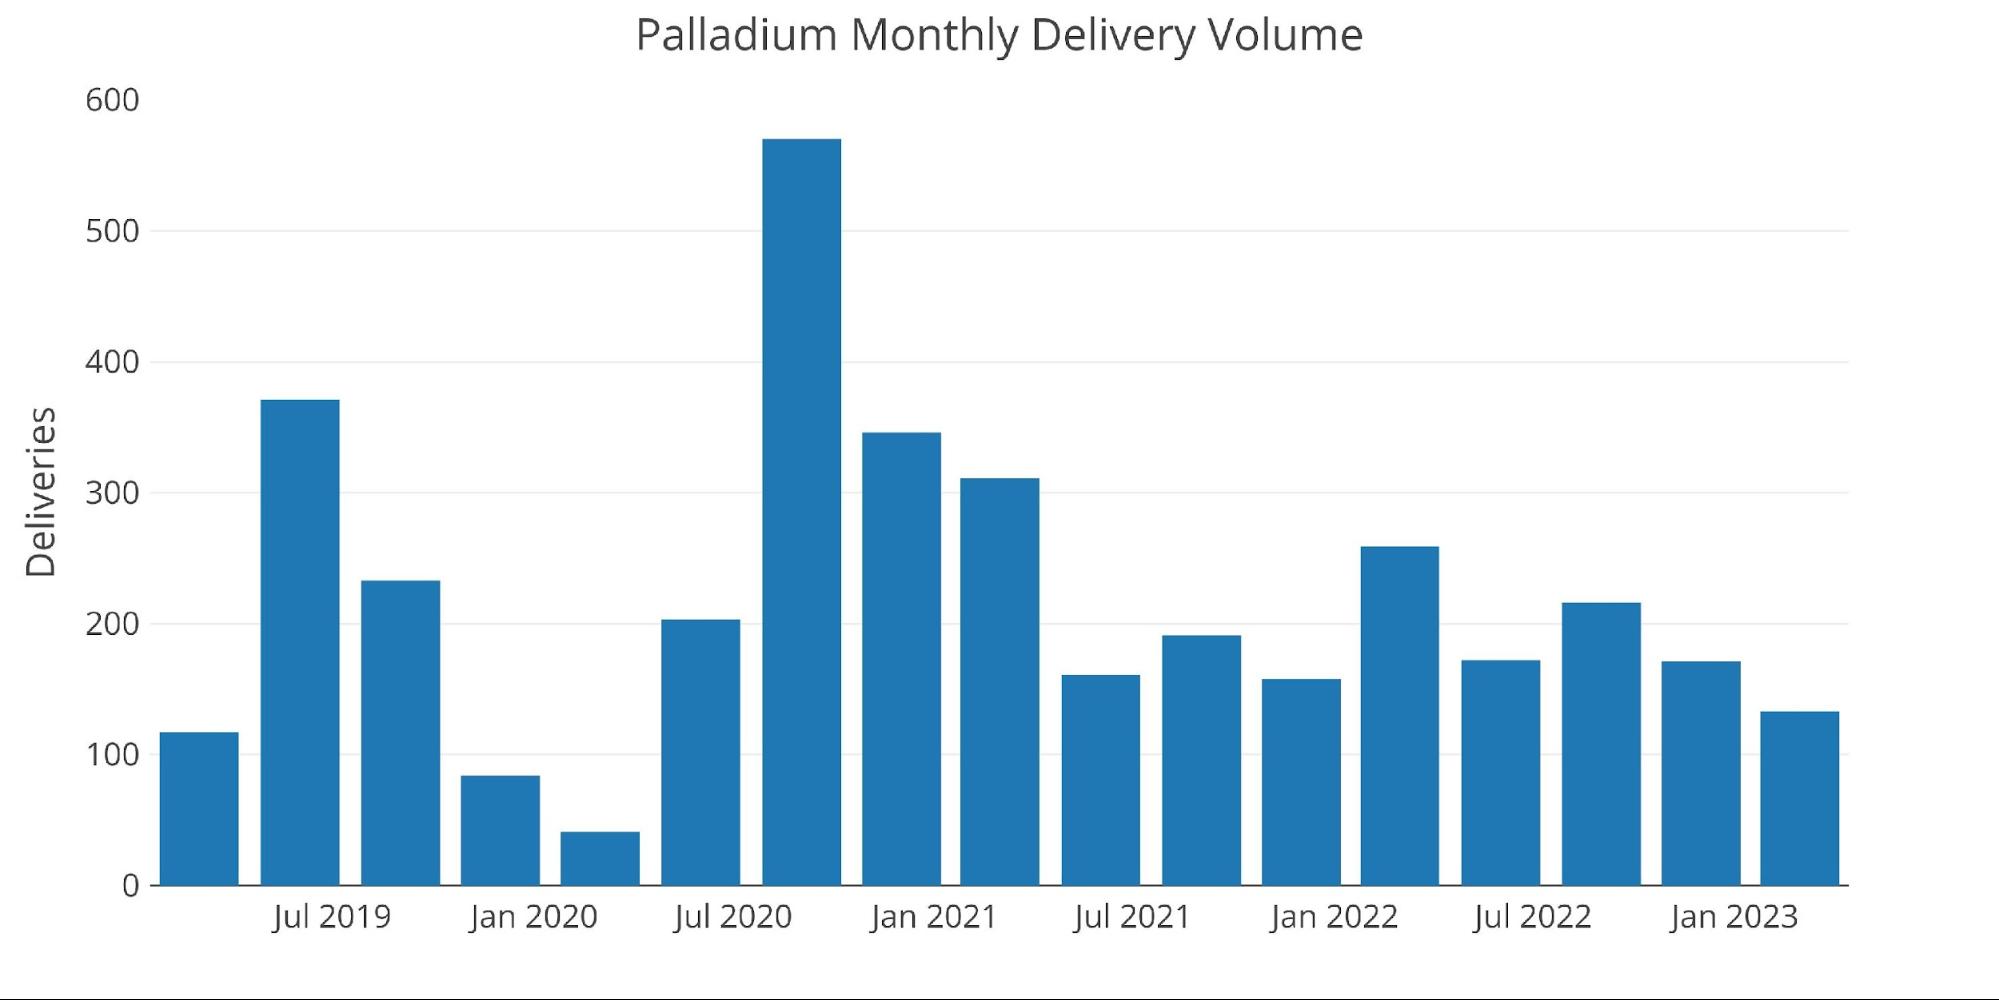
Figure: 22 Palladium Delivery Volume
The vaults have also been fairly steady with most metal sitting in Registered.
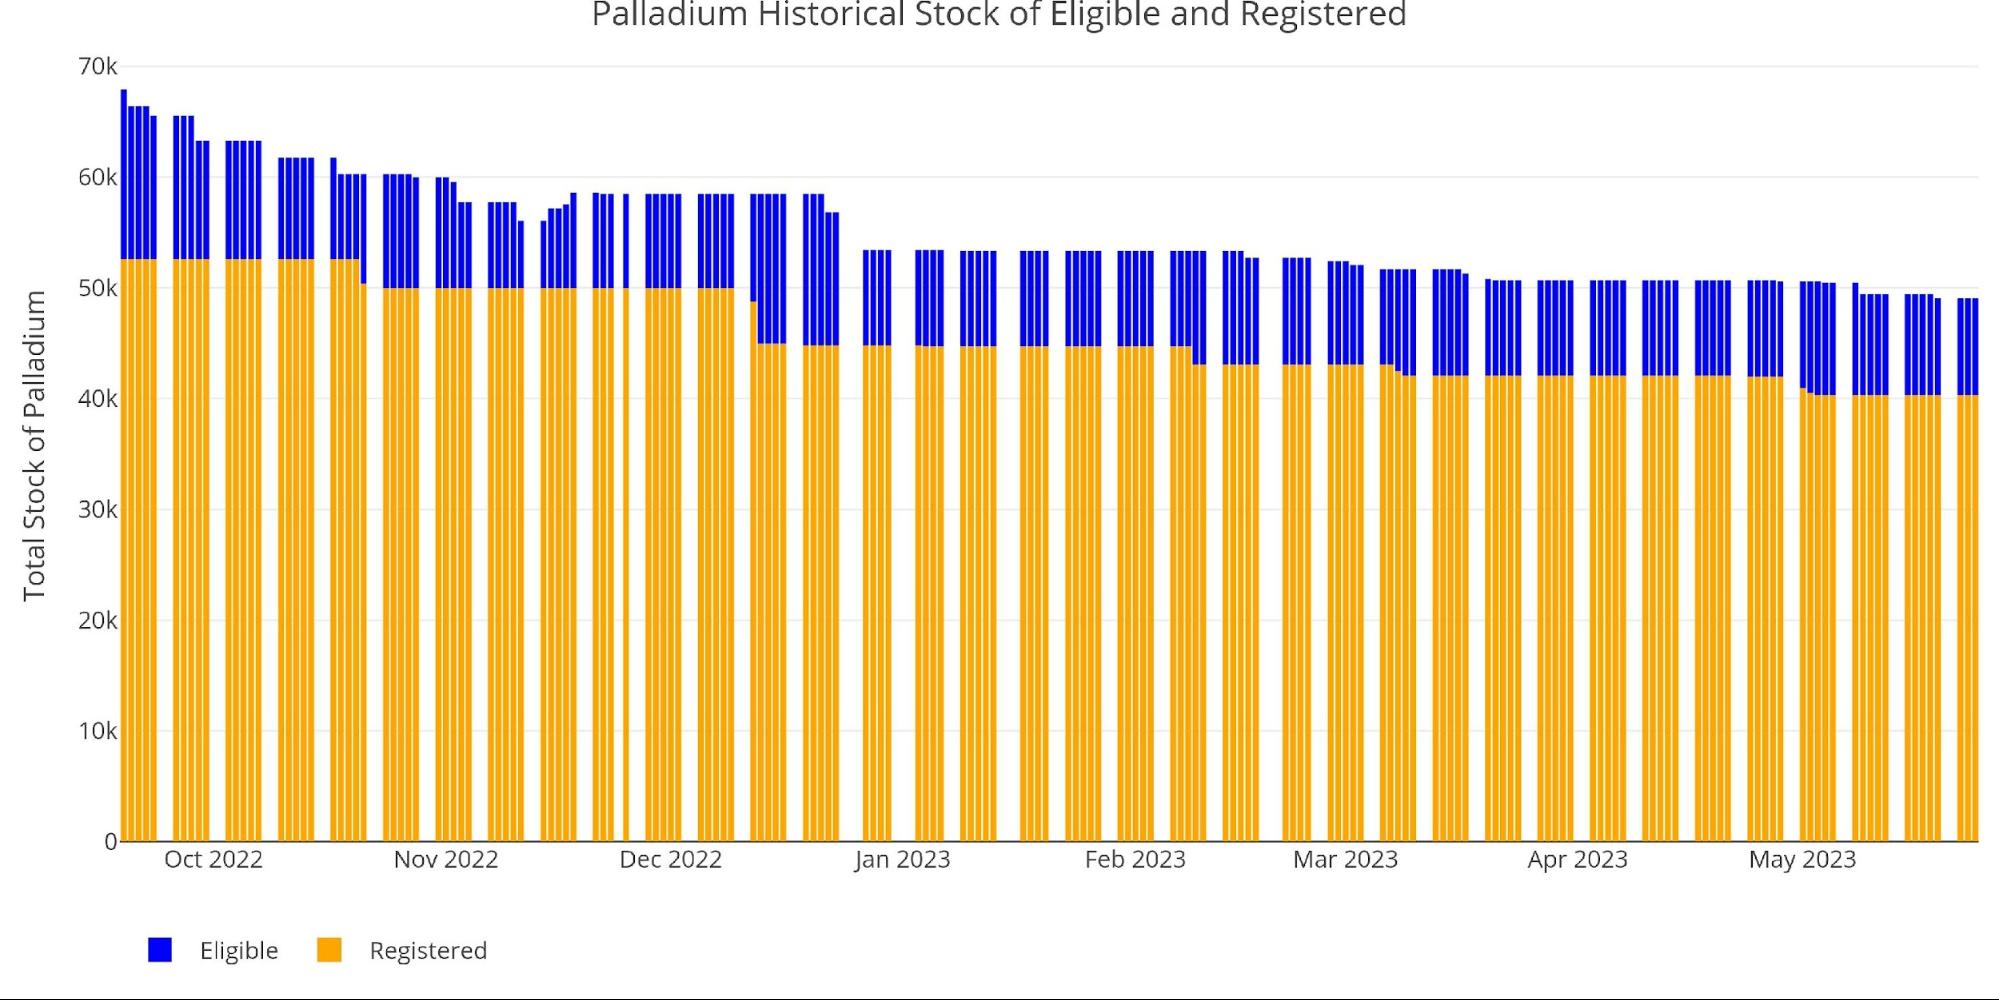
Figure: 23 Palladium Inventory
The open interest was looking very promising but has fallen dramatically in recent days. Even with the fall, it’s still the highest open interest in 18 months headed into the close.

Figure: 24 Open Interest Countdown
On a relative basis, the amount of open interest compared to Registered is extremely high with 3 days to go. At the current point, paper contracts represent 743% of Palladium available for delivery. This will likely fall further in the days ahead, but it does pose a risk to the Comex.
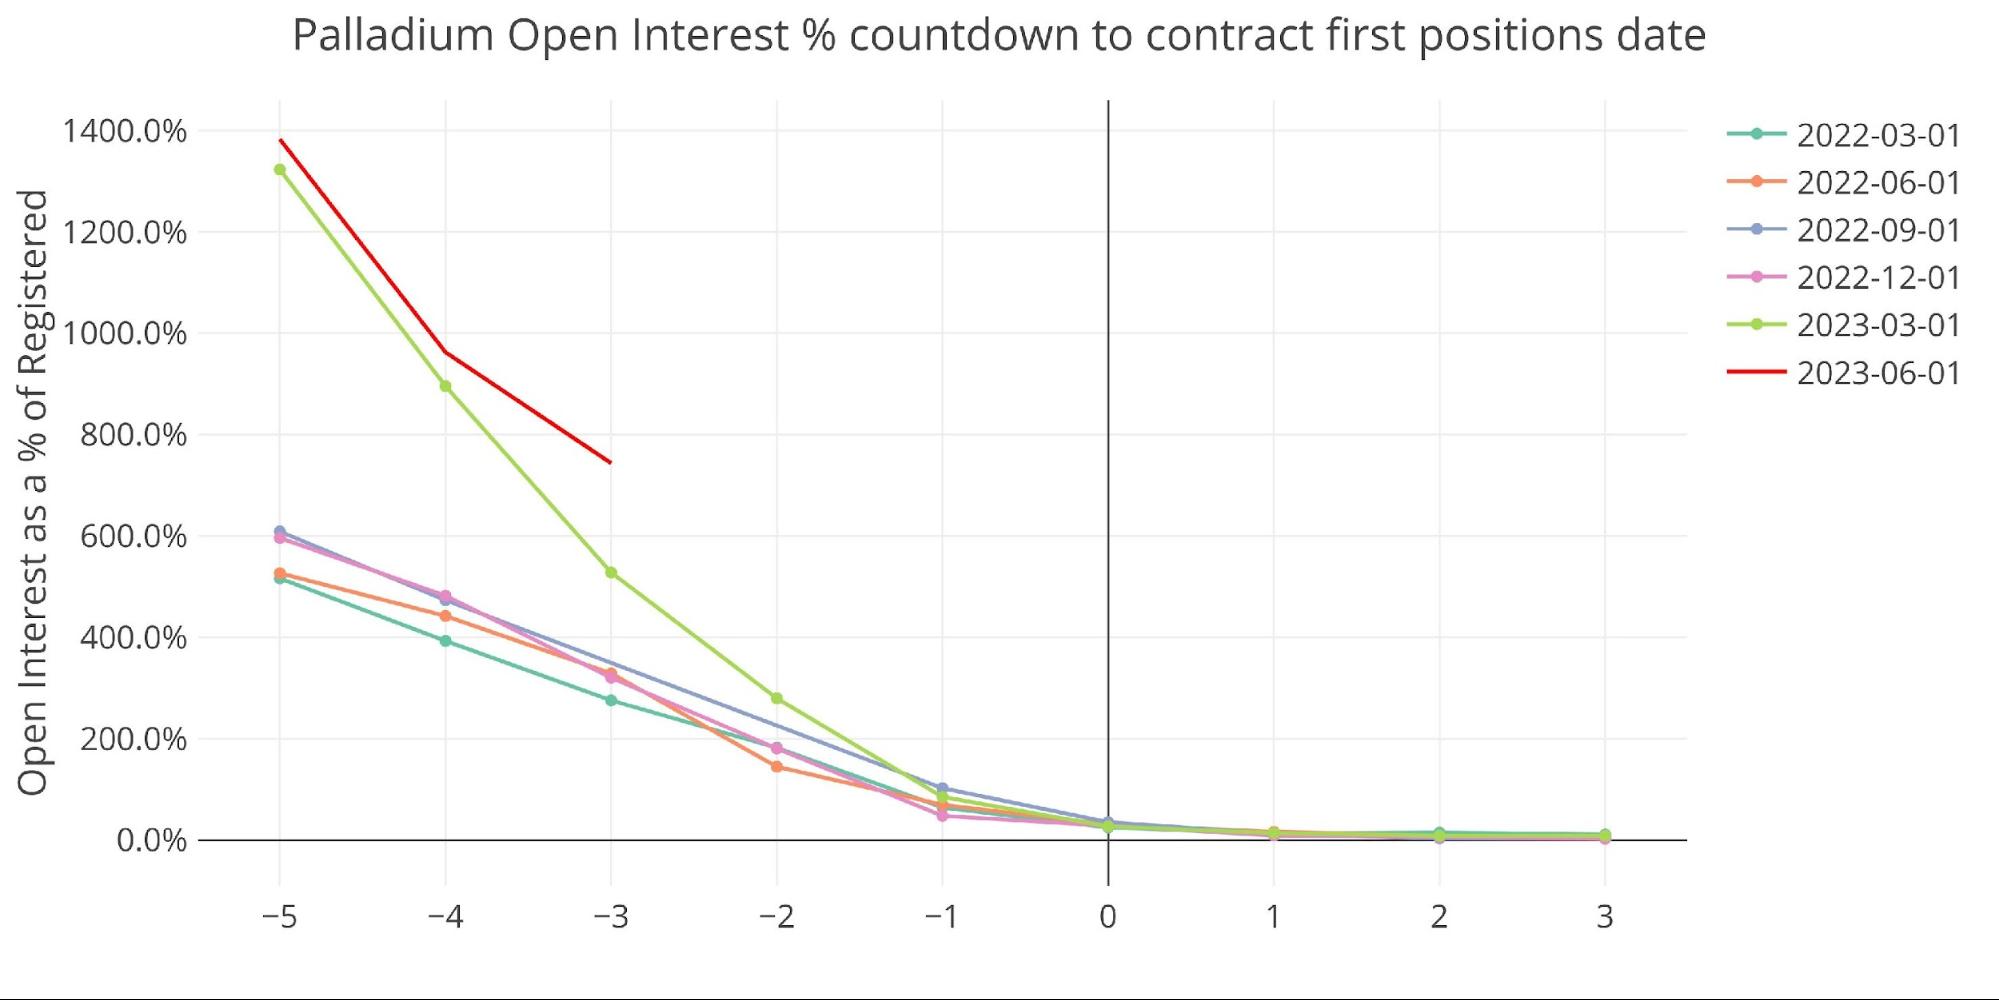
Figure: 25 Countdown Percent
Wrapping up
Delivery volume has dipped from the highs seen over the last few years, but this June is showing strength. The vault inventories have been badly depleted over the last several years which makes them ill-equipped to handle strong volume going forward.
As monetary policy starts working through the system, and the stock market feels the effects of a collapsing money supply, the months ahead could prove quite turbulent. In this environment, gold and silver will likely get a safe haven bid. When the Fed capitulates and begins fighting another crisis it created, the rush to precious metals will then accelerate rapidly. What investors will find out is that paper gold is very different than physical gold.
The Comex has been able to keep up the mirage of a stable system so far, but with depleted inventories, it won’t take much to create a full run on the Comex and empty the vaults. A strong June will be another step in that direction. When the rush happens, gold and silver will be much higher, if you can even find it in physical form! Prepare accordingly.

Figure: 26 Annual Deliveries
Data Source: https://www.cmegroup.com/
Data Updated: Nightly around 11 PM Eastern
Last Updated: May 24, 2023
Gold and Silver interactive charts and graphs can be found on the Exploring Finance dashboard: https://exploringfinance.shinyapps.io/goldsilver/

Call 1-888-GOLD-160 and speak with a Precious Metals Specialist today!
Buka akaun dagangan patuh syariah anda di Weltrade.
Source link