The data over the last several months continues to give insight into the market. November showed the market was in neutral, but then the December analysis correctly identified an impending move upwards, the January review called for a correction and then February concluded:
Currently, the data is very mixed with bullish, bearish, and neutral indicators. This can be frustrating. If I had to make a prediction that was not “it could go either way”, I am thinking the market is stuck in neutral for a few weeks and then finds a catalyst to move higher. Holding $1800 is key.
That was written almost 4 weeks ago, and the market got its catalyst with the SVB fiasco that has unfolded over the last week. And WOW, was it a catalyst. Gold last traded at $1993 on Friday, with a ton of momentum heading into the weekend. So, can the momentum hold? Can gold finally clear $2,000 and leave it in the dust?
While this analysis focuses on the technical picture, it’s very possible that the fundamentals finally come into play and dominate the market. Considering the vault run well underway at the Comex, it’s only a matter of time until the Comex has its own SVB moment. At that point, gold could blow right past every price target out there right now. Until then though… let’s see what the technicals are saying.
Resistance and Support
Gold
Gold sliced through $1900 like a hot knife through butter. On Friday, March 8th, gold was trading at $1818, it finished 9 days later on March 17th trading at $1993. Typically, this would scream “too far too fast”, begging for a pullback. $2000 becomes the next major test for gold.
It is unlikely the price will meander in the $1950-$2000 range for long. Either the price is entering a new paradigm where $2200 becomes the next medium-term target or things calm down and $1900 is tested as early as this week. Looking at only the technicals, the latter scenario is far more likely as a big move usually needs time to consolidate.
Outlook: Bearish
Silver
Silver is similar to gold for now. It has not retested its January high which means the up move has not been as dramatic, which requires less need for consolidation. Thus:
Outlook: Neutral to bearish
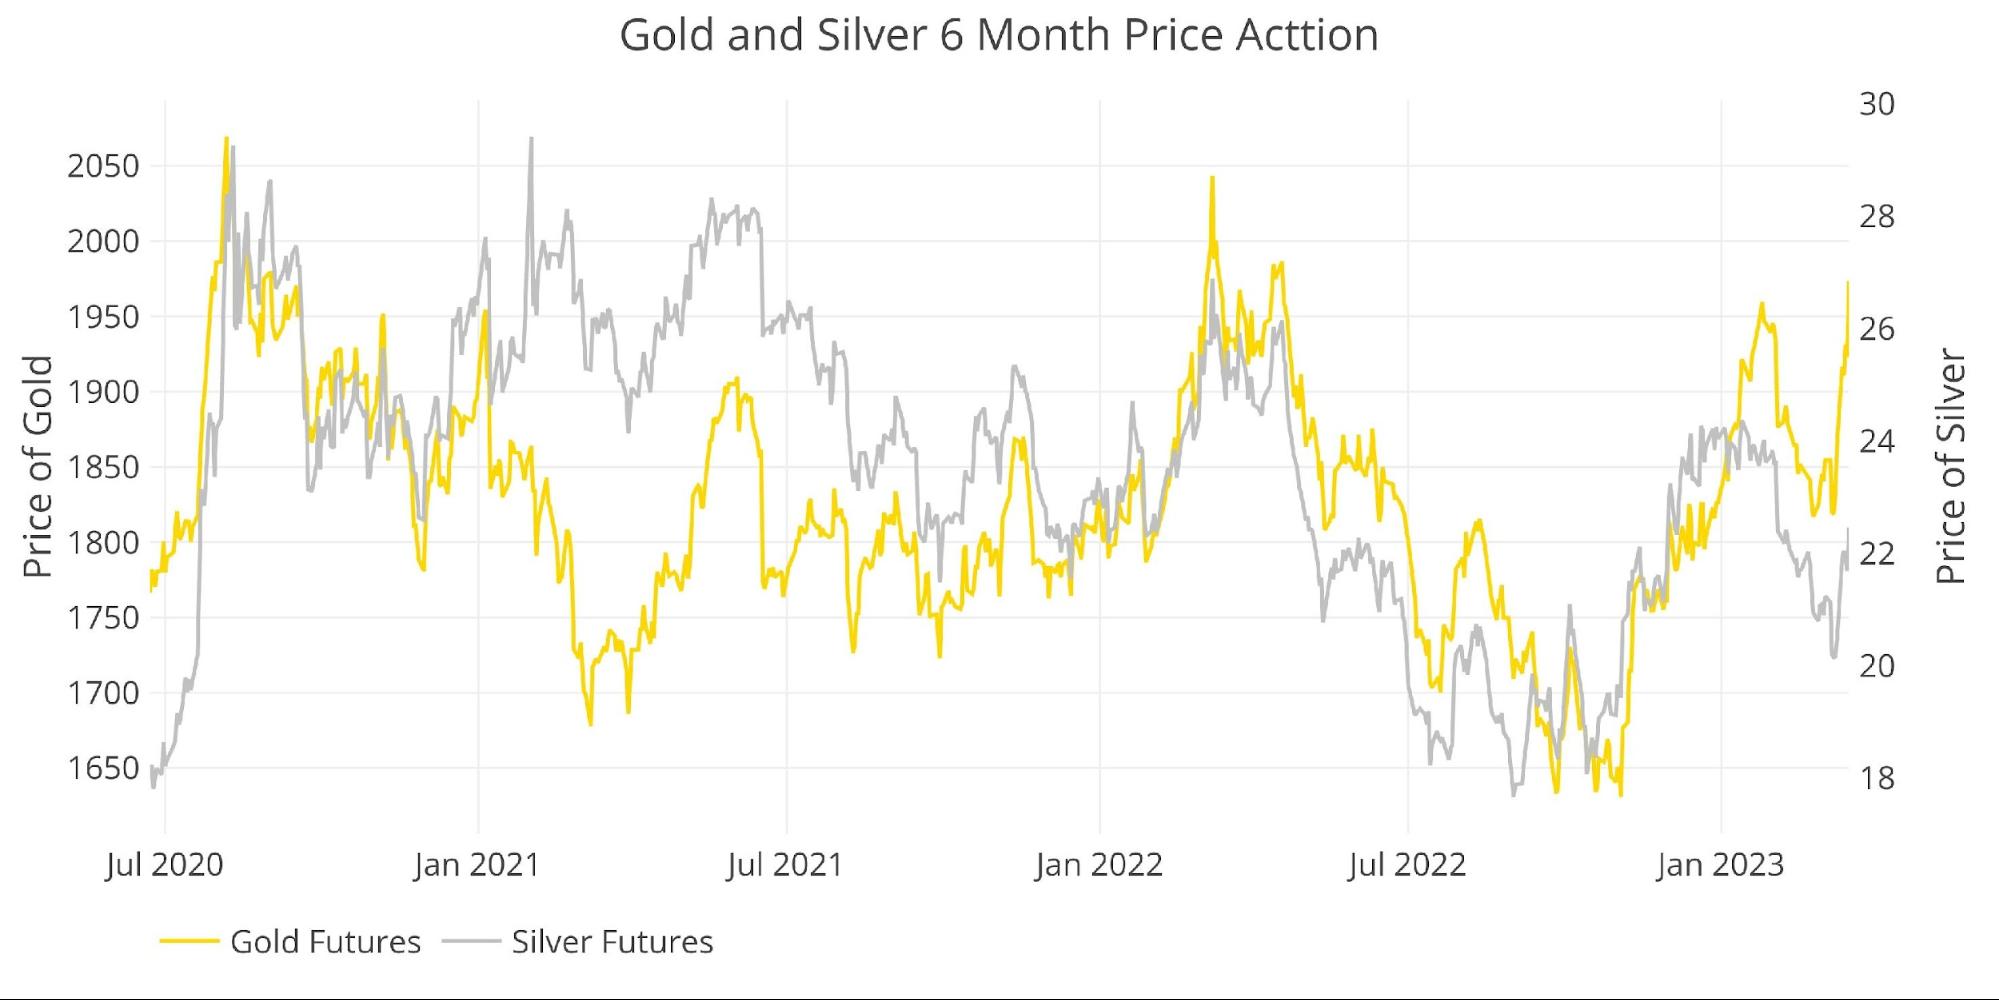
Figure: 1 Gold and Silver Price Action
Daily Moving Averages (DMA)
Gold
In the February analysis, while I was calling for a needed catalyst, I did note that “I also do not see an imminent move higher through $1900”. Part of the reason is the chart below. For a healthy correction, the 50DMA should drift back toward the 200DMA before moving back up. The current move has been so fast and furious that it did not give enough time for proper consolidation.
The price remains well above the 50 DMA and 200 DMA which will keep the bullish momentum going over the medium-term, but the short-term is still looking like consolidation is needed, likely near or below $1900 at a minimum.
Outlook: Short-term bearish, medium-term very bullish
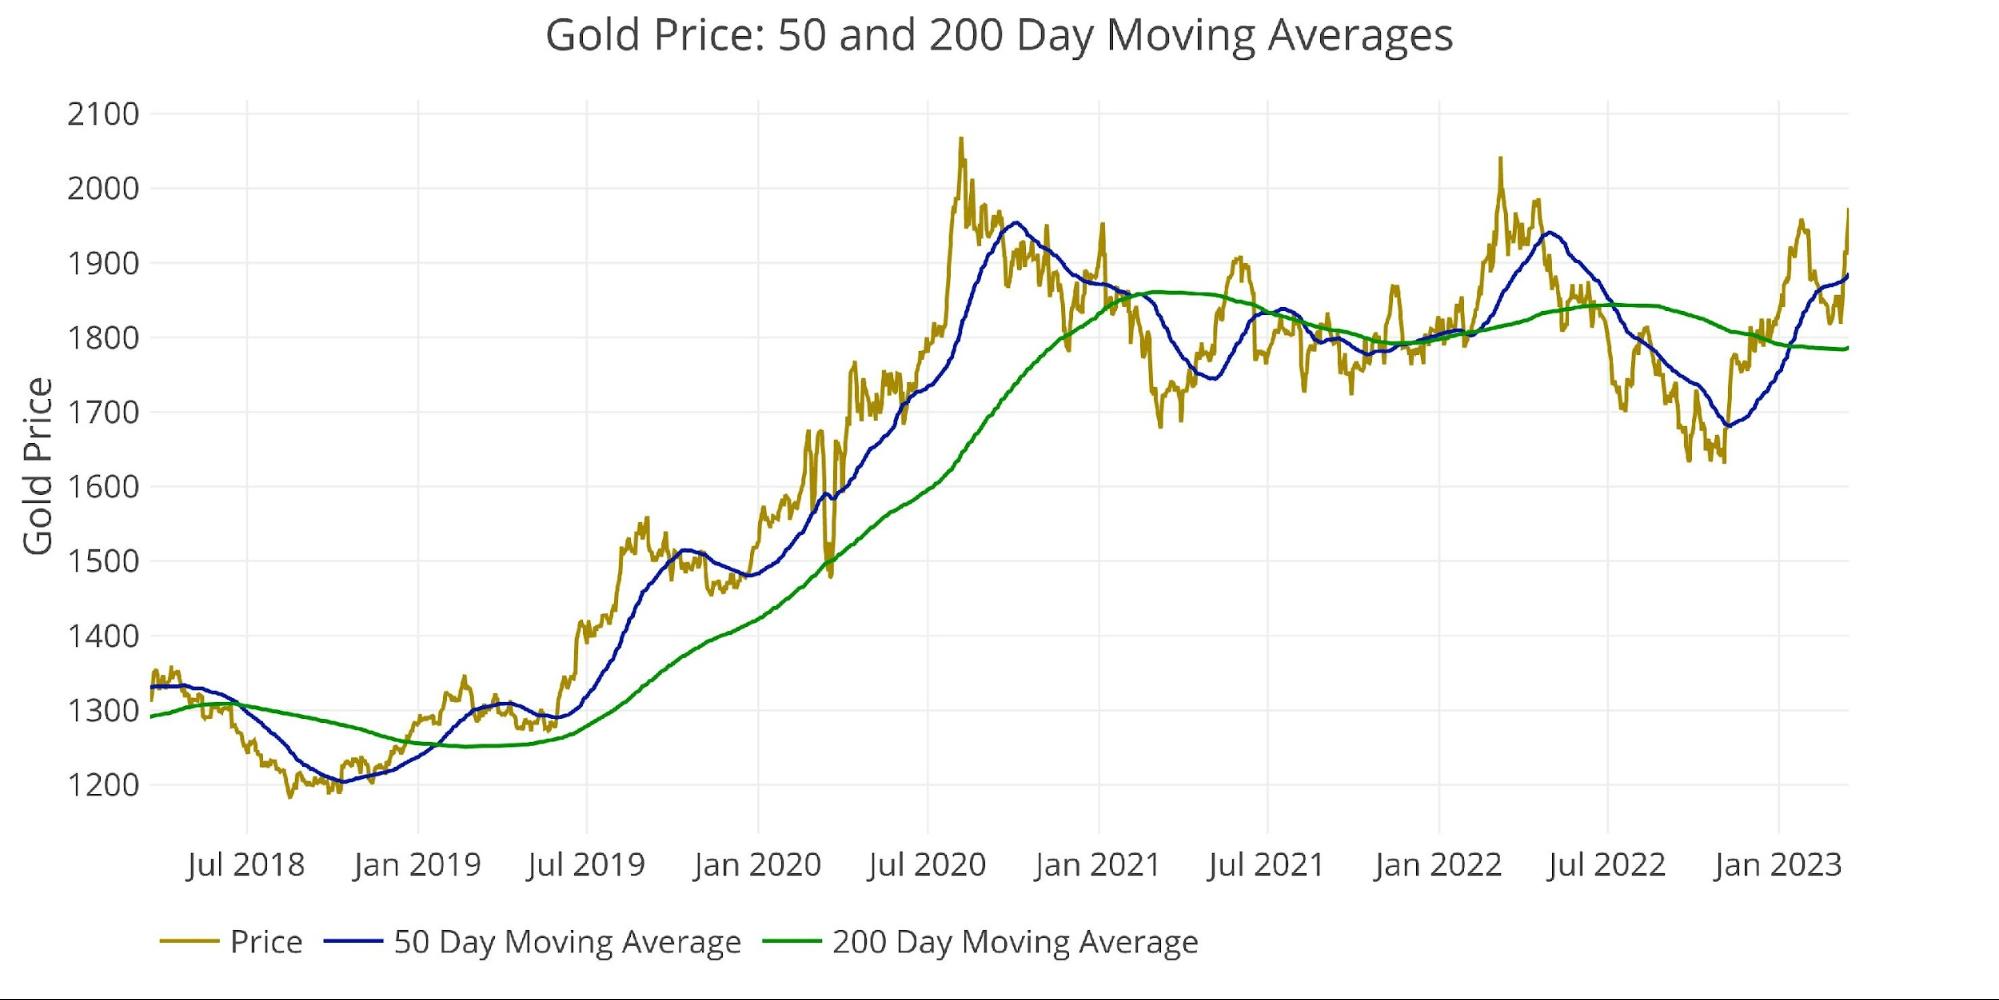
Figure: 2 Gold 50/200 DMA
Silver
Silver looks far less overbought and looks ready for a burst higher through the 50 DMA.
Outlook: Bullish
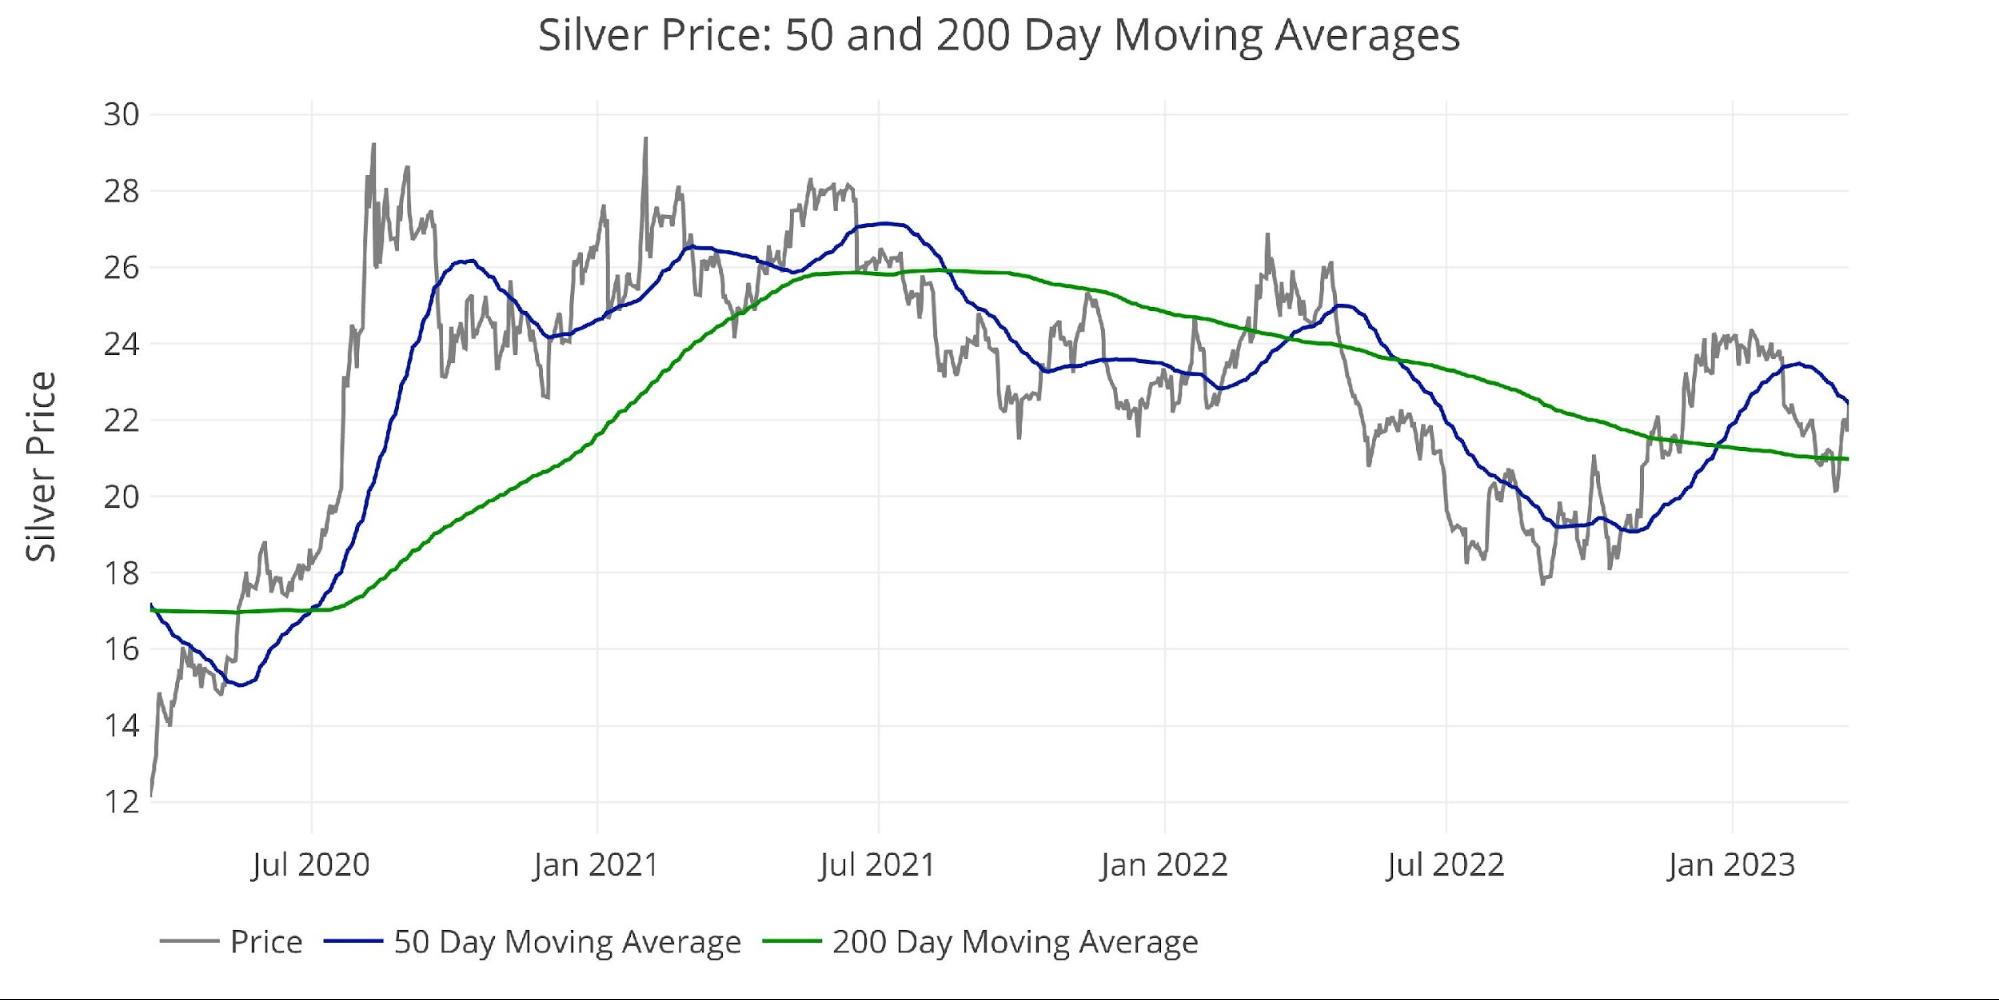
Figure: 3 Silver 50/200 DMA
Comex Open Interest
The next three charts are perhaps the most bullish I have seen in a long time… let me explain.
Gold
The move in gold yesterday was not driven by an explosion in open interest. The futures market saw minimal change in open interest this whole week. The second chart zooms in on the last 90 days where it becomes clear that the move up in open interest mainly completed by March 10th before the gap up in price. In fact, the gold price kept rising even while open interest fell by 13k contracts in the middle of this week. This means that the price move this week was not driven by Comex futures traders.
As the first chart below shows, open interest is still closer to the bottom of the range than the top. This means the futures traders are not on board the bullish train. They have two options in the week ahead, if they get on board, the gold price could go ballistic… or they could take the other side of the trade, explain the recent spike as a one-off fear trade and short the move. This would be very dangerous and could immediately trigger a short squeeze if they are wrong.
Outlook: Very Bullish
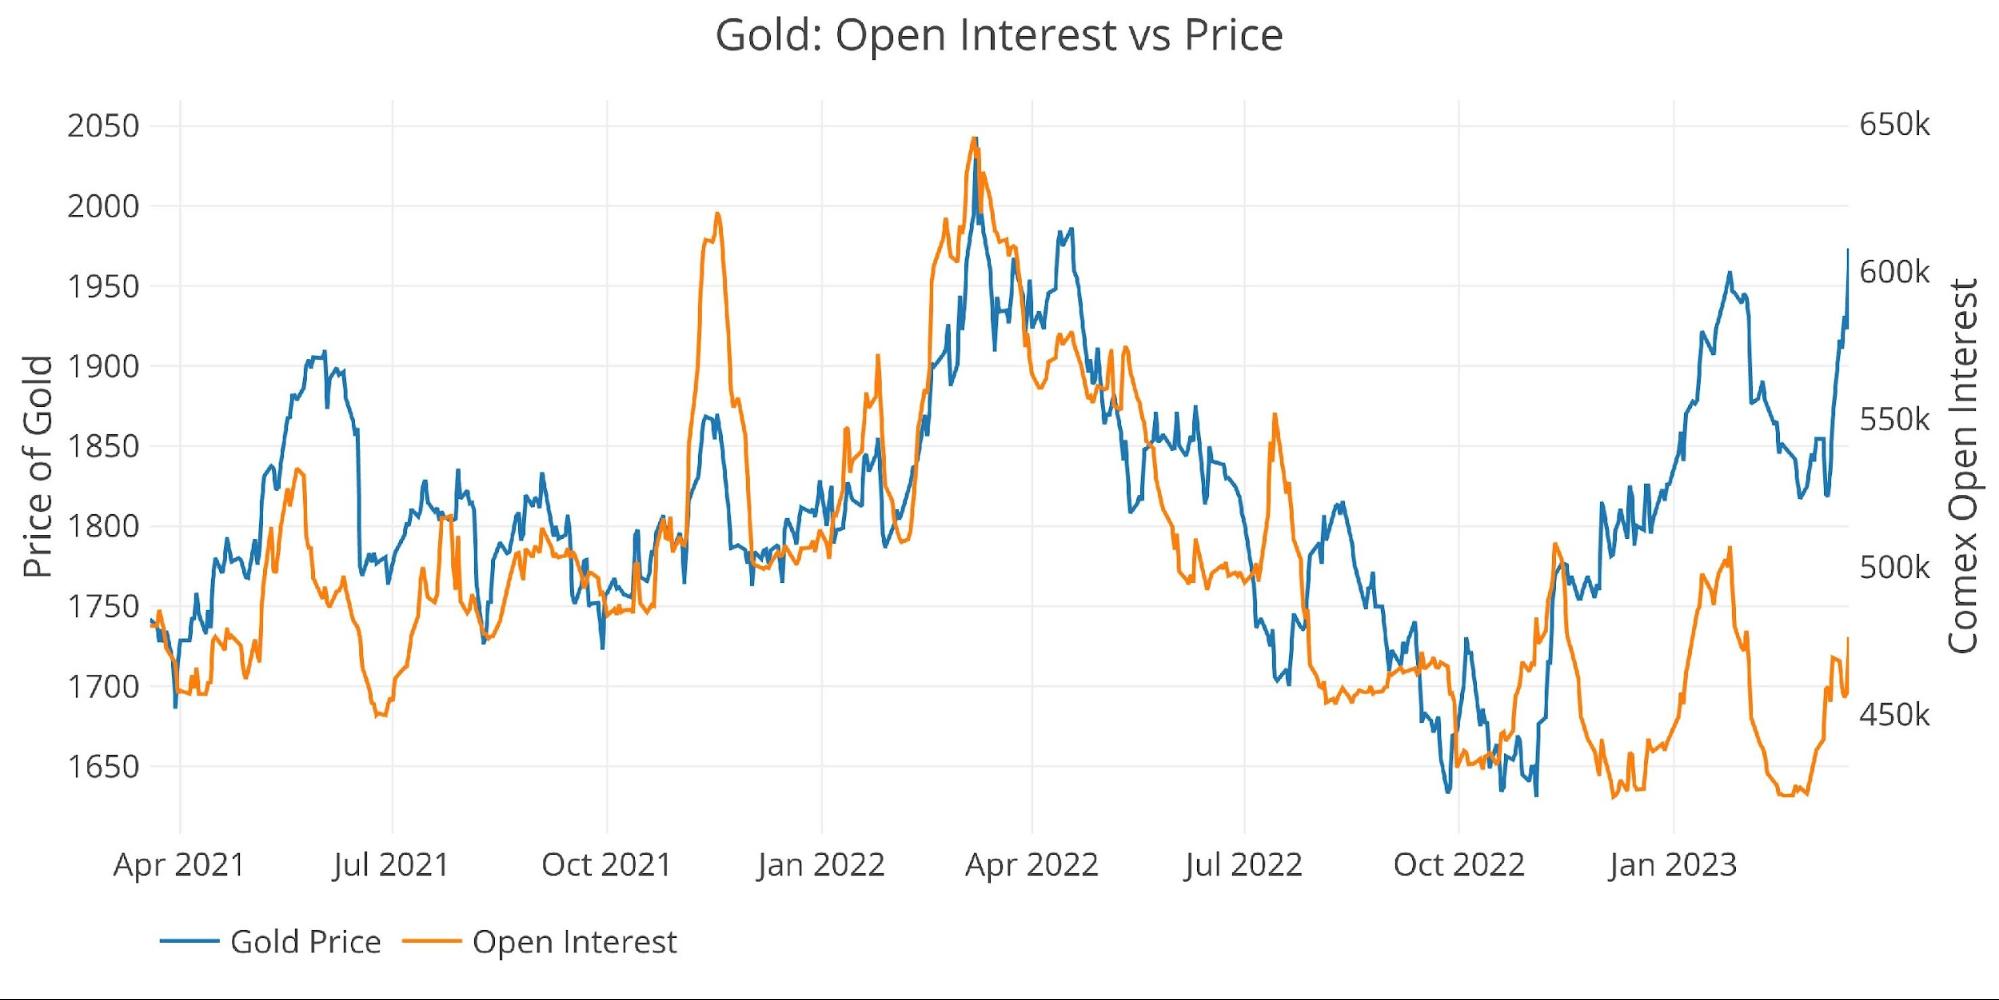
Figure: 4 Gold Price vs Open Interest
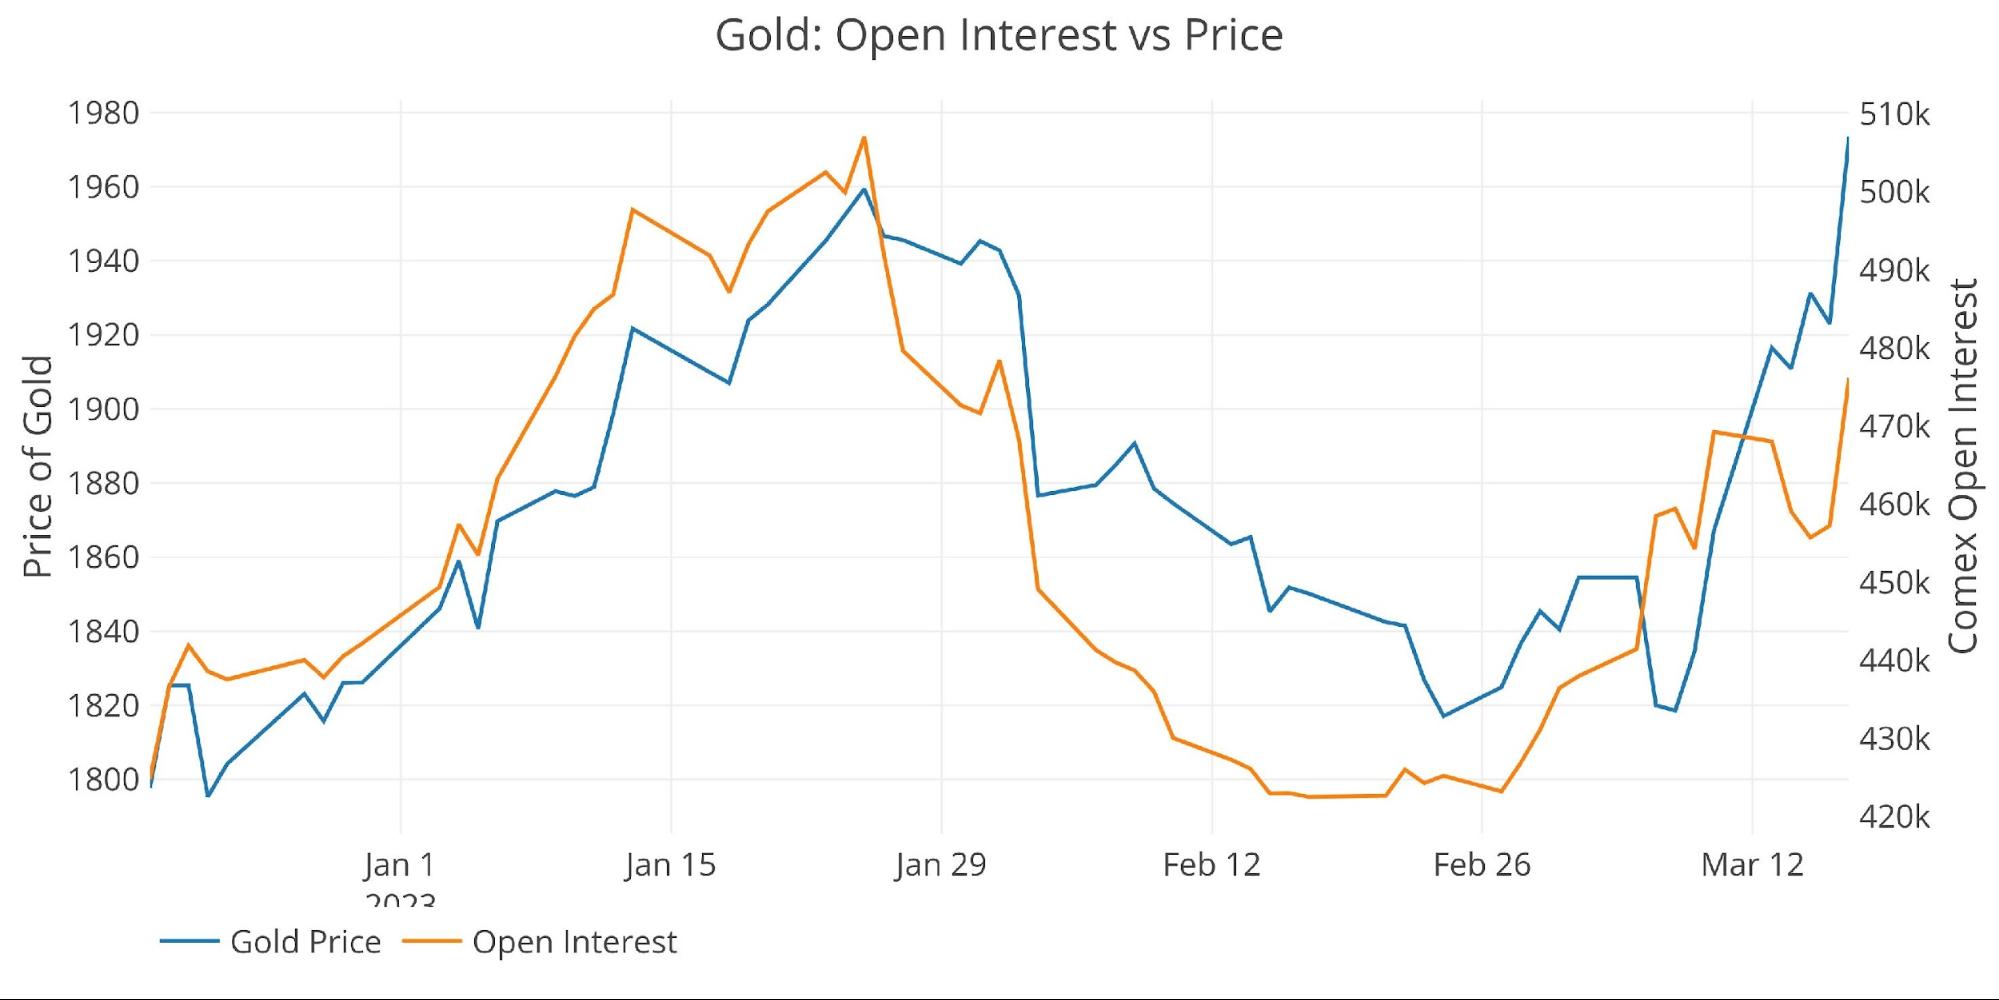
Figure: 5 Gold Price vs Open Interest
Silver
Silver open interest actually decreased this week. Total open interest fell 8k contracts or 6% in a week whereas silver rose almost 10%. We know for sure that long traders were not pushing the price higher. Thus, the move this week was either shorts closing contracts or price discovery happening elsewhere (e.g., Asian or physical markets). If it wasn’t from shorts buying back their position, then it means that the down move in open interest were long traders taking profits.
It is too early to conclude definitely who drove the price this week (we know the “what”). No matter the case, open interest now sits at the lowest level since January 2014. This means that there is far more money on the sideline than in the market. If that money enters the market, prices could easily blast past $25. Stay tuned!
Outlook: Extremely Bullish
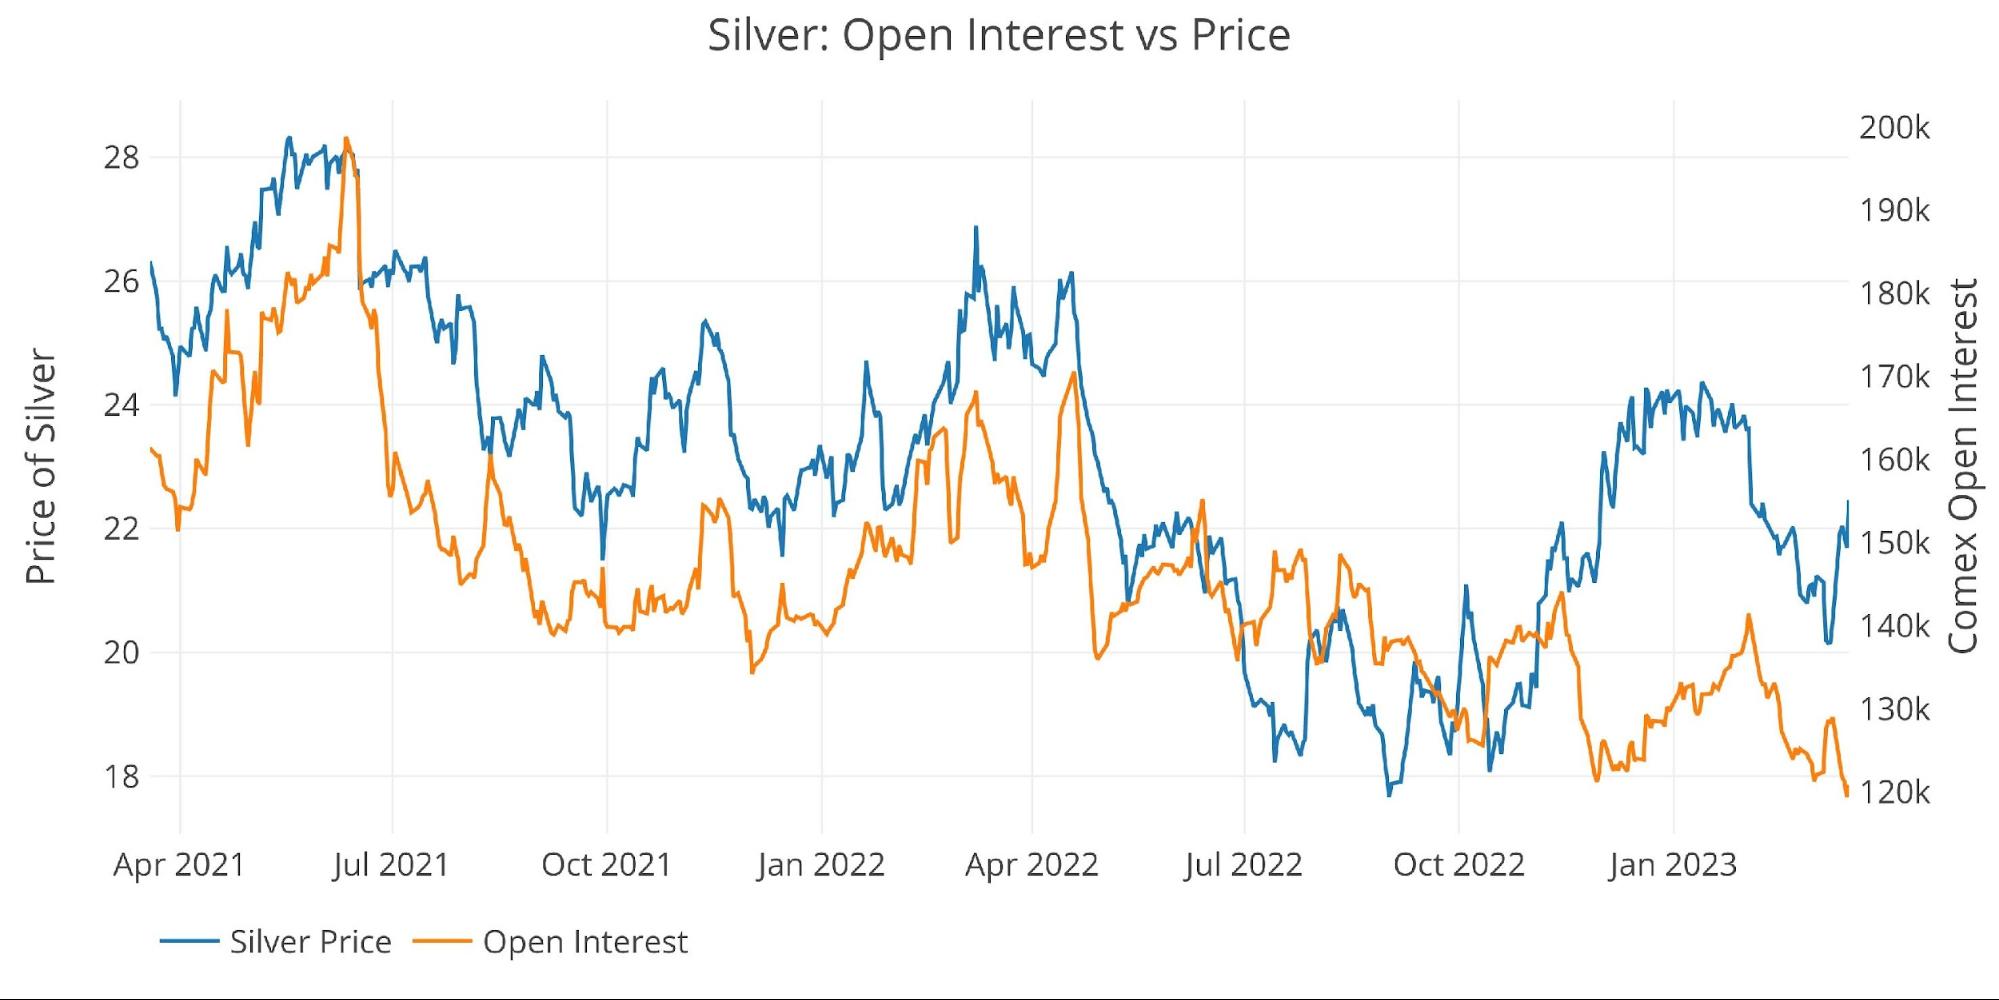
Figure: 6 Silver Price vs Open Interest
Margin Rates and Open Interest
Gold
Another major bullish sign is that margin rates were raised this week and it did absolutely nothing to blunt the move higher. In fact, margin rates have not been this high since September 2021. The CFTC still has plenty of room to increase margin rates, but as mentioned in the section above, the futures market does not appear to be driving the price right now. This means increases in margin might do little to blunt the move higher.
Outlook: Bullish

Figure: 7 Gold Margin Dollar Rate
Silver
Silver has not seen margin rates rise nearly as high as gold. Rates are now as high as they were a year ago. Similar to gold though, if futures traders are not driving the price right now, then an increase in margin will do very little to blunt any move higher. Margin Rates were raised on March 15th. If anything, this could have been what drove some shorts out of the market. This could even imply that higher margin rates will only squeeze the shorts more!
Outlook: Bullish

Figure: 8 Silver Margin Dollar Rate
Gold Miners (Arca Gold Miners Index)
The gold miners have been consistently leading the price of gold in both directions for years. It was not until the move on Friday where miners finally caught a bid higher, which means that in the previous 5 sessions, traders were seeing the price action in gold as a temporary flight to safety. With the major bid on Friday, stock traders may be signaling that they believe the current move in gold has legs.
Outlook: Bullish
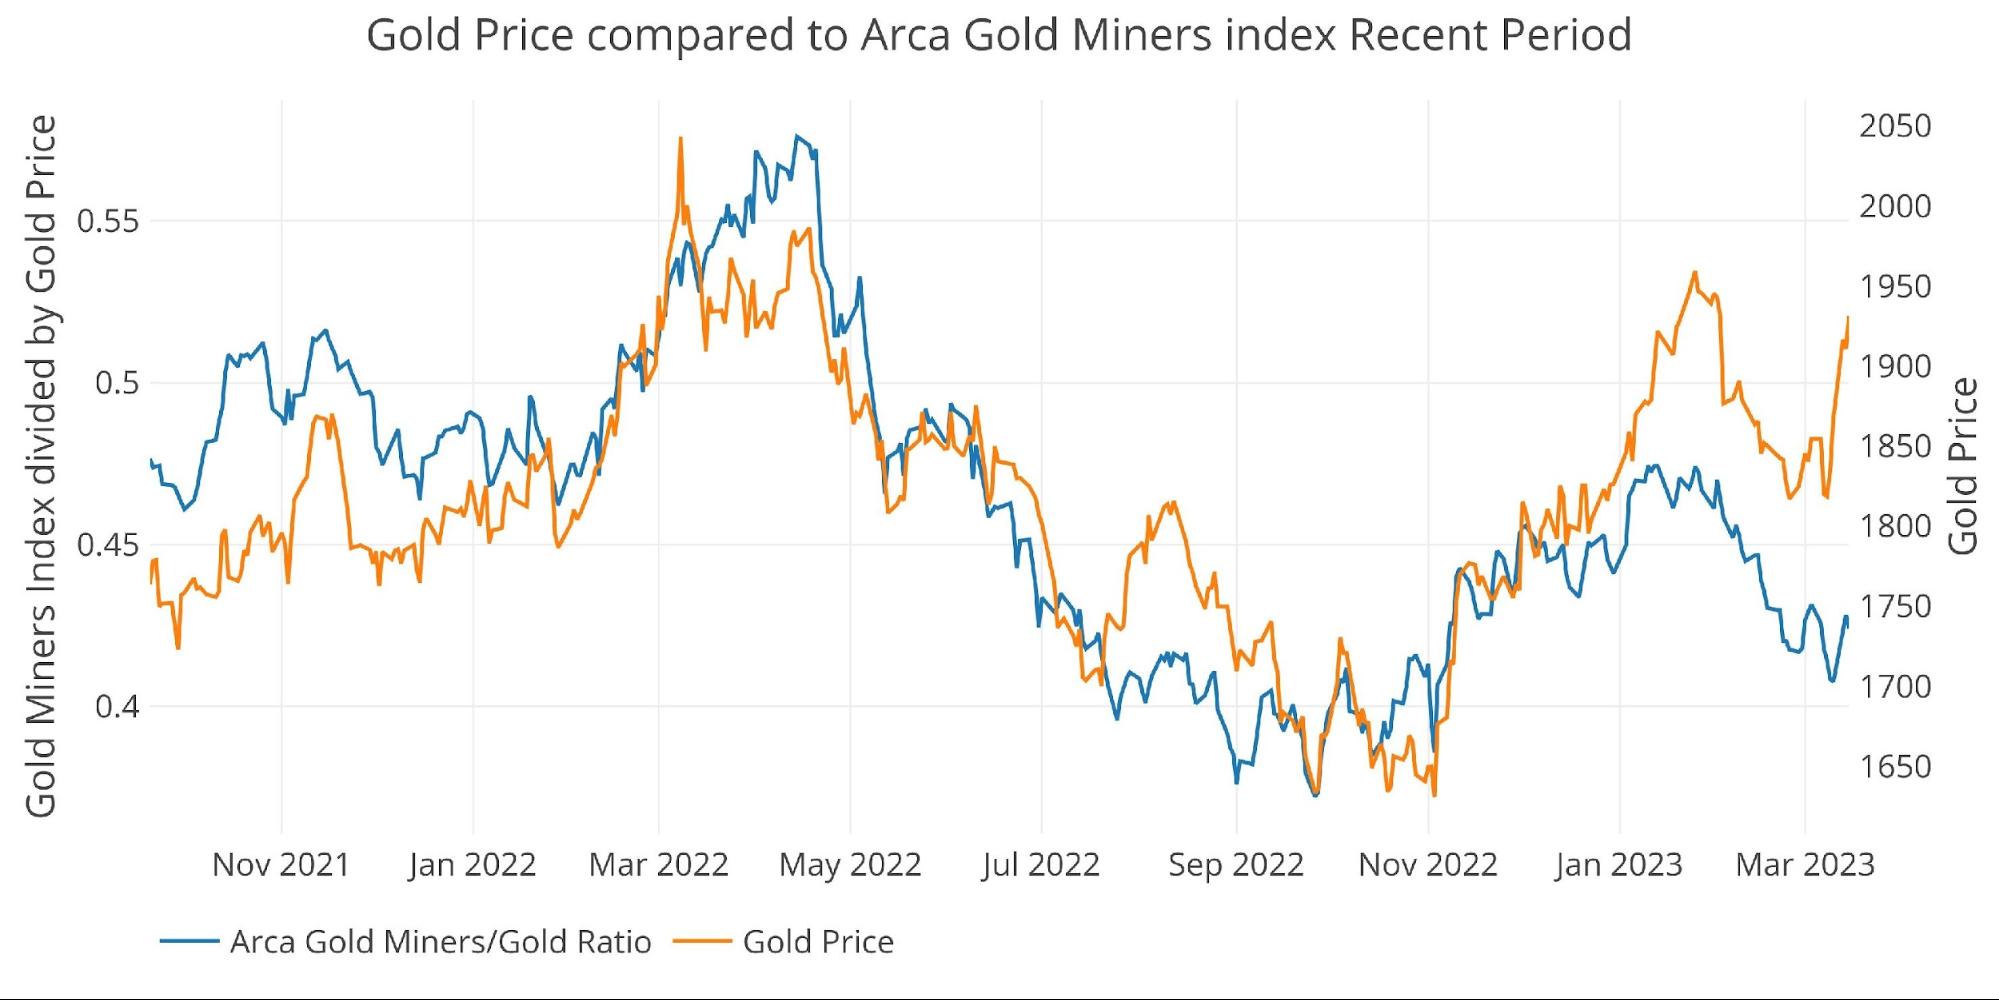
Figure: 9 Arca Gold Miners to Gold Current Trend
Similar to gold, this coming week is likely important for the miners. If both can keep rallying, then we could be setting up for a big move higher. The chart below shows the historical relationship. The miners have been absolutely punished over the last decade as stock traders have never bought into the current move in gold. If gold is finally able to leave the 2011 high in the dust and consistently make new highs, then stock traders will have no choice but to buy into the move. Considering how much catching up the miners have, the move higher could be absolutely explosive.

Figure: 10 Arca Gold Miners to Gold Historical Trend
Trade Volume
Love or hate the traders/speculators in the paper futures market, but it’s impossible to ignore their impact on price. The charts below show more activity tends to drive prices higher.
Volume in gold spiked this week to the highest point since last March. Since 2021 started, these volume spikes in gold have been one and done. Could the market finally start drawing more attention in the weeks ahead?
Silver did not actually see a major spike. This week was even below some of the weeks in February. This gives silver the edge in what is likely to move higher next.
Neutral
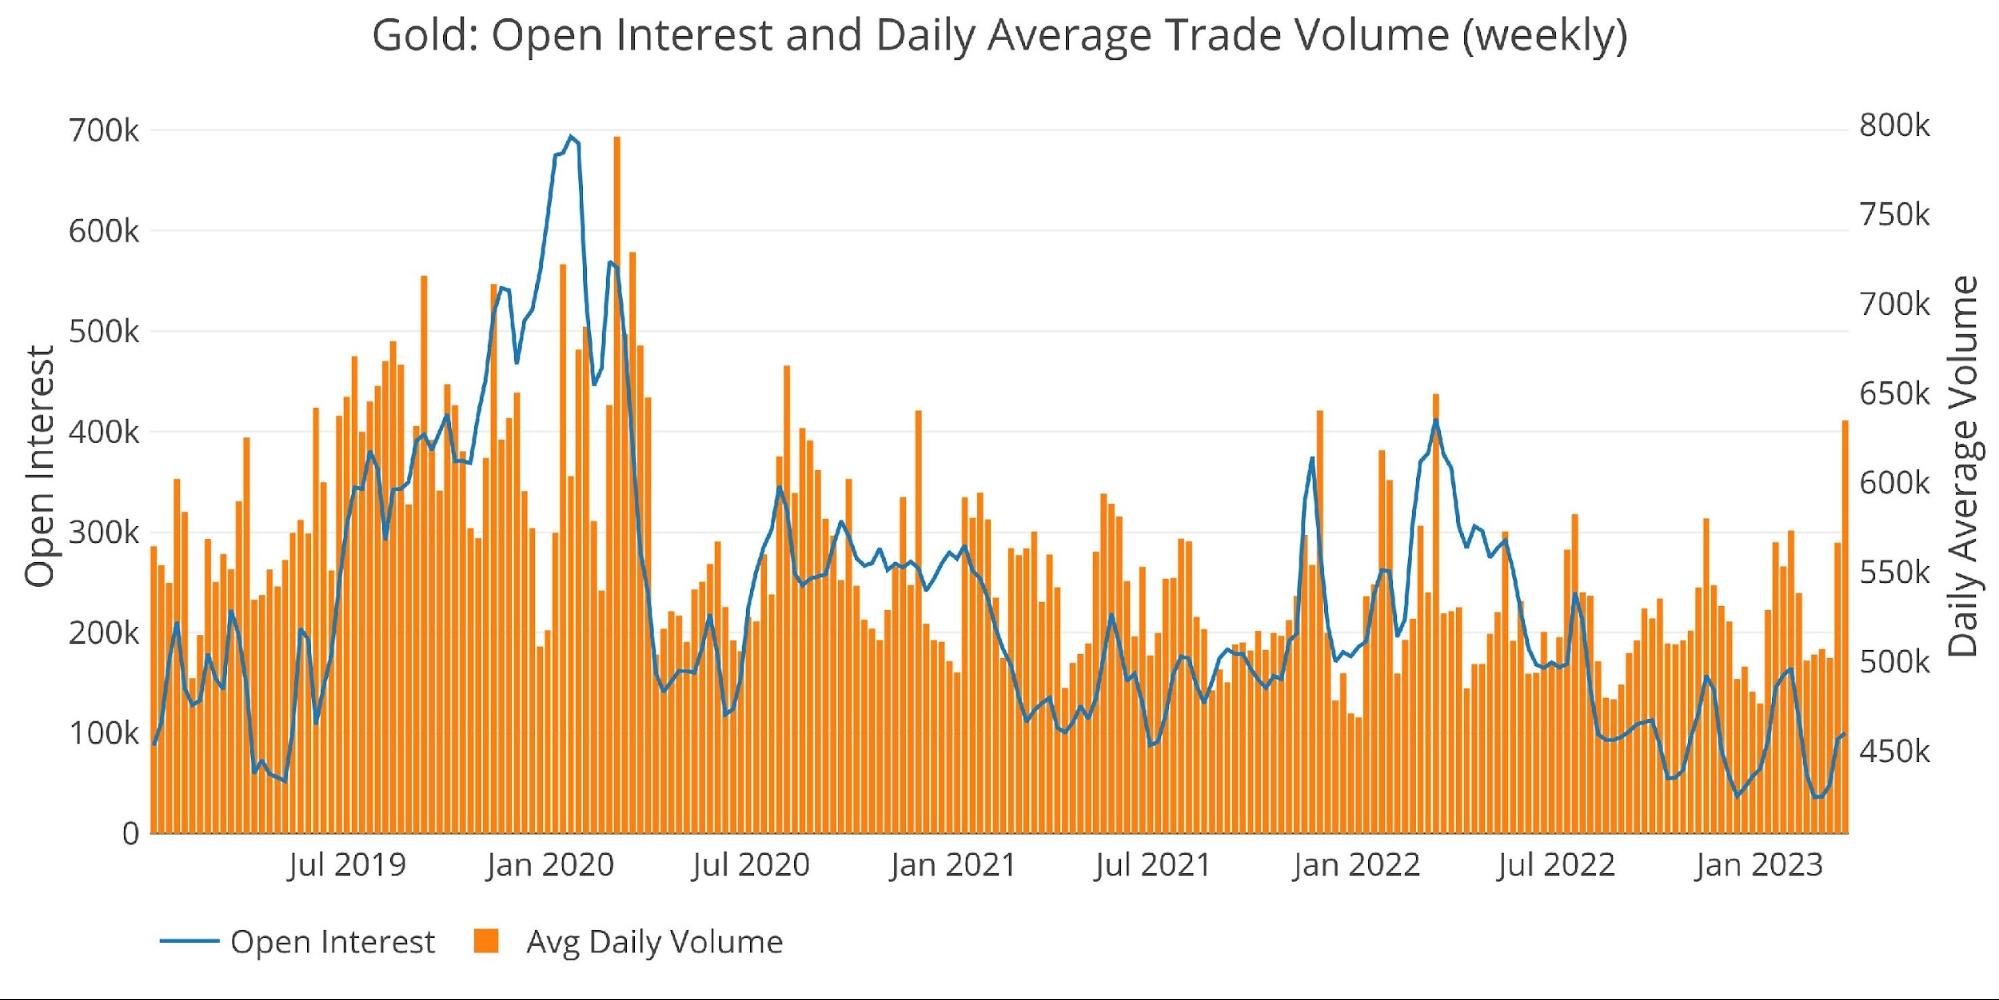
Figure: 11 Gold Volume and Open Interest
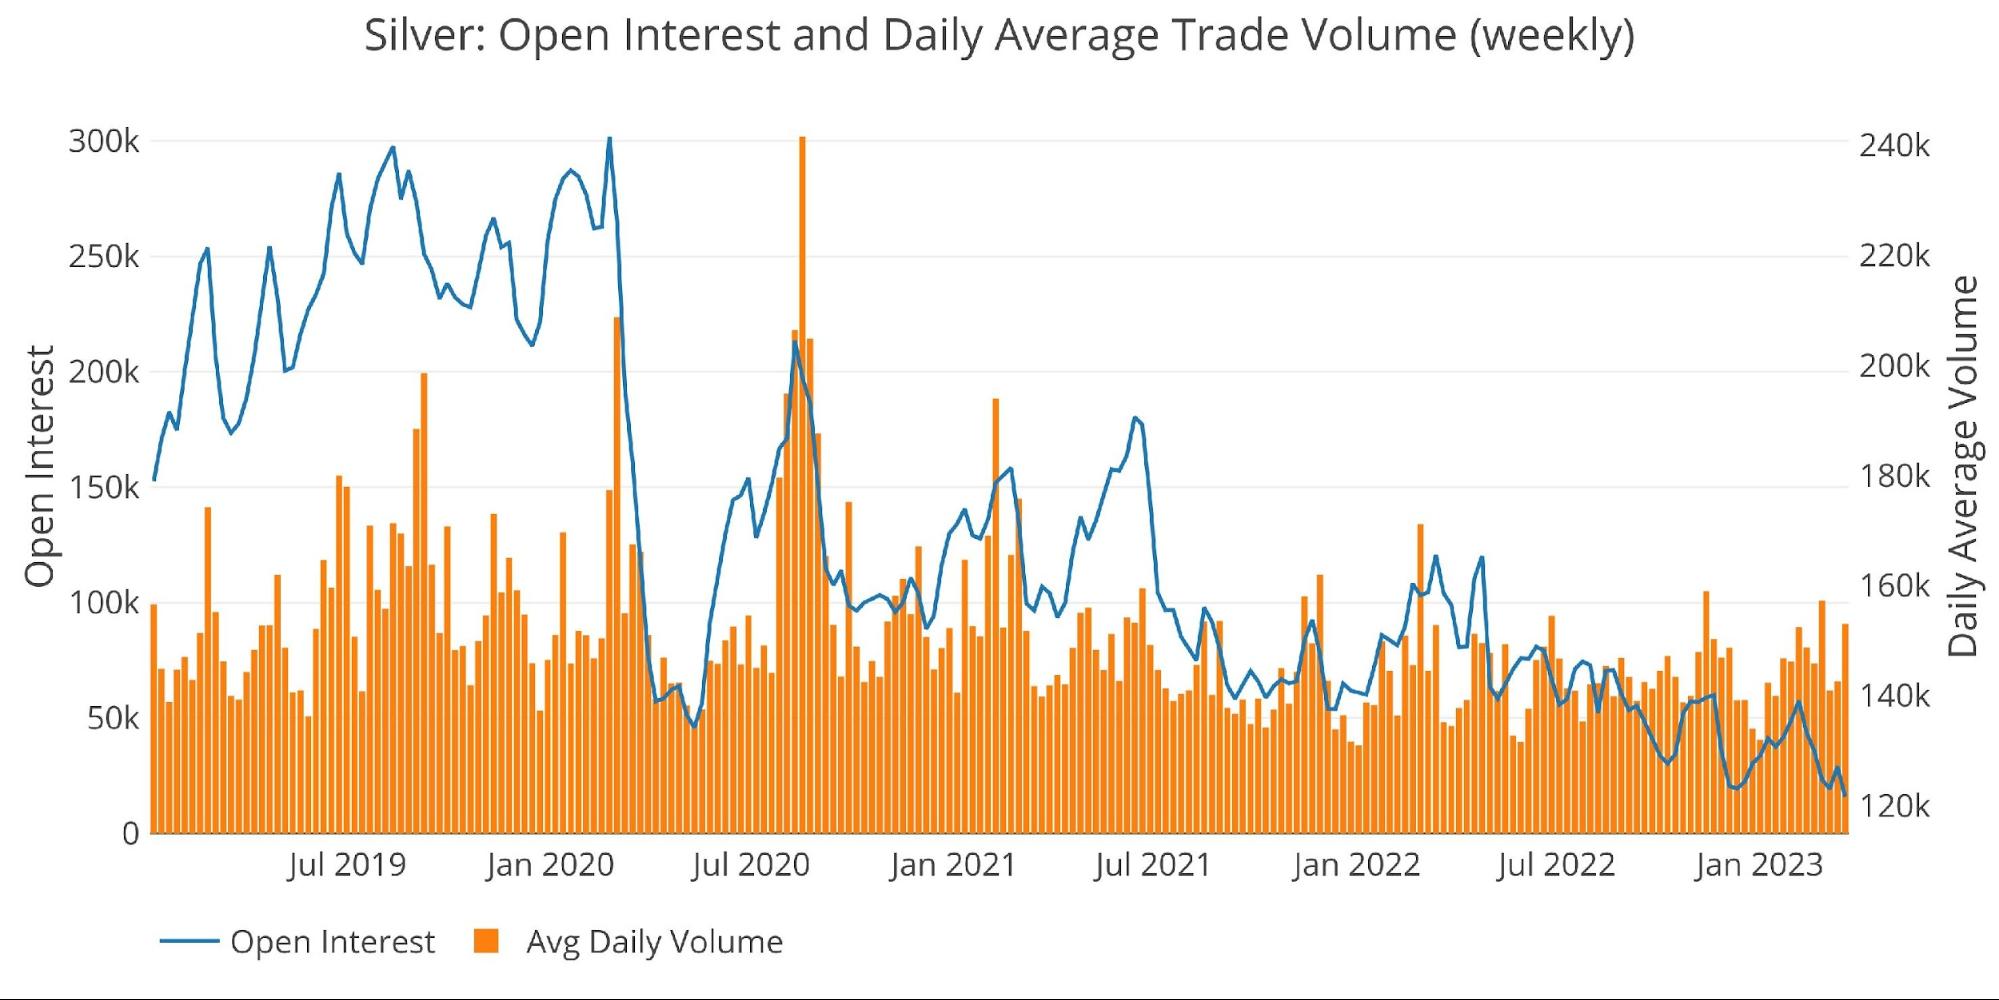
Figure: 12 Silver Volume and Open Interest
Other drivers
USD and Treasuries
Price action can be driven by activity in the Treasury market or US Dollar exchange rate. A big move up in gold will often occur simultaneously with a move down in US debt rates (a move up in Treasury prices) or a move down in the dollar.
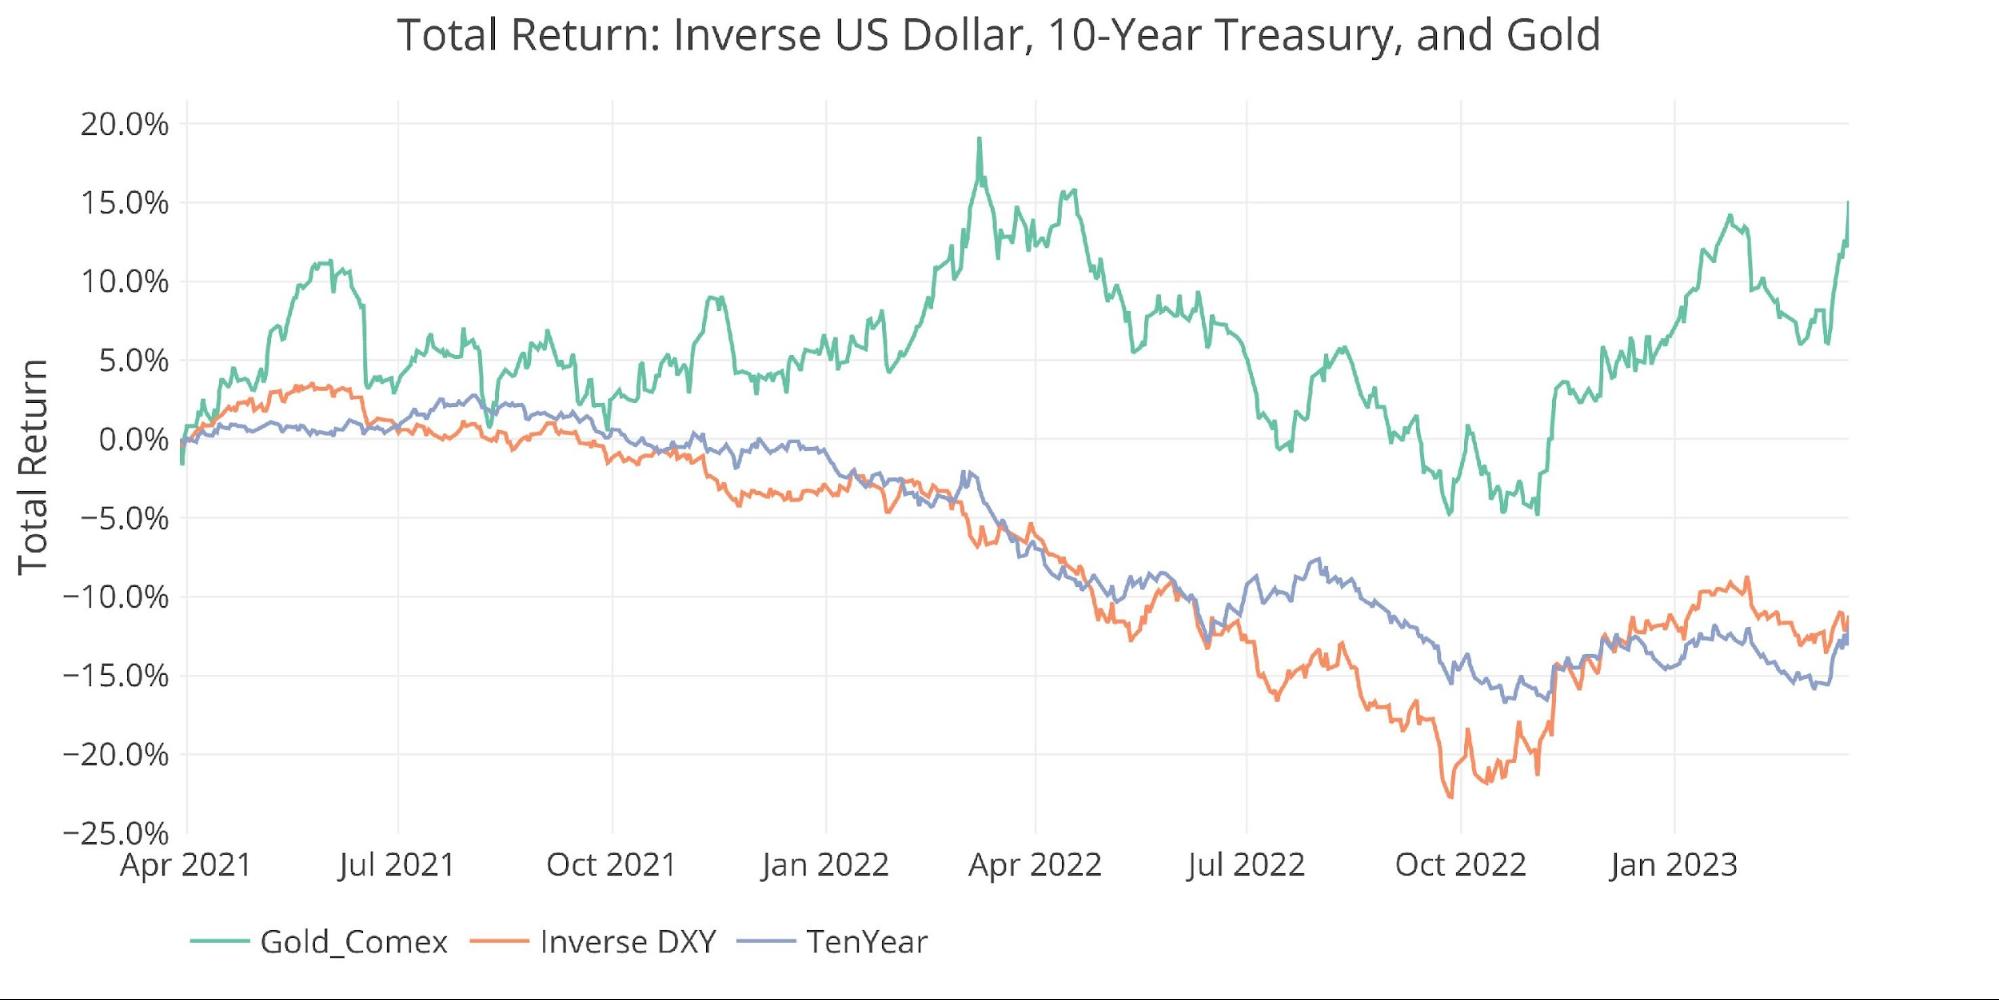
Figure: 13 Price Compare Inverse DXY, GLD, 10-year prices
This week, the dollar finished about where it started. Gold and bonds did not, with both rallying hard. Typically, these three markets move together so when one diverges it’s usually best to follow the action in the other two. It’s likely the DXY was facing conflicting forces from a “flight to safety” and a concern about an impending Fed pivot. The long dollar trade still looks to have run its course with $100 as the next big target. If the dollar moves lower, then expect the rally in gold to continue.
Outlook: Bullish
Gold Silver Ratio
The gold-silver ratio has once again become overextended in favor of gold. The data above suggests that silver has some catching up to do rather than a fall in gold prices.
Outlook: Silver bullish relative to gold

Figure: 14 Gold Silver Ratio
Bringing it all together
The table below shows a snapshot of the trends that exist in the plots above. It compares current values to one month, one year, and three years ago. It also looks at the 50 and 200-daily moving averages. While DMAs are typically only calculated for prices, the DMA on the other variables can show where the current values stand compared to recent history.
-
- Gold rallied 6.9% since last month while silver “only” rallied 4.1%
- Silver open interest ratio has fallen by 11.2% over the last month
-
- Open interest is well below the 50 and 200 DMA in silver but the opposite is true in gold
- Open interest in both metals is more than 20% below where it was last year
-
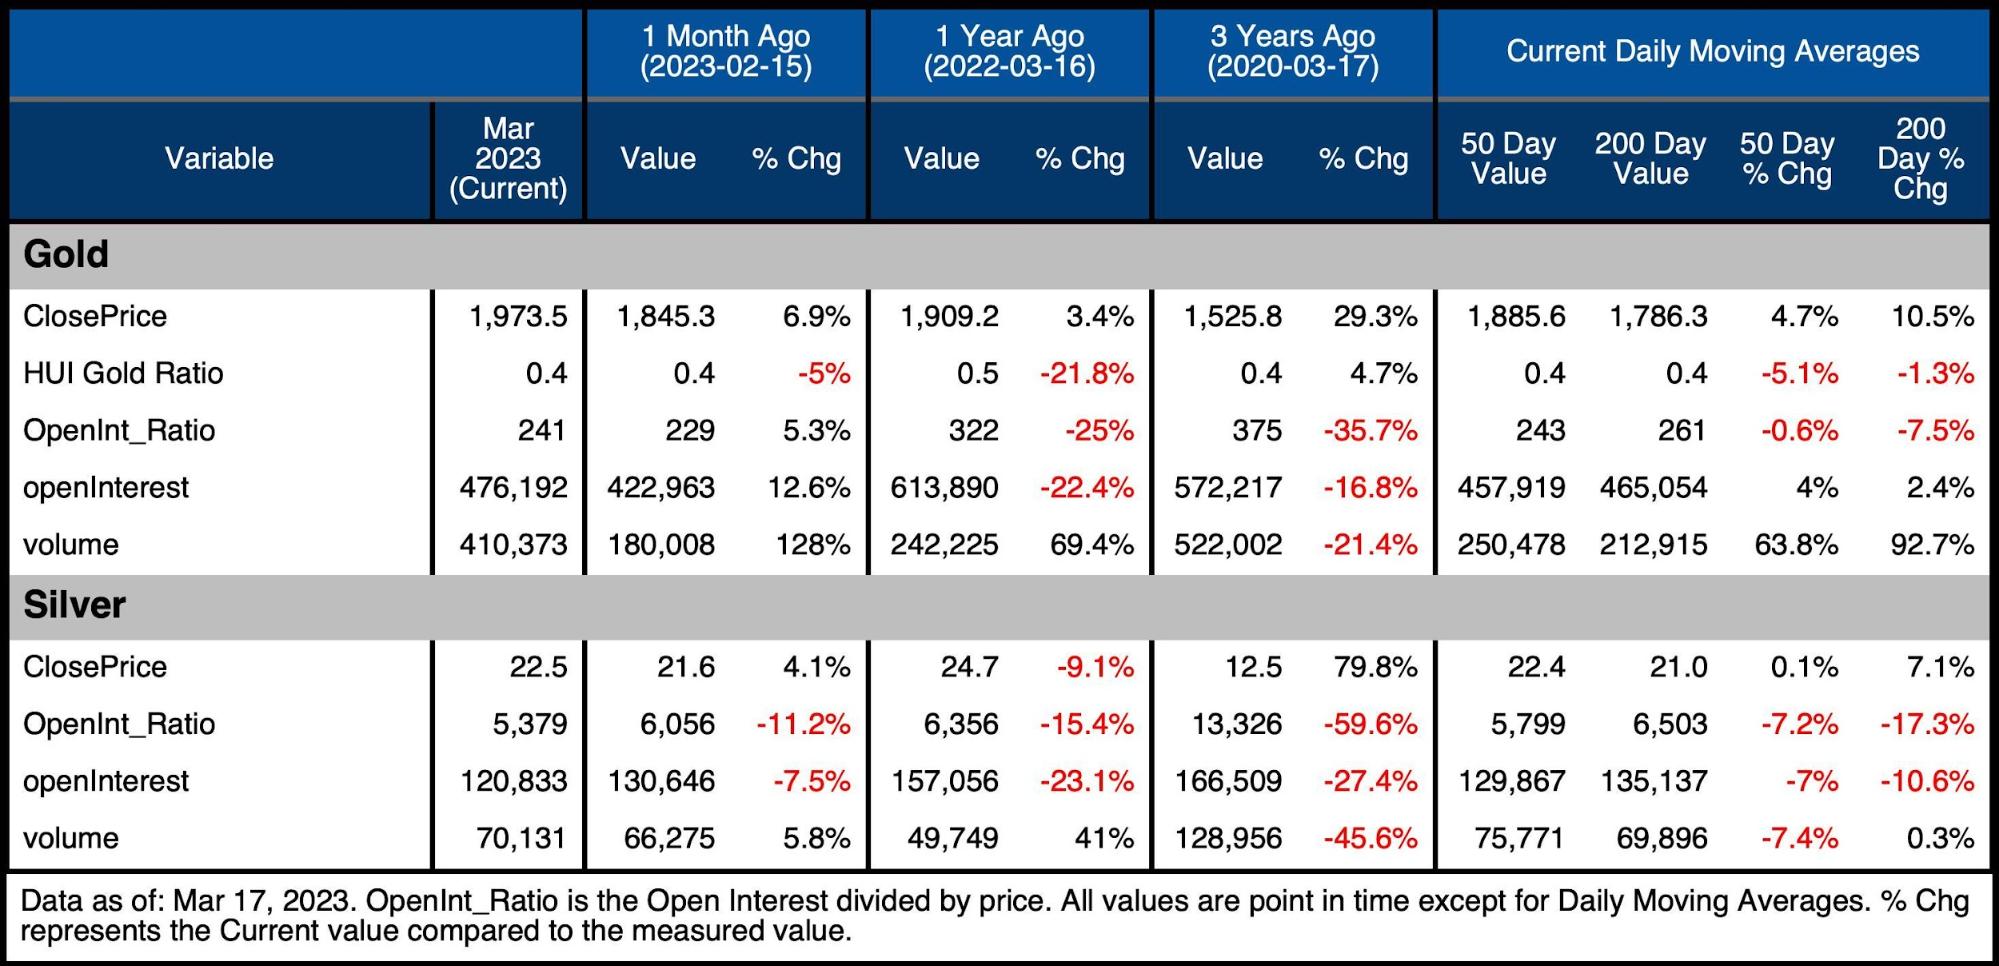
Figure: 15 Summary Table
Wrapping up
The price indicators are quite bearish at the moment. Price spikes like the one seen this week are typically unsustainable. The technical price chart is calling for a pullback. However, many of the other indicators are quite bullish. While not definitive, this leads me to conclude we might be on the cusp of a shift in the market where fundamentals and physical supply dominate the price action rather than technicals in the paper market.
If this is the case, then anyone short of precious metals had better watch out! I think we will know within two weeks which direction we are headed. If gold gets through $2,000 with conviction, then it would be wildly bullish. If it can’t get through $2,000 expect a test of $1,900 in very short order. Either way, we won’t be waiting long to get an answer. Obviously, the Fed meeting this week is the elephant in the room which makes this week probably the most important week for gold in years. We could have just seen yet another head-fake in this decade-plus-long correction in gold, or we could have just seen the start of the next parabolic move.
Either way, the Fed is running out of time. They bought themselves some breathing room with their incredibly creative bailout solution, but that only slapped a Band-Aid on one issue. If regional banks continue to see massive outflows, then more bank failures could materialize in the weeks ahead. If not bank failures, something else is likely to break… then the Fed is out of tricks. That is probably why the market is pricing in 50-100bps of rate cuts by year-end. If the market has figured this out, then it might not matter what Powell does or says this week, gold could be early in the next move higher.
Data Source: https://www.cmegroup.com/ and fmpcloud.io for DXY index data
Data Updated: Nightly around 11 PM Eastern
Last Updated: Mar 17, 2023
Gold and Silver interactive charts and graphs can be found on the Exploring Finance dashboard: https://exploringfinance.shinyapps.io/goldsilver/

Call 1-888-GOLD-160 and speak with a Precious Metals Specialist today!
Buka akaun dagangan patuh syariah anda di Weltrade.
Source link