Mastery Trade for XAUUSD 16 th FEB 2023 for Fundamental Analysis and Technical Analysis

Gold : Fundamental Factors
1) US retail sales went up, making Wall Street and the dollar increase. This might mean the US Federal Reserve will raise interest rates for longer than some thought. Some investors are doubtful it will continue due to earnings estimates and recession risk. The dollar has gone up, but gold prices have gone down.
2) Gold is not doing well because US has high inflation. It might go down more because the US might raise interest rates again. Higher interest rates make gold less valuable. We don’t know what will happen until the US decides what to do with interest rates.
3) Analysts expect the PPI monthly number to rise 0.4% and the yearly reading to rise 5.4%. Core PPI, which removed food and fuel, is expected to rise 0.3% for the month and 4.9% for the year.
4) Philly Fed Manufacturing Index is expected to be at -7.6 compared to -8.9
5) Unemployment claims is expected to be at 200000 compare to 196000 previously.
The trend is Bearish
Fundamental Range : 1,835.16-1,837.96

Gold : Technical Analysis
Check at Daily Timeframe Support and Resistance for Fibonacci.
Check based on the current timing for the Support and Resistance when you want to go into trade.
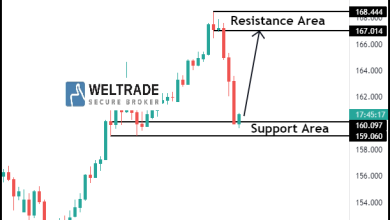
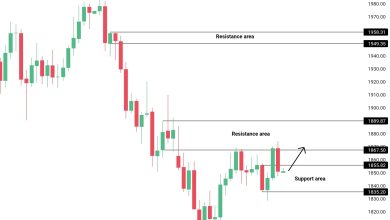
Resistance Area : 1853.70,1860.63, 1871.86
Support Area : 1831.24, 1824.31,1813.08
Pivot point : 1842.47
Confirm with technical indicators and based on your own technical analysis for the trend.
Check investing.com to get more info on what most indicator would display
Check higher timeframe also for more confirmation for entry in Daily timeframe.
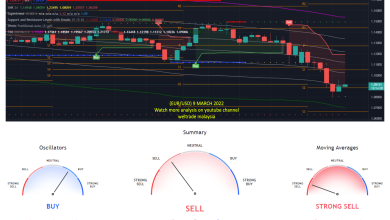
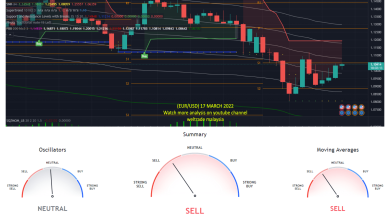
The technical indicator display sell in Daily and strong buy in weekly and strong buy in monthly timeframe.
Use linear regression to get confirmation trend at daily as they are not available in investing.com
Linear regression shows upward trend at the daily timeframe .Can check linear regression trend in weekly and monthly for more confirmation.For weekly, it is downtrend and for monthly,it is showing uptrend.
Use Bolinger Band Strategy Tester and RSI Strategy Tester to get more confirmation for the trend and percent profitable.Check at bigger timeframe also such as weekly and monthly.
Ensure that both RSI strategy and Bolinger Band Strategy gives above 50%. for the percent profitable
RSI strategy tester and Bolinger Band Strategy Tester at the daily and weekly has percentage higher than 50% , and monthly has lesser than 50% for the RSI strategy Tester and Bolinger Band Strategy Tester.
Gold : Find Sell at the daily chart by using the resistance point 1, 1853.70 and the take profit will be at the pivot point , 1842.47 (SEE CURRENT MARKET PRICE)
See current market and find the nearest support point for entry and take profit at the pivot point.
Fundamental and Technical analysis must be aligned
For further information, contact me ,Gurmit at +60142584067, I will guide anyone who wants to register with Weltrade.
DISCLAIMER :This analysis is based on Investing.com and Forexfactory.com. You may follow based on your own discreetion.
Can join at our telegram group at Education and Signal , https://t.me/+NfCxZrhbyZIzMGI1
For traders who want to trade on their own can join Weltrade, we provide benefits for traders out there, learn to trade and follow free signals such as free paid signal providers, bookmap gold and tradingview premium live.
Free Bookmap Education t.me/+JetSe33YA0U2ZDk1
Join us at our zoom link, https://us06web.zoom.us/j/87503803695?pwd=UGxmeGpDc3BvK3JFK1NrRjlJQzVldz09 for online learning from 11.30 am to 12.30 am by the Financial Markets Research Center (FMRC) team, with Mr. Gurmit.
Komen anda
Source link