According to the BLS, the economy added 261k jobs in October with a big revision up in September from 263k to 315k. October was a beat against median expectations of 205k. The employment rate (black line) increased from 3.5% to 3.7% while the labor force participation ticked down from 62.3% to 62.2%.
The job numbers have stayed surprisingly resilient despite daily announcements by major companies of job cuts and freezes. It’s only a matter of time before this feeds into the BLS job numbers.
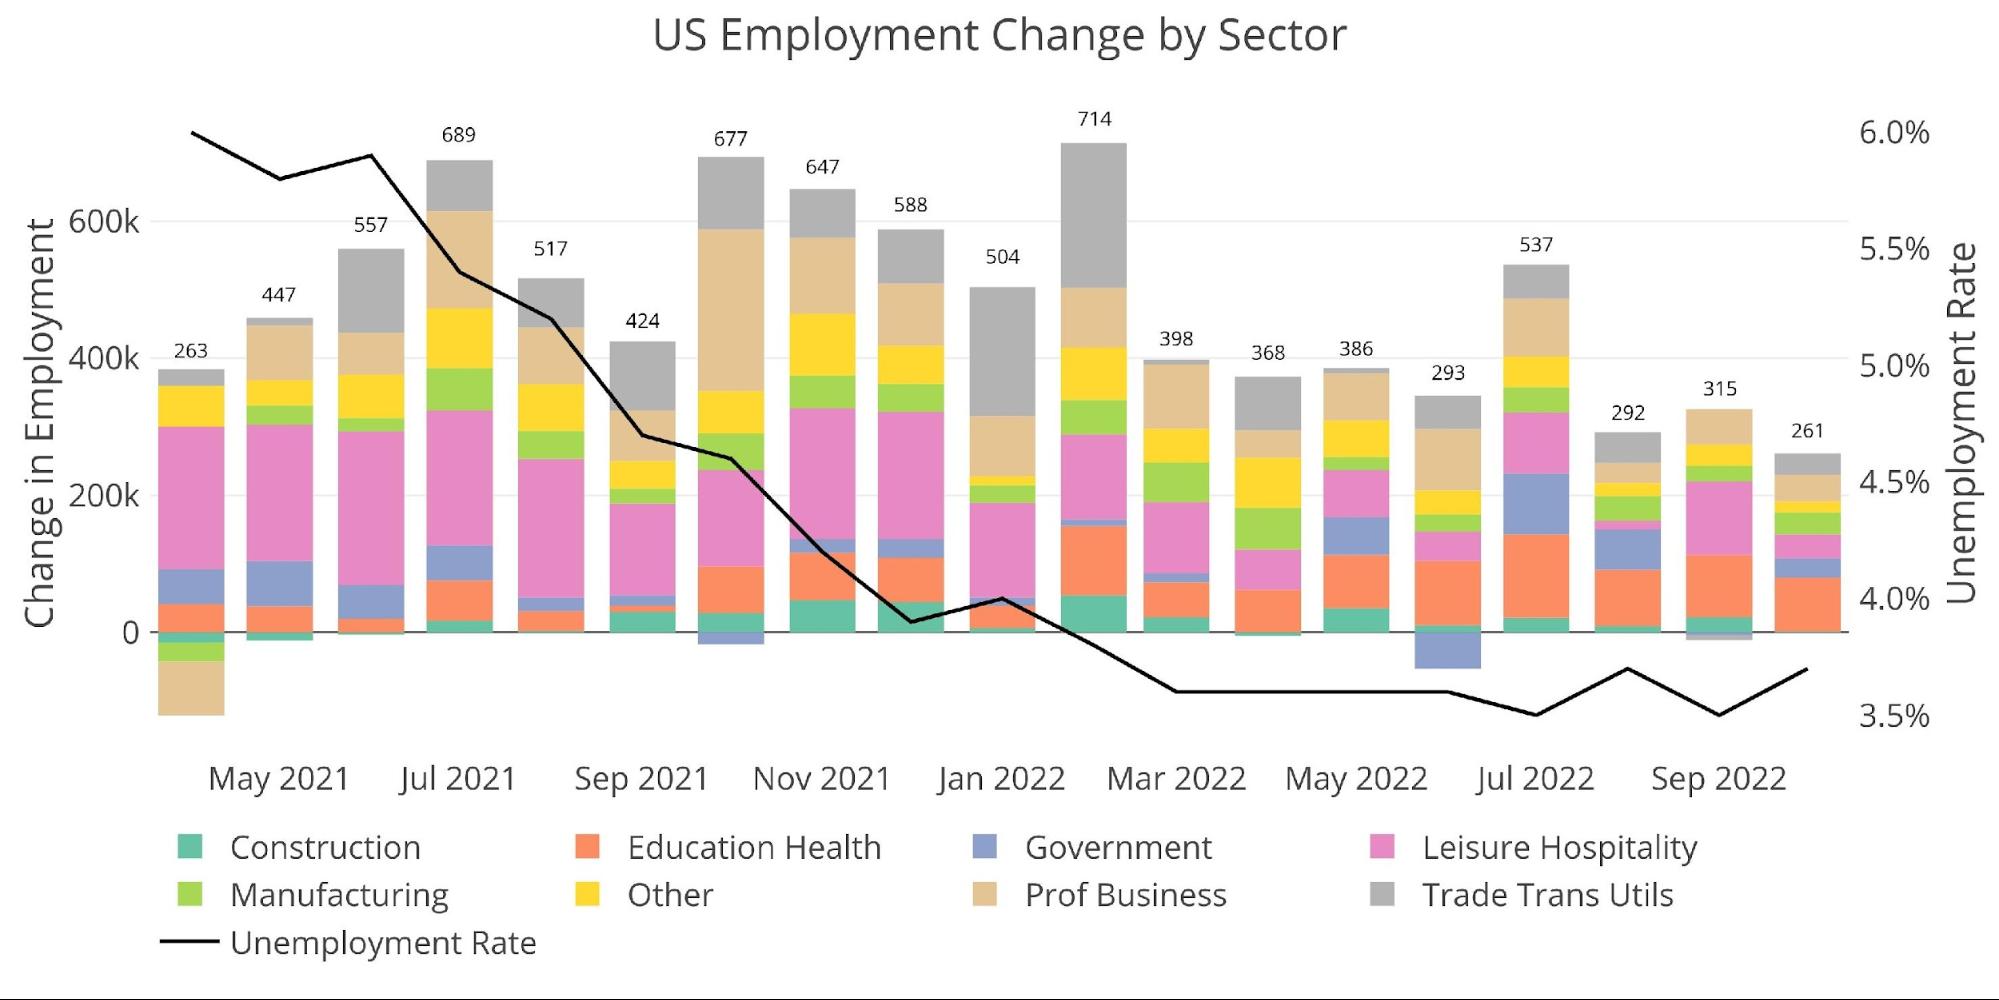
Figure: 1 Change by sector
When looking at the unadjusted numbers, October is the strongest month since February. It is down YoY when compared to last October when 1.66M jobs were added.

Figure: 2 Monthly Non-Seasonally Adjusted
October is historically a month that sees major downward seasonal adjustments. Adjustments have ranged from 700k-1M jobs since 2010. The latest October saw an adjustment down of 911k jobs. This is most likely a result of seasonal hiring in anticipation of the holiday season. The adjustment down will smooth out the data across months.
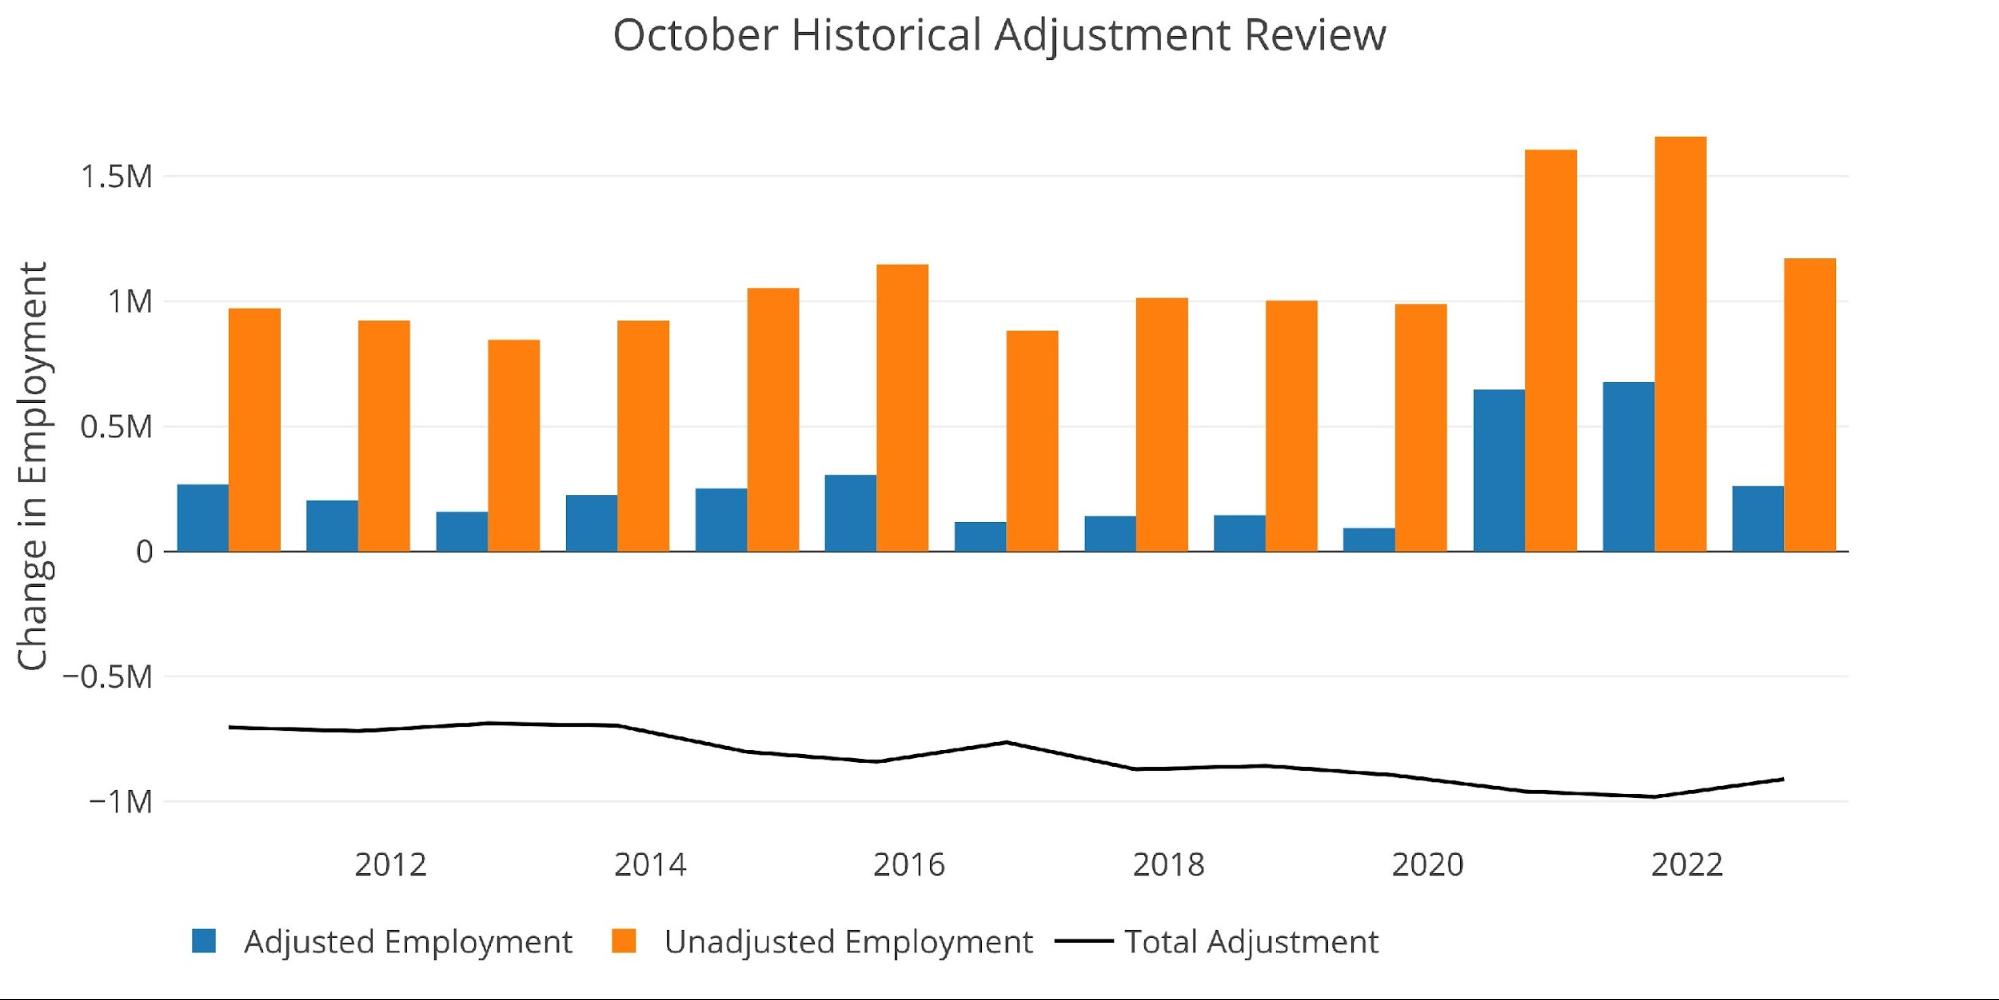
Figure: 3 YoY Adjusted vs Non-Adjusted
Breaking Down the Adjusted Numbers
Despite the better-than-expected number, the job market continues to slow. This can be seen in the chart below where every sector is below the 12-month trend except for Government and Education/Health. Construction is anemic, while Leisure/Hospitality, Other, and Trade Transport Utils are all 50% below their 12-month trend.
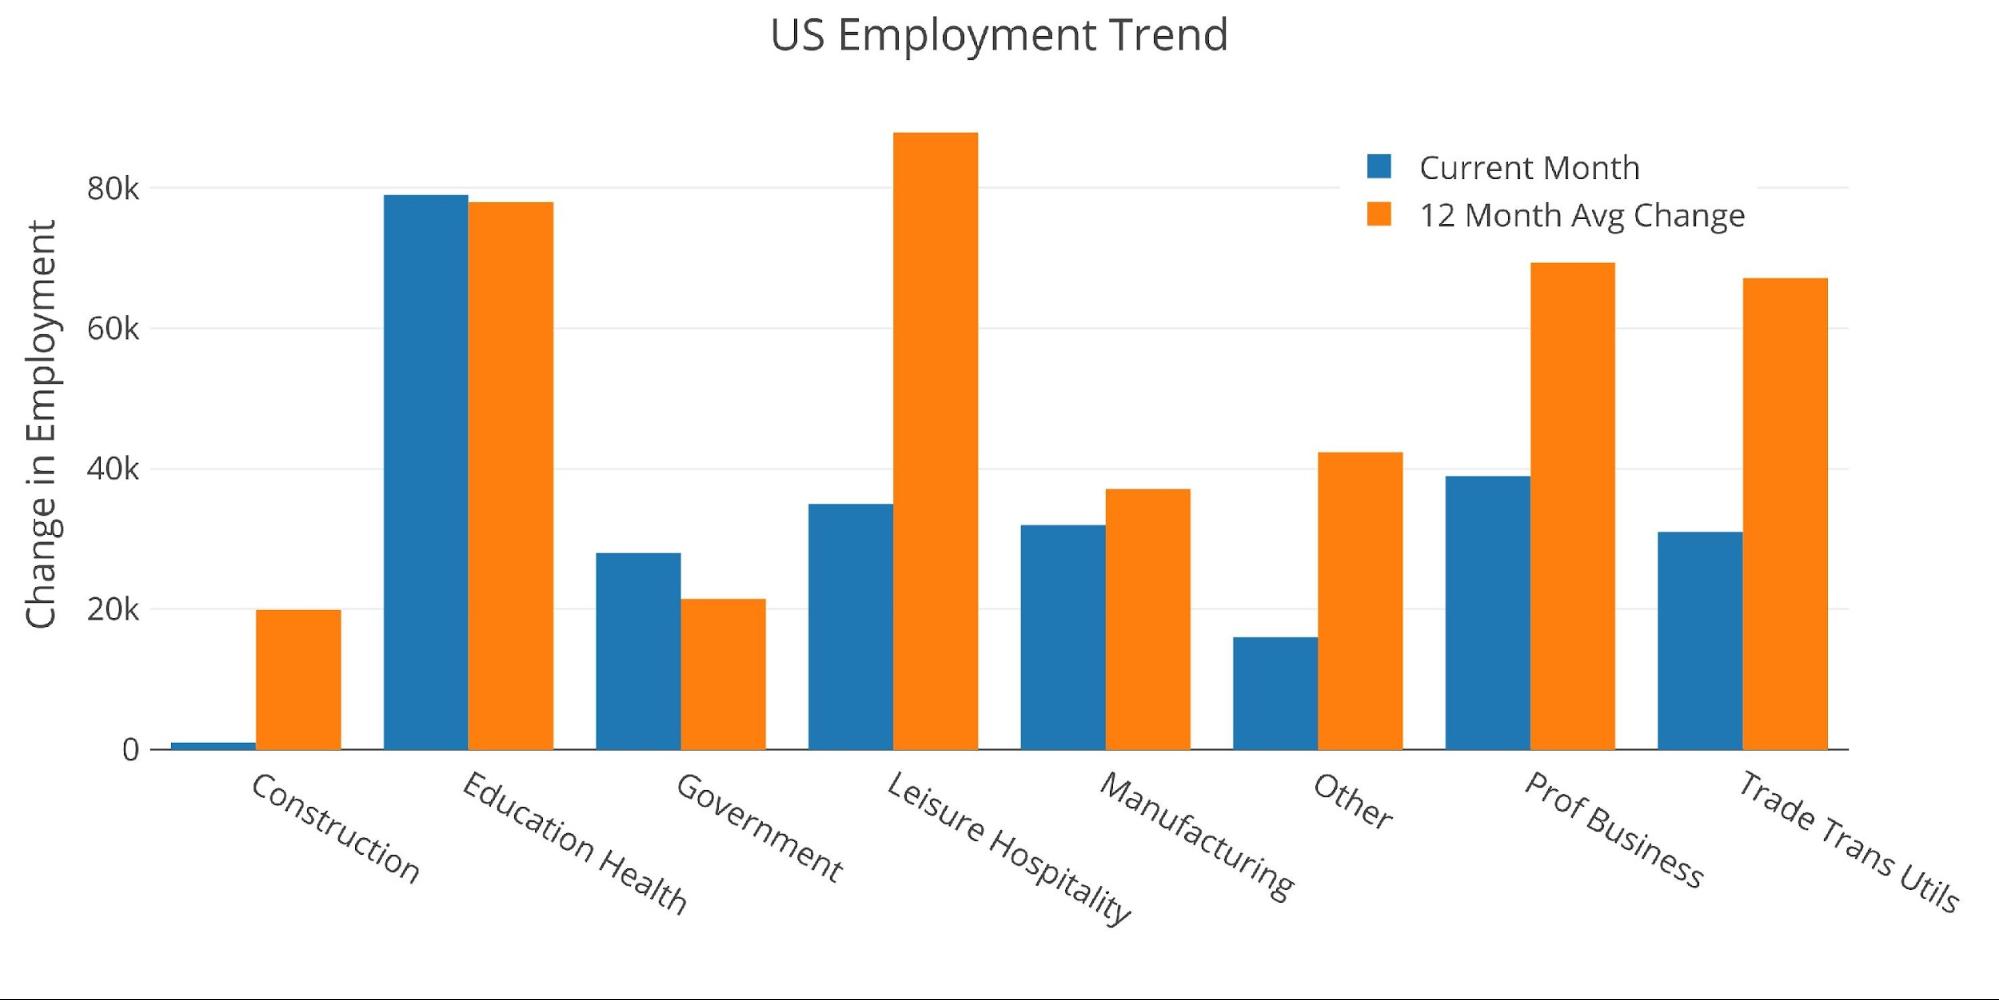
Figure: 4 Current vs TTM
The table below shows a detailed breakdown of the numbers. The aggregate 12-month average is 441k, which is well above the most recent month of 261k.
Key takeaways:
-
- Excluding government, all but two categories (Manufacturing and Trade Transport and Utils) were even below the 3-month average
-
- The aggregate 3-month average is 289k, 28k above the current month
-
- The collapse in Construction is most likely a result of mortgage rates topping 7%, reaching the highest level since 2001
- Over the past 12 months, every category is up except for the Federal Government
- Excluding government, all but two categories (Manufacturing and Trade Transport and Utils) were even below the 3-month average
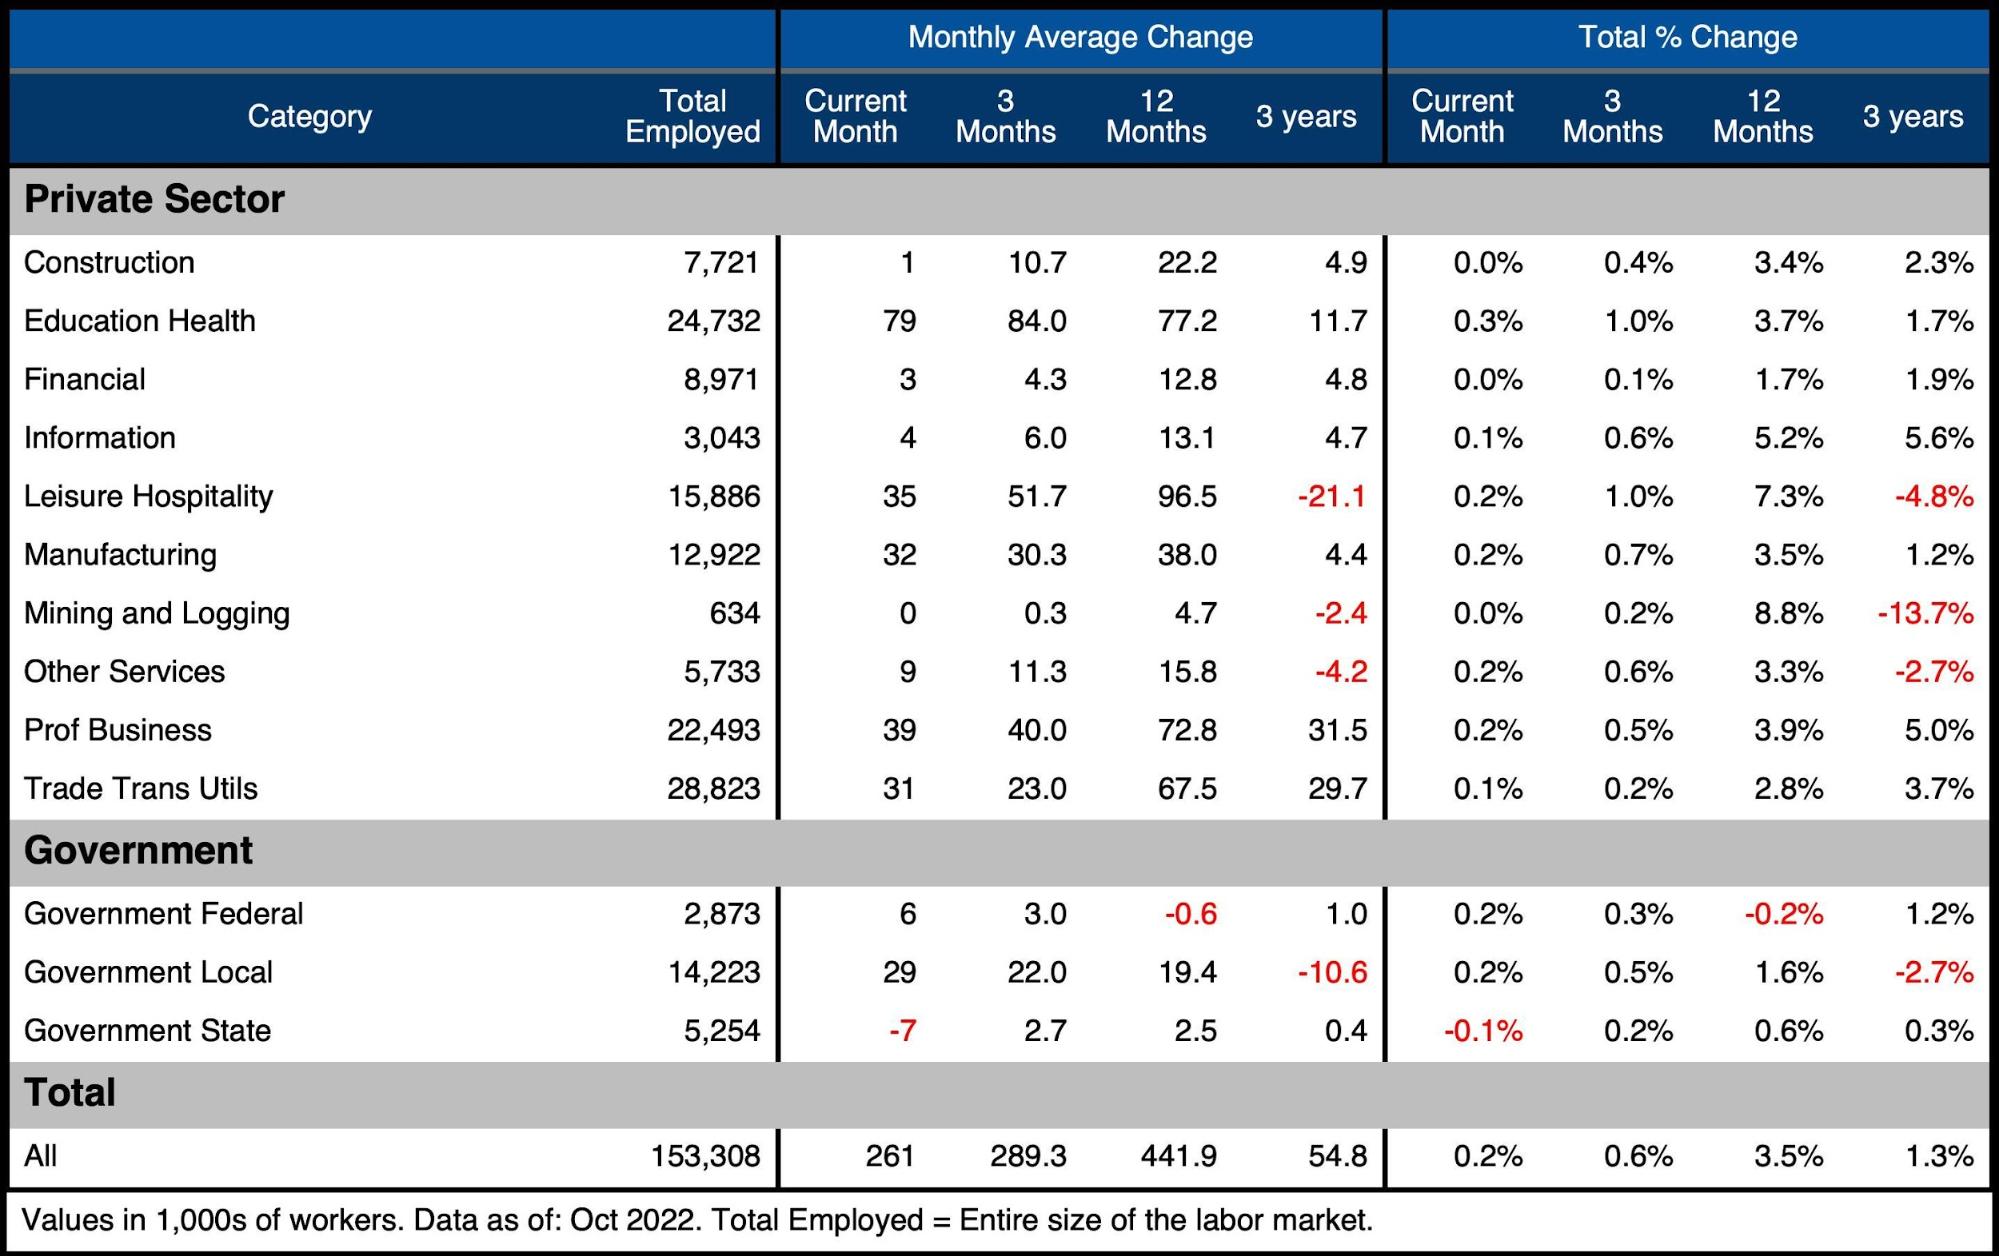
Figure: 5 Labor Market Detail
Revisions
While the headline number gets all the attention, the number is typically revised several times. Revisions over the last three months were net positive for the first time in 6 months. However, this can be entirely attributed to government jobs.
Over the last three months, revisions have increased by an average of 12,700. Government revisions have been 35k on average which means the remainder of the market has actually seen a downward revision of -22,300 jobs per month. The job market is weaker than initial reports suggest.
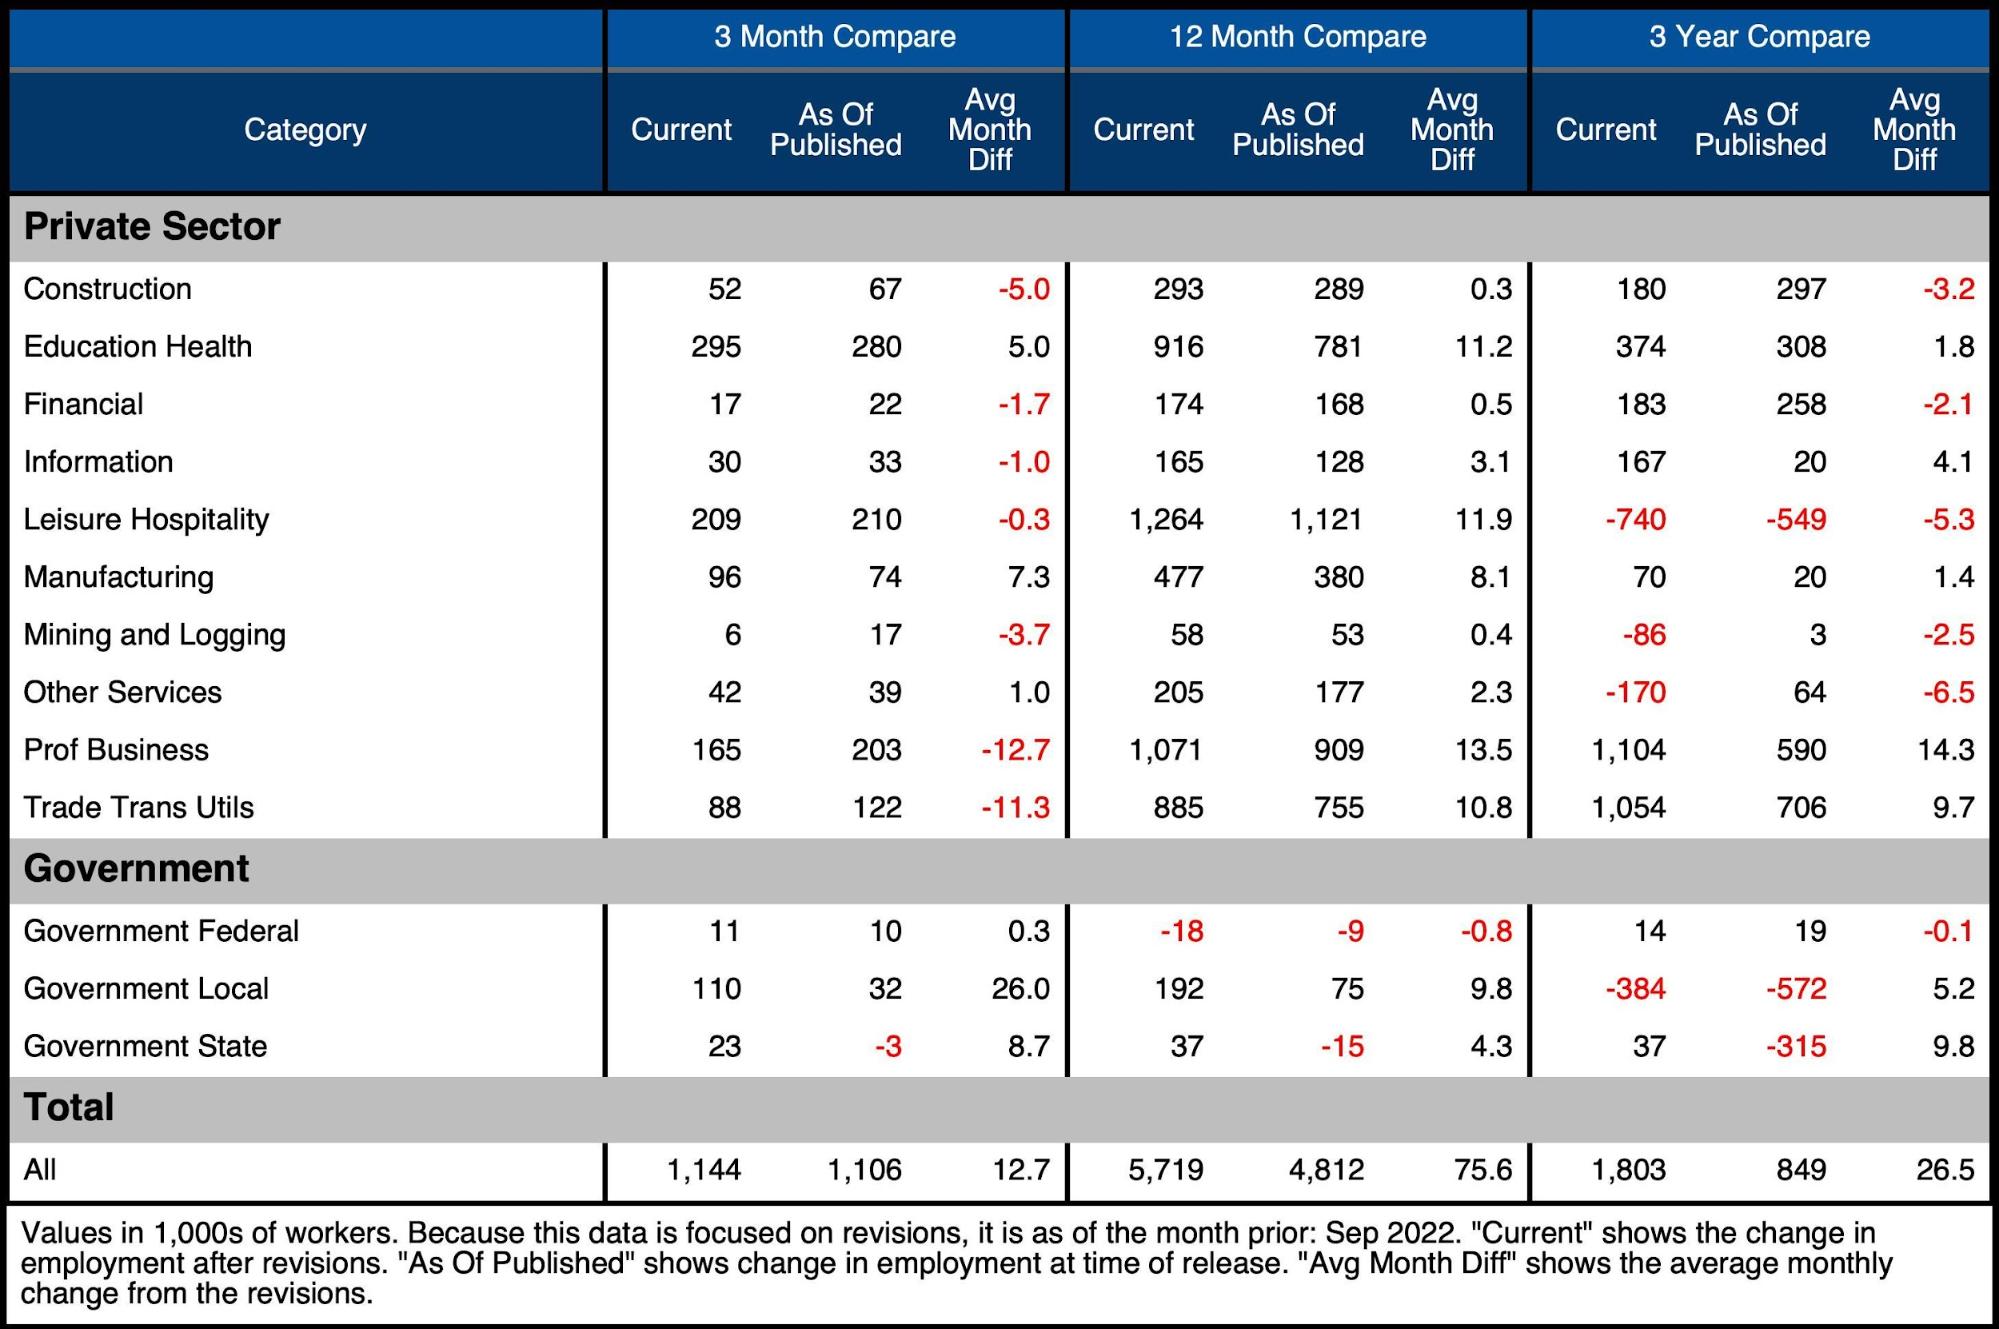
Figure: 6 Revisions
Historical Perspective
The chart below shows data going back to 1955. The Covid recession can be seen as the greatest job market loss ever.
The current unemployment rate ticked up to 3.7% after briefly dropping to 3.5% last month.
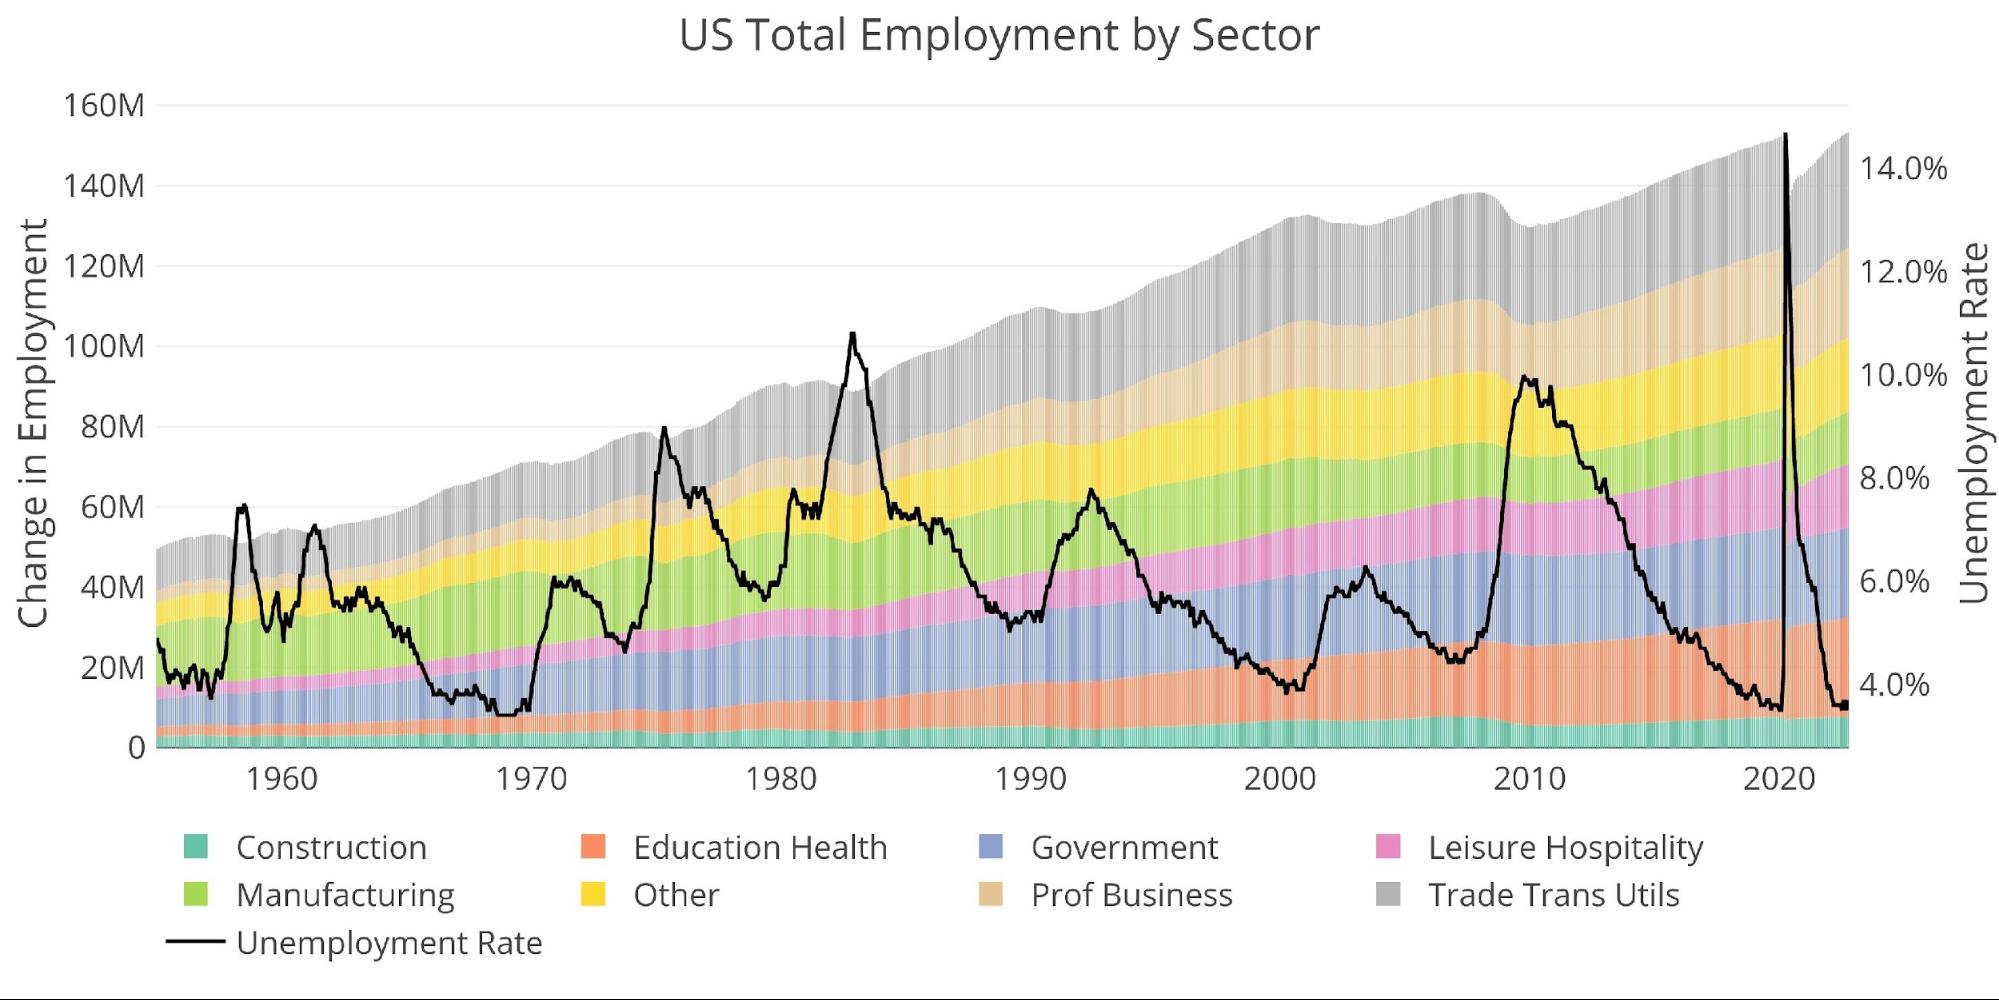
Figure: 7 Historical Labor Market
The labor force participation decreased for the second month in a row, falling from 62.4% in August to 62.2%. It still sits more than a full percentage point below the pre-Covid levels of 63.4% and well below the 66% pre-Financial Crisis.

Figure: 8 Labor Market Distribution
What it means for Gold and Silver
The BLS jobs number continues to show modest strength despite most other economic indicators flashing strong signs that the economy is in recession. GDP may have come in positive, but that is most likely due to a combination of exports from the Strategic Petroleum Reserve and a GDP deflator that understates inflation.
This has all led to a Fed that is overconfident in the economy’s resilience. Powell reaffirmed his commitment to bringing inflation down and is willing to tolerate the pain, but he likely has no idea the pain that awaits. The current level of interest rates has probably already broken something, but it has not yet manifested itself. It will.
Furthermore, there seem to be daily reports of hiring freezes or cuts. Many mainstream economists are predicting turbulent times. The Fed can talk tough for now because everything seems okay, but they will pivot when a crisis hits.
Gold and silver are showing incredible strength at the time of publishing (up 2% and 4.4% respectively). The miners are doing even better with the GDX up almost 7%! This move seems surprising, but it could be shorts starting to get nervous about the Fed being closer to the end of the hiking cycle than the beginning. Given the incredible demand in the physical market, the shorts might now want to be the ones on the hook for delivering metal they cannot source.
The current rally may be short covering or the start of something bigger. Time will tell. But over the medium to long term, gold and silver will offer the best protection against the Fed’s inevitable pivot.
Data Source: https://fred.stlouisfed.org/series/PAYEMS and also series CIVPART
Data Updated: Monthly on first Friday of the month
Last Updated: Oct 2022
Interactive charts and graphs can always be found on the Exploring Finance dashboard: https://exploringfinance.shinyapps.io/USDebt/

Call 1-888-GOLD-160 and speak with a Precious Metals Specialist today!
Buka akaun dagangan patuh syariah anda di Weltrade.
Source link