The price analysis last month discussed the technical damage done and highlighted how support had become resistance. It concluded:
When everything is so lopsidedly bearish, it can signify capitulation. That said, beware of trying to catch a falling knife. Because of the technical drivers in gold and silver, moves tend to extend beyond what seems possible as momentum carries the move forward… The paper market is driving prices and the spec traders don’t see a Fed pivot anywhere, which suggests more time before a turnaround.
The short-term picture is still rather mixed despite incredible physical demand on the Comex. The data below helps provide some context.
Resistance and Support
Gold
Since breaking below $1700 gold has been trapped around $1650. In early October, gold got back above $1700 only to get pushed back below. Gold will need to break through this resistance and start setting higher highs to gain back momentum.
Outlook: Neutral to Bearish
Silver
Silver saw a strong rally above $21 but then broke down below $20 again. It cannot hold any momentum. Some of this could be due to the CFTC raising margin requirements to cap the price advance (see below).
Outlook: Bearish until $22 is taken out
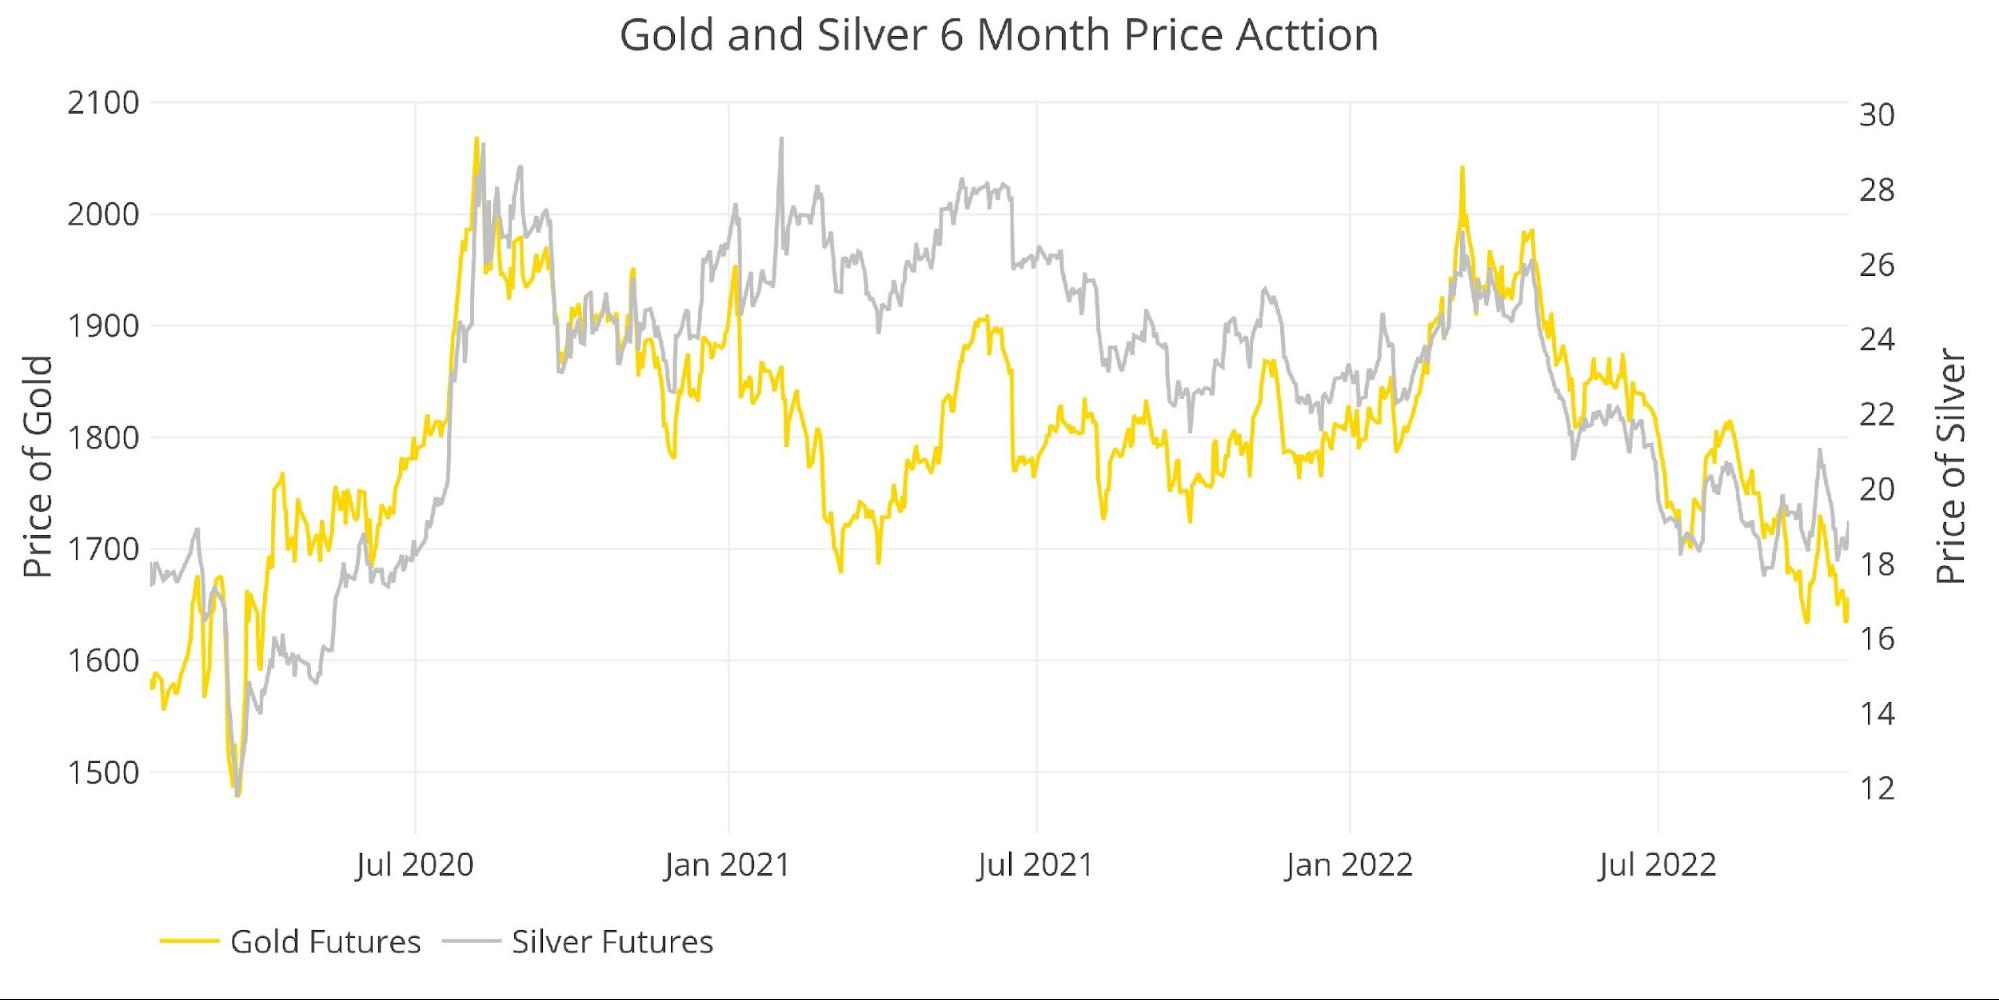
Figure: 1 Gold and Silver Price Action
Daily Moving Averages (DMA)
Gold
It’s bearish that the 50 DMA ($1711) is well below the 200 DMA ($1819); however, the market rarely goes in one direction without a pause. The big move down looks overdone which could lead to a short-term reversal. Regardless, momentum is down until the 50 DMA gets back above the 200 DMA.
Outlook: Bearish
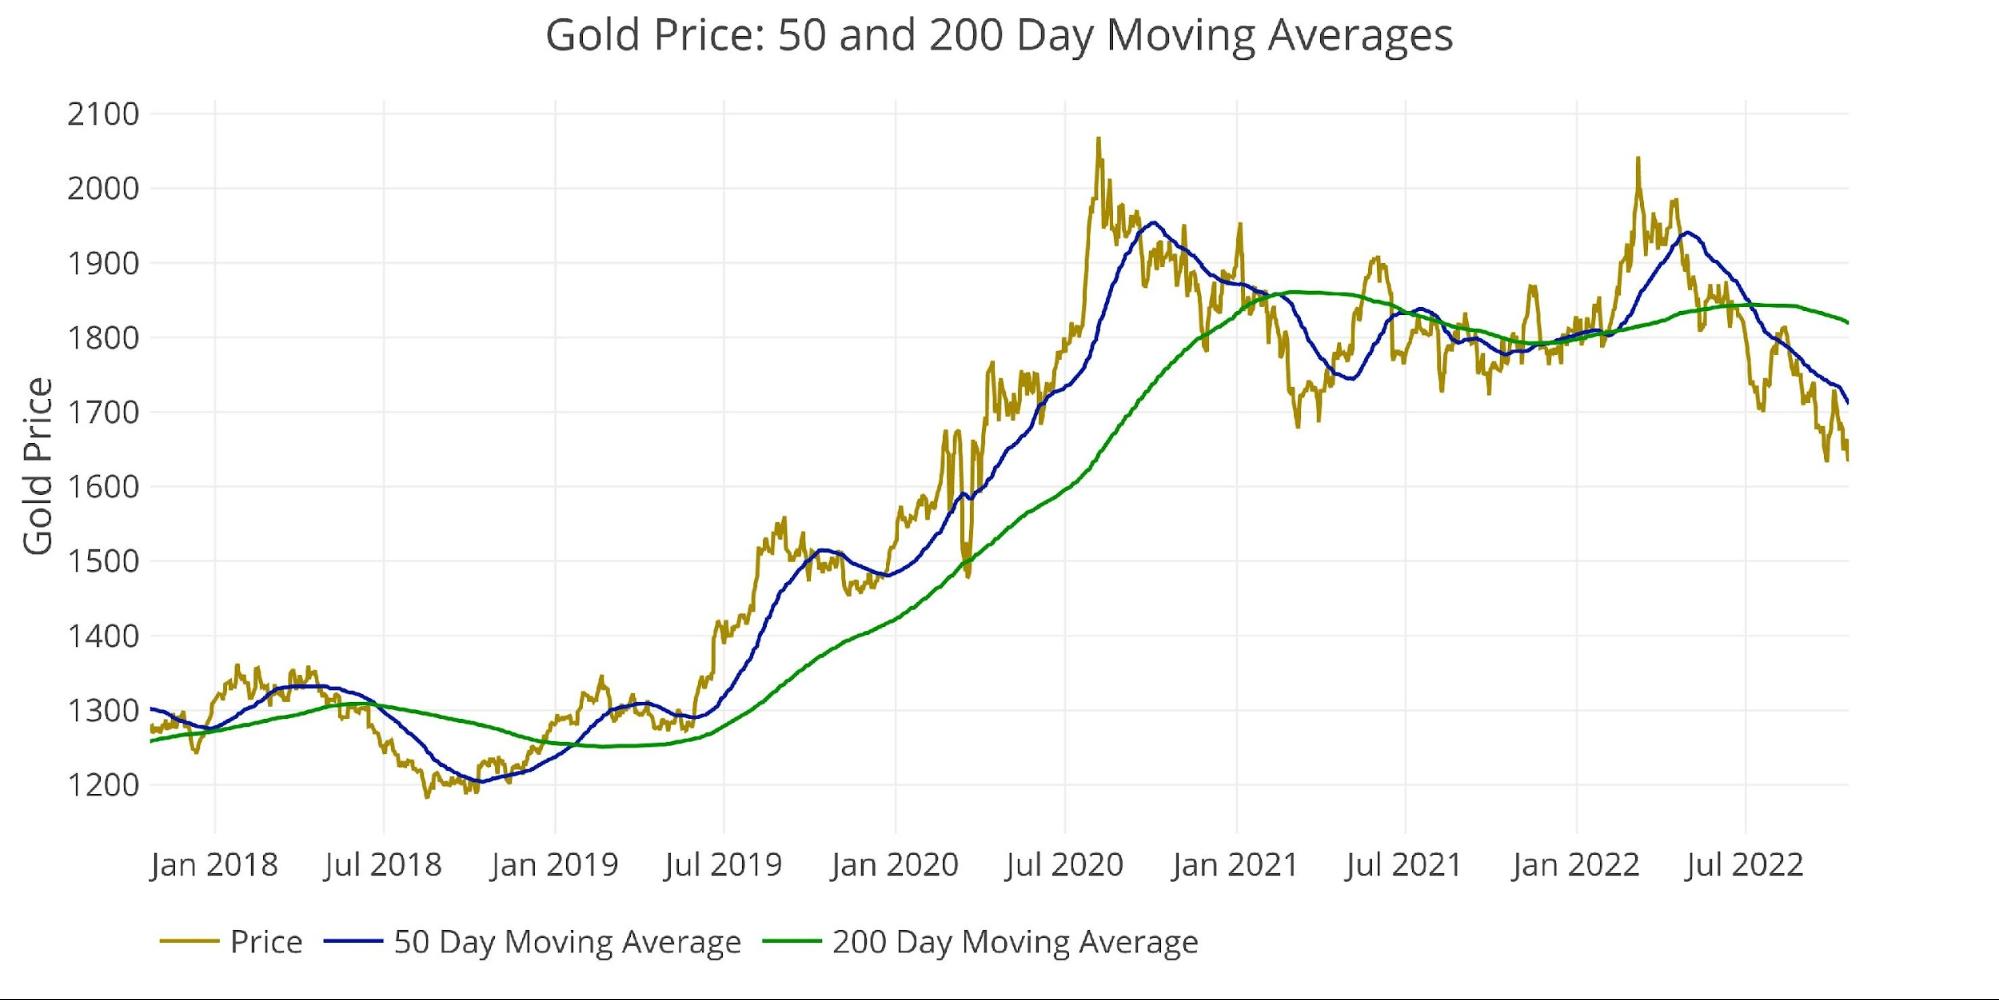
Figure: 2 Gold 50/200 DMA
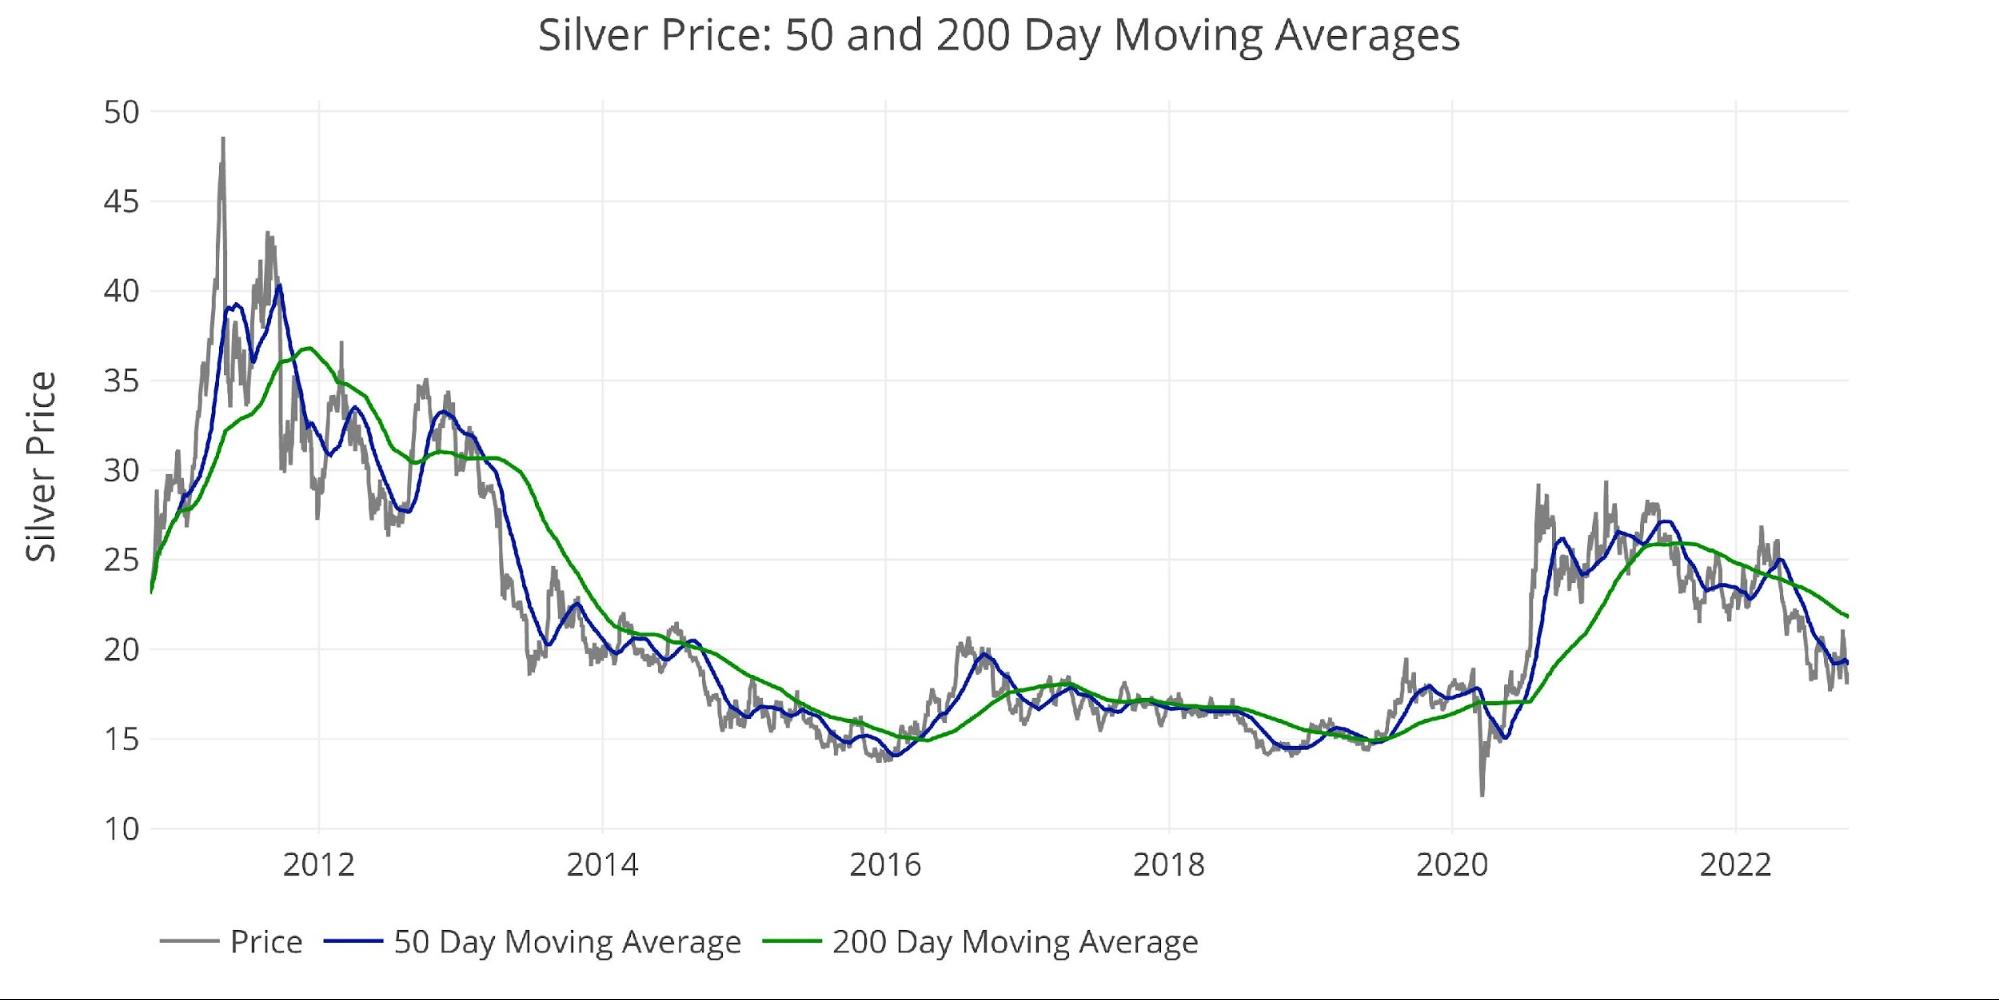
Silver
Silver has also been unable to hold any momentum since 2020. The fall in the 50 DMA below the 200 DMA is the biggest since 2013. However, it wasn’t until more than 2 years later that the market finally started to turn around back then.
Outlook: Bearish
Margin Rates and Open Interest
Gold
Open interest is at multi-year lows not seen since April 2019 when the price was $400 lower. The market has been left for dead, which suggests there is cash on the sidelines to ride any positive momentum moves.
Margin rates have also come down to the lowest levels since 2020, but the COTs report suggests this has brought in more shorts than longs.
That said, the CFTC does not typically raise margin rates on the shorts (this could induce a short squeeze). The CFTC uses margin rates to cap any price advance. There is no reason to raise rates to push the price lower, but if a price advance begins, the CFTC will have plenty of room to raise margin rates to contain any big increases.
Outlook: Neutral
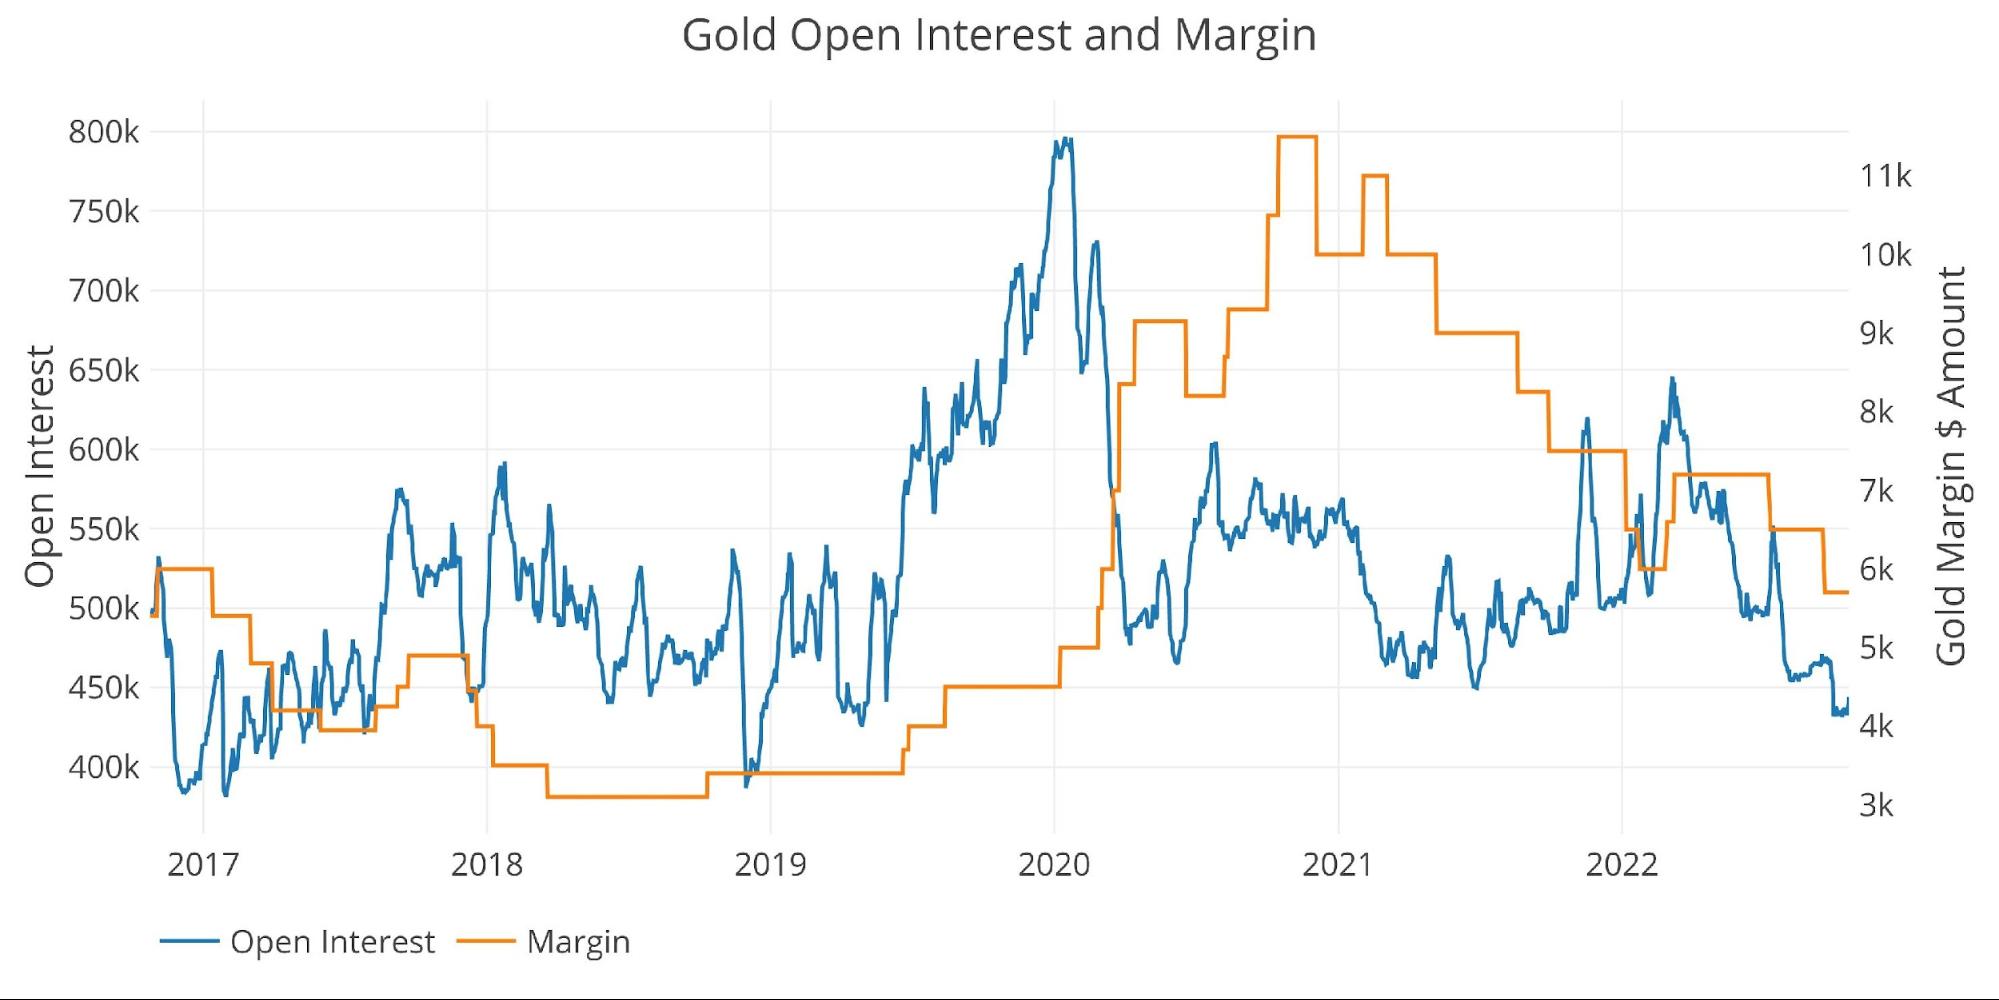
Figure: 4 Gold Margin Dollar Rate
Silver
Silver saw a big run-up in price in early October, but the CFTC immediately raised margin rates which prompted a quick turnaround. The CFTC has plenty of room to raise margin rates higher because it still sits near multi-year lows. Expect any price advance to be accompanied by margin rate increases, blunting, or even reversing the move.
Outlook: Neutral
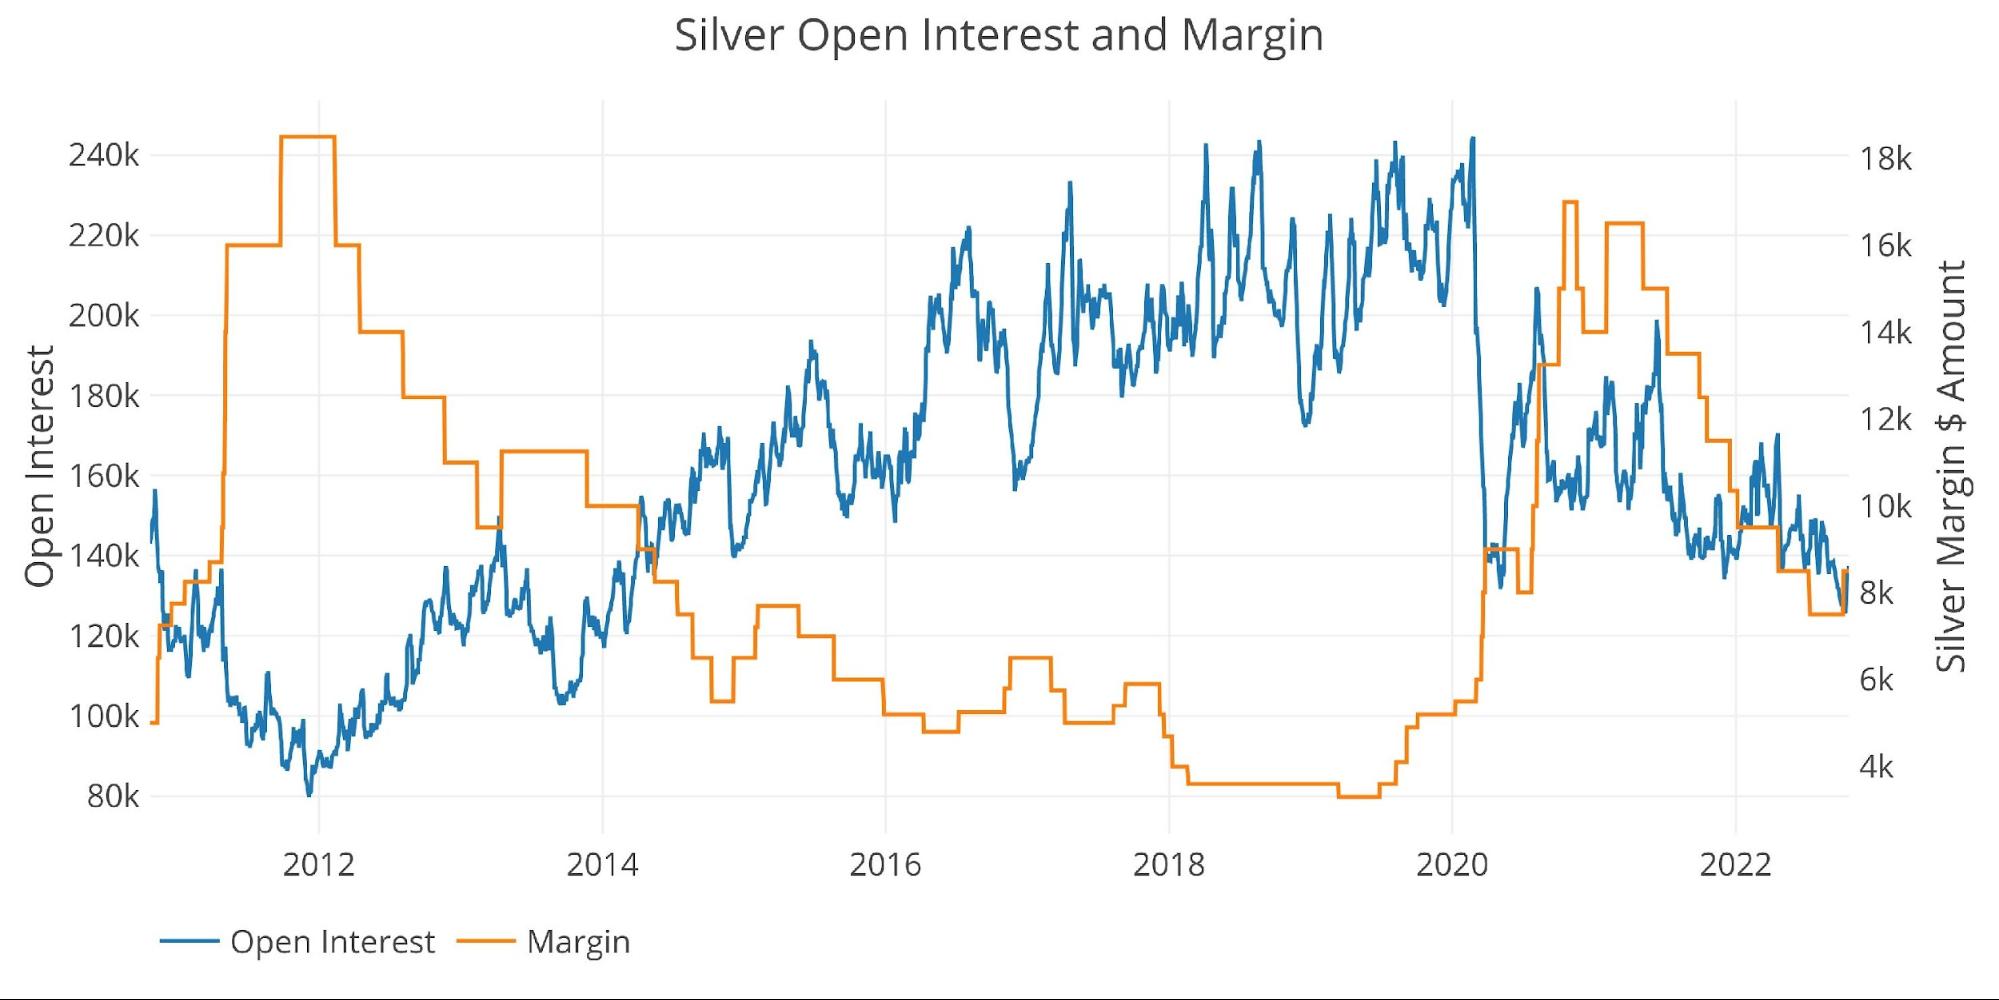
Figure: 5 Silver Margin Dollar Rate
Gold Miners (Arca Gold Miners Index)
The gold miners have been very consistently leading the price of gold in both directions for years. This week was a good week for the miners which was capped off by a sizable up move on Friday of 5% driven by a WSJ Report of a potential move by the Fed to be less hawkish. This is a good sign in the short-term, as long as the Fed doesn’t come out next week and increase the hawkish rhetoric.
Outlook: Cautiously Bullish
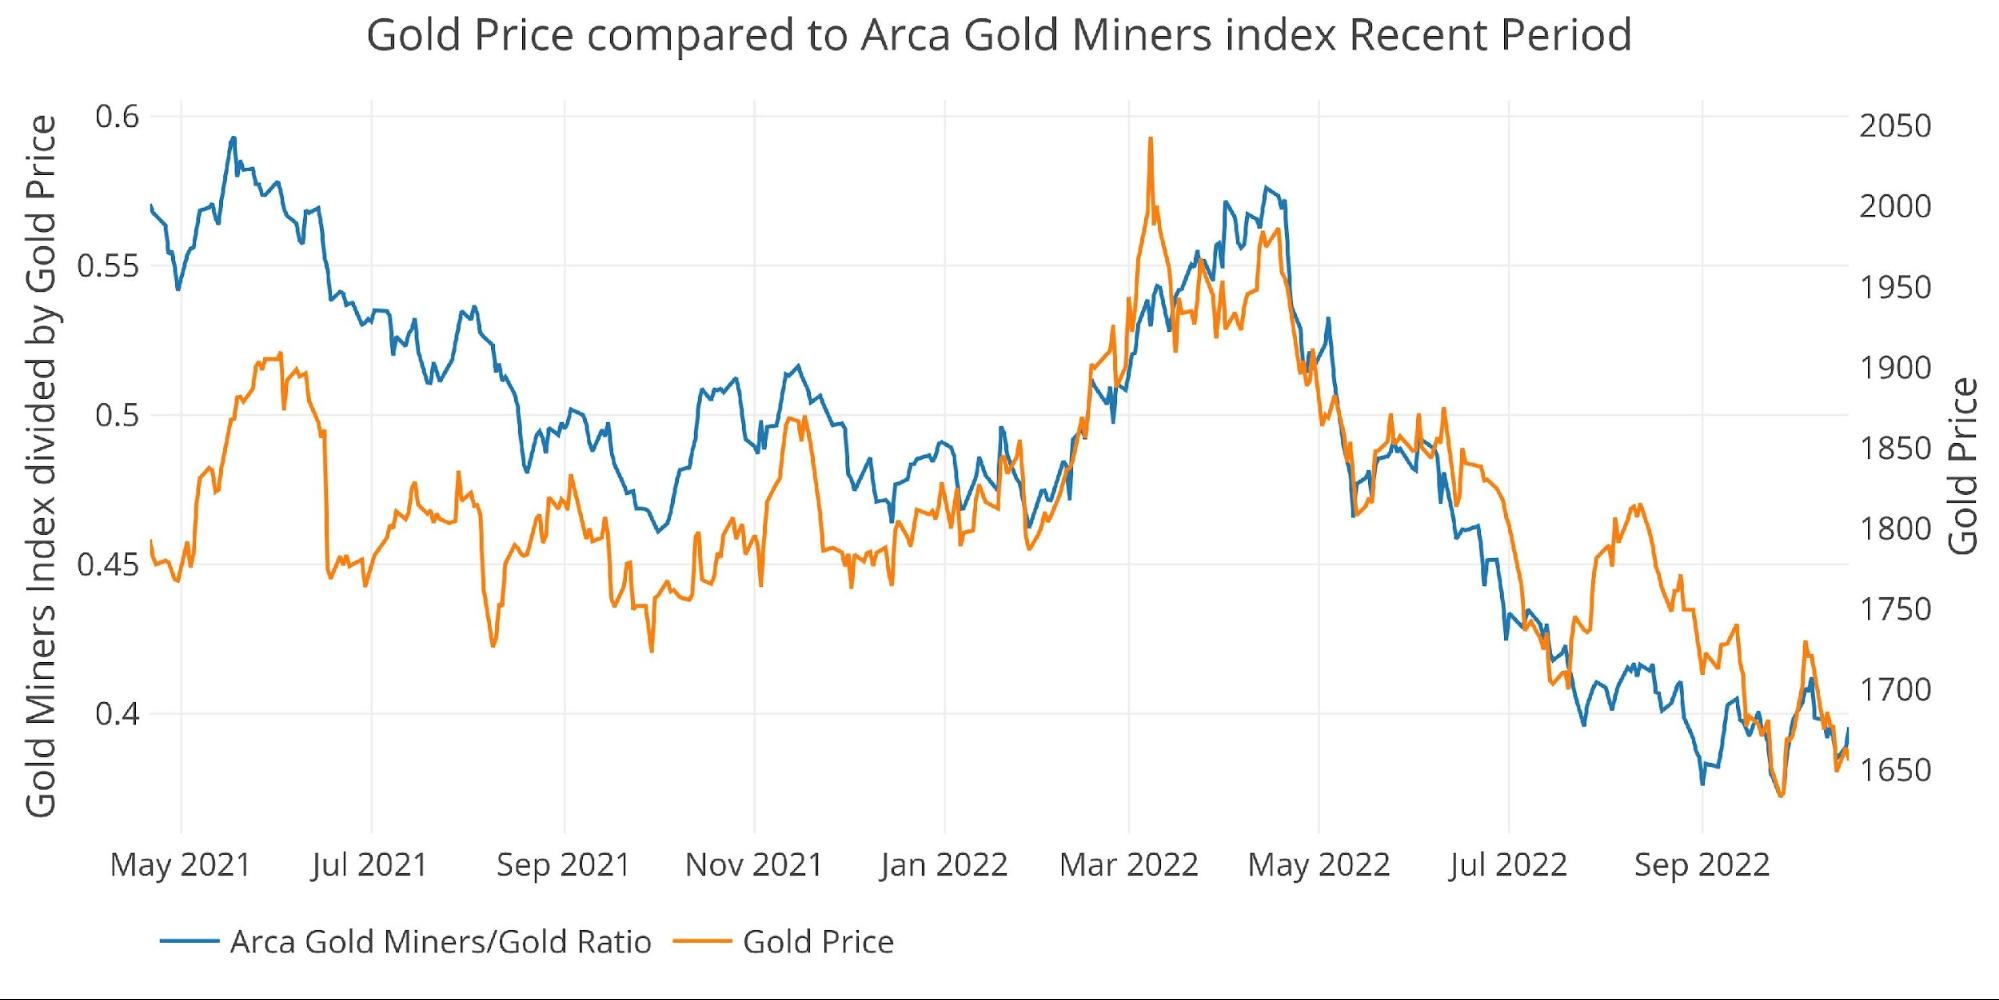
Figure: 6 Arca Gold Miners to Gold Current Trend
Looking over a long-time horizon shows how badly the miners have underperformed gold over the last decade. This shows traders have never confidently bought into any gold momentum, anticipating price advances will be short-lived. When this trend reverses, gold could start flying higher being led by a surging mining sector.

Figure: 7 Arca Gold Miners to Gold Historical Trend
Trade Volume
Love or hate the traders/speculators in the paper futures market, but it’s impossible to ignore their impact on price. The charts below show more activity tends to drive prices higher.
Volume in both metals shows a general lack of interest, even worse than in early 2019. This likely shows limited downside but plenty of upsides if interest returns to the market.
Cautiously Bullish in Gold and Silver
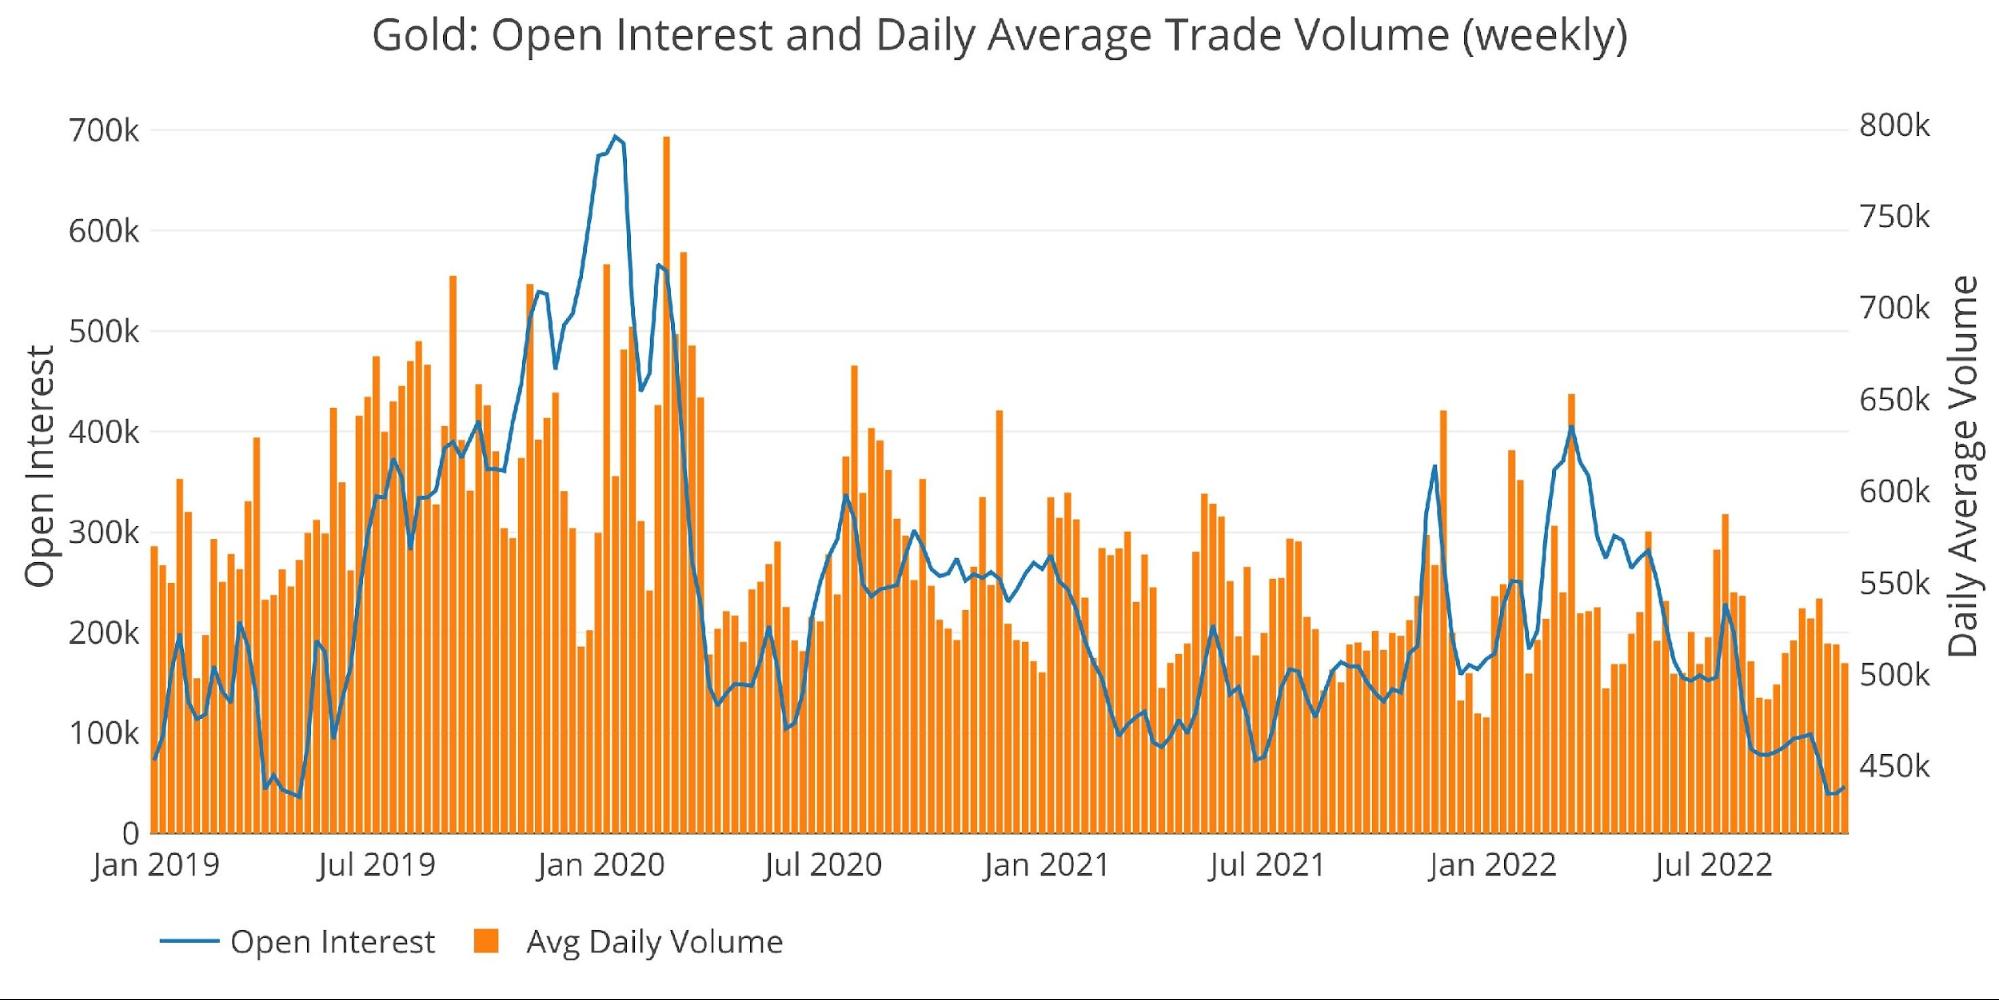
Figure: 8 Gold Volume and Open Interest
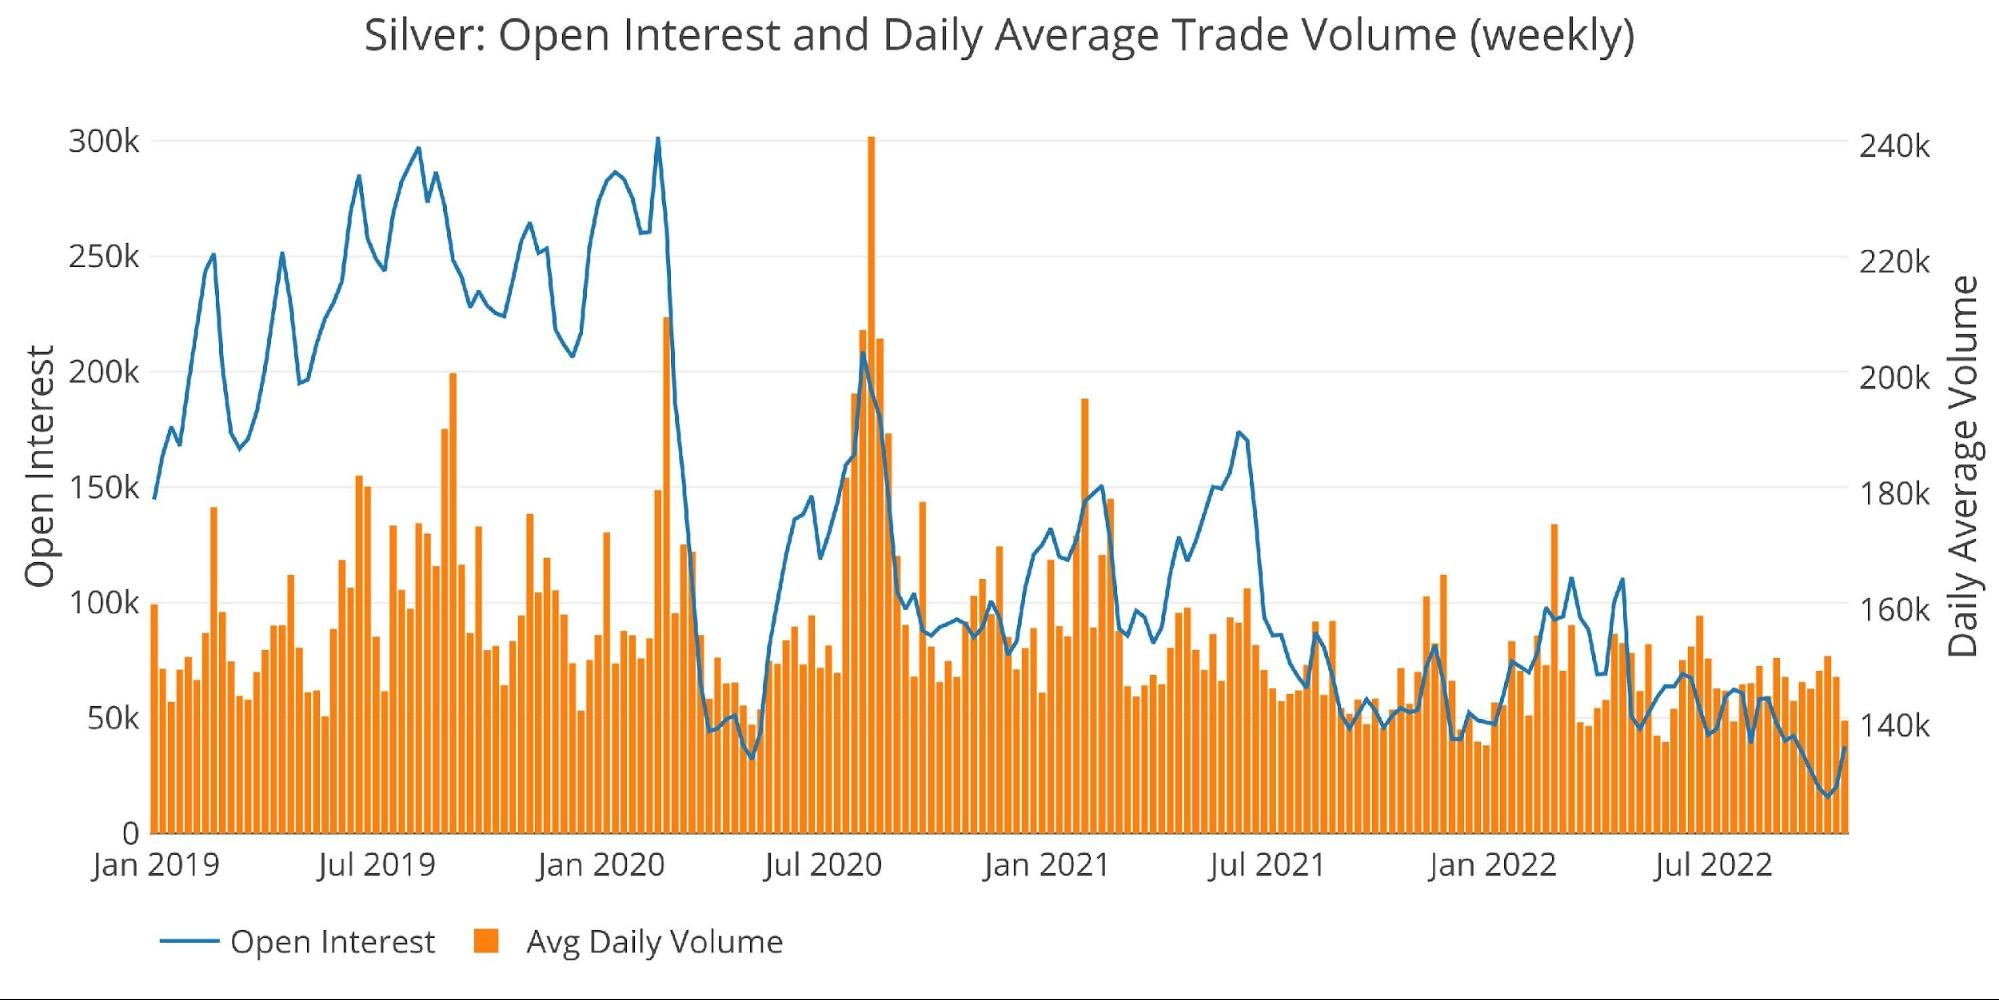
Figure: 9 Silver Volume and Open Interest
Other drivers
USD and Treasuries
Price action can be driven by activity in the Treasury market or US Dollar exchange rate. A big move up in gold will often occur simultaneously with a move down in US debt rates (a move up in Treasury prices) or a move down in the dollar.

Figure: 10 Price Compare DXY, GLD, 10-year
The dollar continues to rip higher with surging bond yields, which has pressured gold. To see strength in the gold market, it is likely that the dollar will have to break down below support which is around $105. That does not look imminent given the current market environment.
Outlook: Bearish until the dollar reverses
Gold Silver Ratio
the gold silver ratio has been quite volatile of late, surging during the sell-offs, but reversing when gold and silver catch a bid. The choppiness will likely continue until the market senses a Fed pivot, but in the medium to long-term silver is still undervalued relative to gold.
Outlook: Silver bullish relative to gold

Figure: 11 Gold Silver Ratio
Bringing it all together
The table below shows a snapshot of the trends that exist in the plots above. It compares current values to one month, one year, and three years ago. It also looks at the 50 and 200-daily moving averages. While DMAs are typically only calculated for prices, the DMA on the other variables can show where the current values stand compared to recent history.
Both metals continue to slide and the metrics don’t look great.
-
- Gold open interest is 15% below the 200 DMA with silver 5.7% below. This reflects the lack of interest.
- In gold, the 50 DMA trade volume is 15% below the 200 DMA
- The prices have suffered, down 2.5% in gold and 4.4% in silver MoM
-
- Given the lack of interest, the price declines could have been worse
-
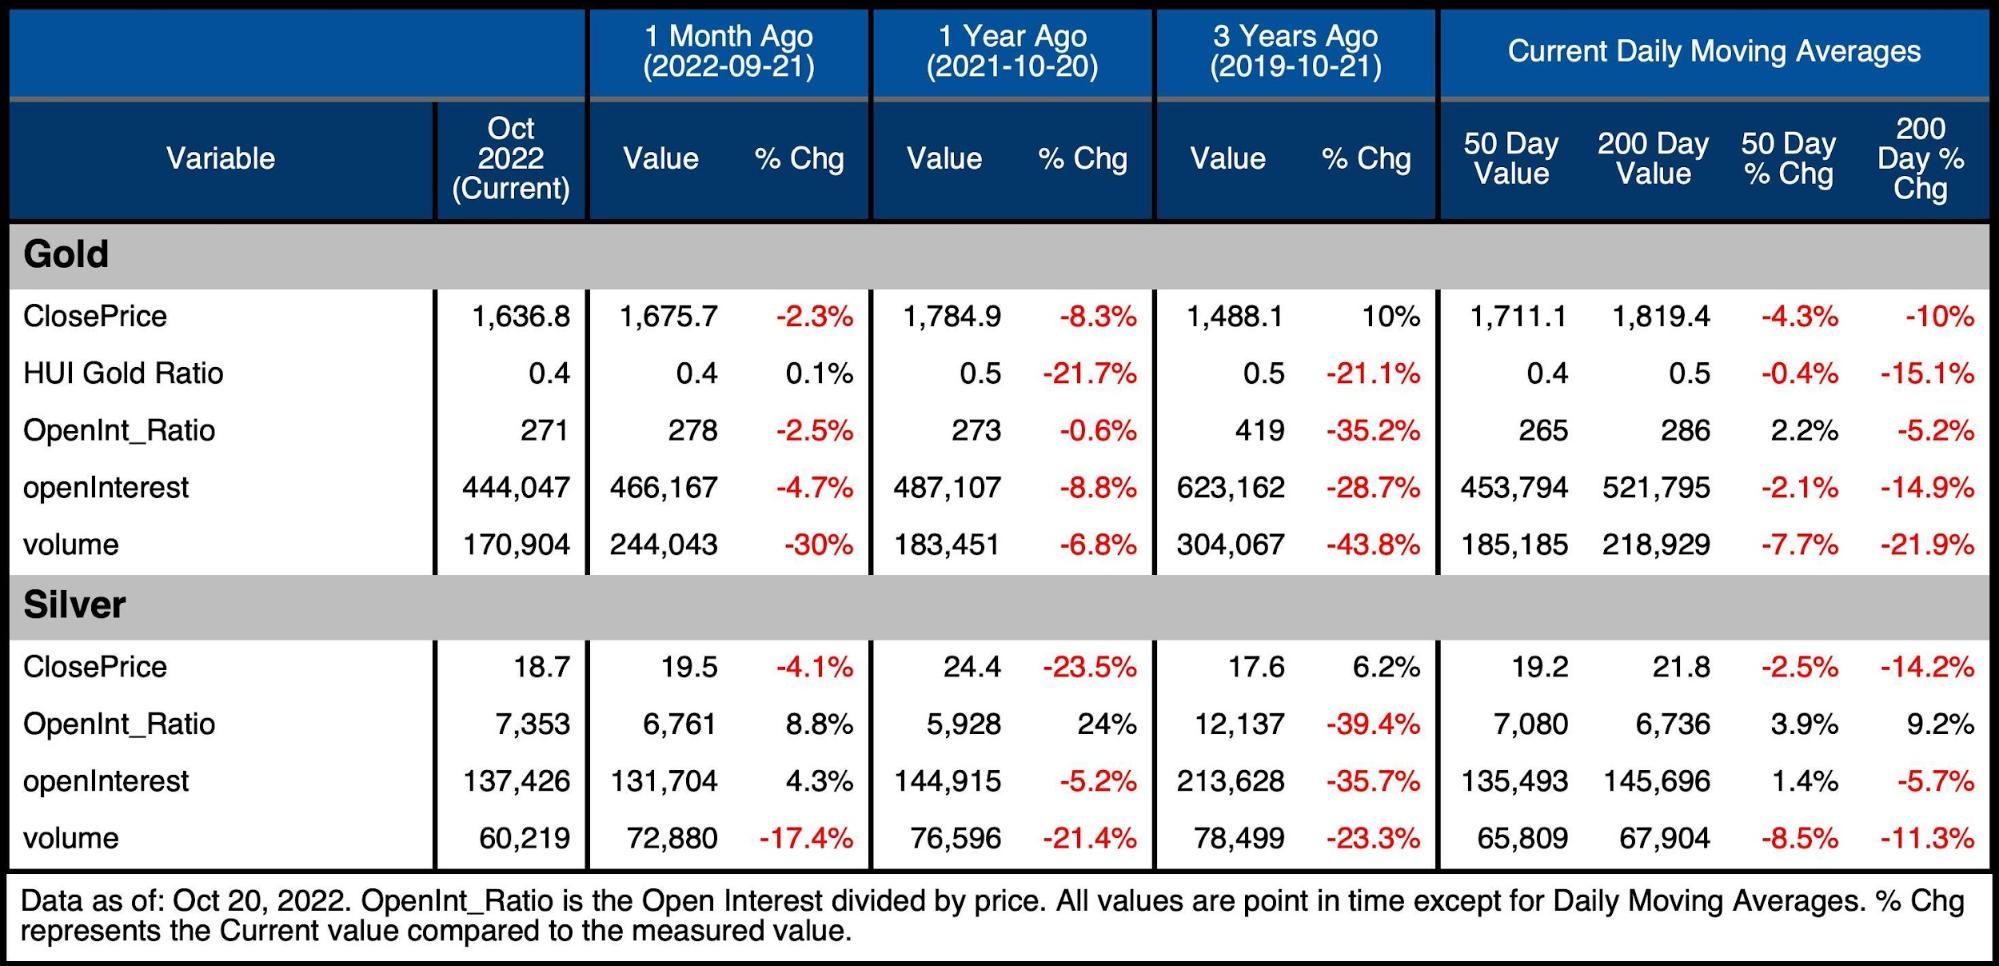
Figure: 12 Summary Table
Wrapping up
While many indicators are bearish, the absolute lack of interest shows that the market is starting to bottom. The Fed may have finally reached peak hawkishness as illustrated by the WSJ linked above. Fed officials are starting to hint at concerns about their relentless increase in interest rates. In short, the bad news seems fully priced in while a pivot is definitely not priced in.
The Fed has likely already broken something. Plus, the math is working against them if they don’t want to send the Treasury into a debt spiral. The window is rapidly closing for the Fed to get inflation back down to target before a pivot (or pause) occurs.
When all the bad news is priced in, it leaves much more potential to the upside than risk to the downside. Add in the insatiable demand for physical metal seen at the Comex and it looks like this market will turn sooner or later. Still, though, support has become resistance so the market has some work ahead of itself. Medium to long-term investors should feel very confident buying at current prices, even if the price action remains choppy in the short-term.
Data Source: https://www.cmegroup.com/ and fmpcloud.io for DXY index data
Data Updated: Nightly around 11 PM Eastern
Last Updated: Oct 20, 2022
Gold and Silver interactive charts and graphs can be found on the Exploring Finance dashboard: https://exploringfinance.shinyapps.io/goldsilver/

Call 1-888-GOLD-160 and speak with a Precious Metals Specialist today!
Buka akaun dagangan patuh syariah anda di Weltrade.
Source link