Forecast for XAUUSD 4 oct 2022 for Fundamental Analysis and Technical Analysis

Gold :Fundamental Factors
1) Prices of the yellow metal rose after weak U.S. manufacturing and construction data suggested that the Federal Reserve may have to temper its pace of rate hikes to prevent further economic destruction.
2) The weak manufacturing data, coupled with similarly dismal readings from Japan, the Eurozone and the UK on Monday, saw copper prices lag metal markets on fears of further demand headwinds.
3) The dollar index retreated further from a recent 20-year peak, losing 0.4% and falling for a fourth consecutive session. 10-year Treasury yields also backed away from a near 12-year high.
4) Markets are now pricing in the possibility that the Fed will eventually pivot to a dovish stance if economic conditions worsen in the country.
This comes ahead of key U.S. nonfarm payrolls data this Friday, which is expected to show resilience in the labor market.
The trend is Bullish ( For Today)
Gold : Fundamental Range : 1600-1700

Gold : Technical Analysis
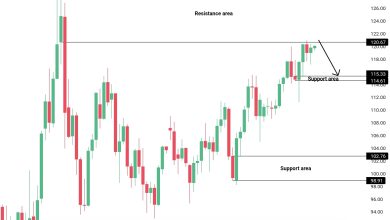
Check at Daily Timeframe Support and Resistance for Fibonacci.
Check the timing of trade it might be different for resistance and support at that time.
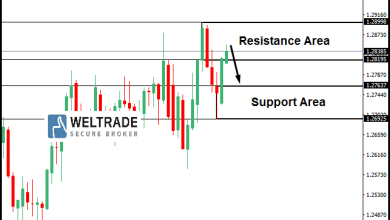
1) Resistance : 1704.25,1714.37, 1730.76
2) Support : 1644.96,1661.35,1671.47
Pivot point : 1687.86
Confirm with technical indicators and based on your own technical analysis.
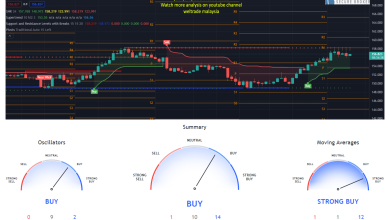
Check investing.com to get more info on what most indicator would display
Check higher timeframe also for more confirmation for entry in Daily timeframe.
The technical indicator display strong buy in Daily and strong sell in weekly and monthly timeframe, where we can entry sell for higher timeframe by following the support area given and vice versa
If want to go for the lower timeframe ,can see what the timeframe display to see the confirmation of trend and entry
Seek for sell or buy opportunity to enter for confirmation or based on your own technical analysis understanding.
Use linear regression to get confirmation trend at daily as they are not available in investing.com
Linear regression shows a downward trend.
Use Bolinger Band Strategy Tester and RSI Strategy Tester to get more confirmation.
Both strategies show a higher percentage of profit which is higher than 50%
Gold: If you would like to go for a shorter trade, go for buy, and for a longer period trade, go for sell.
Find sell at the daily chart
For further information, contact me ,Gurmit at +60142584067,I will guide anyone that would like to register with Weltrade. Can register at the below link. Thank you.
https://my.weltrade.com/?r1=ipartner&r2=49989
Disclaimer : This analysis is based on Investing.com and Forexfactory.com. You may follow based on your own discreetion.
Can join at our telegram group at https://t.me/weltrade_my
For traders who want to trade on their own can join Weltrade, we provide benefits for traders out there, learn to trade and follow free signals such as free paid signal providers, bookmap gold and tradingview premium live.
Free Bookmap Education t.me/+JetSe33YA0U2ZDk1
Join us at our zoom for online learning from 10.30am to 11.30am by the Financial Markets Research Center (FMRC) team. With Cikgu Hafiz and Cikgu Gurmit
Link: https://us06web.zoom.us/j/81843968428?pwd=VkZ3L2UrcXh2WlZsZHU3ZFFGUmJMQT09
Komen anda
Source link