Mastery Trade XAUUSD 9 Jan 2022 for Fundamental Analysis and Technical Analysis


Gold : Fundamental Factors
1) China buy large quantities of oil despite its worrying COVID situation, the Chinese actions seemed geared more towards storing crude than buying it for immediate use.
2) Demand for oil in China typically rises each year after the Lunar New Year, which, this year, is due at the end of January.
3) Wall Street sparked a global rally in stocks on Friday after a crucial U.S. jobs report showed wage growth slowed in December, fuelling investor bets that inflation is easing and that the Federal Reserve need not be as aggressive as some feared.
Trend is Bullish
Fundamental Range : 1,865.20 – 1875.29
(Disclaimer: The range can be more or lesser however it will definately cross this range for the daily.) (Safe range provided)

Technical Analysis
Check at Daily Timeframe Support and Resistance for Fibonacci.
Check based on the current timing for the Support and Resistance when you want to go into trade.
Resistance Area :1869.98,1870.77,1872.05
Support Area : 1867.49,1866.61, 1865.20
Pivot point : 1868.90
Confirm with technical indicators and based on your own technical analysis for the trend.
Check investing.com to get more info on what most indicator would display
Check higher timeframe also for more confirmation for entry in Daily timeframe.
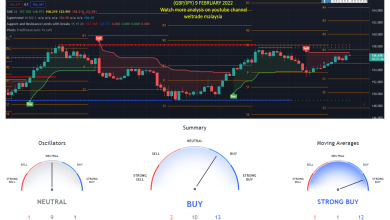
The technical indicator display strong buy in Daily and strong buy in weekly and buy in monthly timeframe.
Use linear regression to get confirmation trend at daily as they are not available in investing.com
Linear regression shows a uptrend at the daily timeframe .Can check linear regression trend in weekly and monthly for more confirmation.For weekly, it is downtrend and for monthly,it is showing uptrend.
Use Bolinger Band Strategy Tester and RSI Strategy Tester to get more confirmation for the trend and percent profitable.Check at bigger timeframe also such as weekly and monthly.
Ensure that both RSI strategy and Bolinger Band Strategy gives above 50%. for the percent profitable
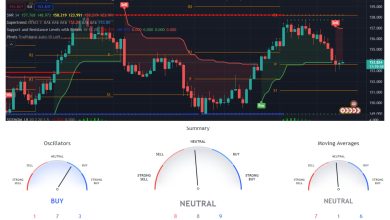
RSI strategy tester and Bolinger Band Strategy Tester at the daily and weekly has percentage higher than 50% , supporting towards neutral or slight downtrend compare to the other timeframe such as Monthly.
Gold : Find buy at the daily chart at 1865.97 and take profit will be at the pivot point, 1868.70 or at the third resistance point 1875.29 (SEE CURRENT MARKET PRICE WHEN ENTRY)
Fundamental and Technical analysis must be aligned
For further information, contact me ,Gurmit at +60142584067, I will guide anyone who wants to register with Weltrade. You can register at the link below. Thank you.
https://my.weltrade.com/?r1=ipartner&r2=49989
DISCLAIMER :This analysis is based on Investing.com and Forexfactory.com. You may follow based on your own discreetion.
Can join at our telegram group Education and Signal at https://t.me/+NfCxZrhbyZIzMGI1
For traders who want to trade on their own can join Weltrade, we provide benefits for traders out there, learn to trade and follow free signals such as free paid signal providers, bookmap gold and tradingview premium live.
Free Bookmap Education t.me/+JetSe33YA0U2ZDk1
Join us at our zoom for online learning from 10.30am to 11.30am by the Financial Markets Research Center (FMRC) team. With Cikgu Gurmit
Link: https://us06web.zoom.us/j/81843968428?pwd=VkZ3L2UrcXh2WlZsZHU3ZFFGUmJMQT09
Komen anda
Source link