Please note: the CoTs report was published 9/30/2022 for the period ending 9/27/2022. “Managed Money” and “Hedge Funds” are used interchangeably.
Gold
Current Trends
Managed Money continues to hammer the price of gold lower as the Net Short position increased to -43k contracts. While Managed Money grows more pessimistic on the metal, the overall market continues to shrink as can be seen below with the narrowing of the market.
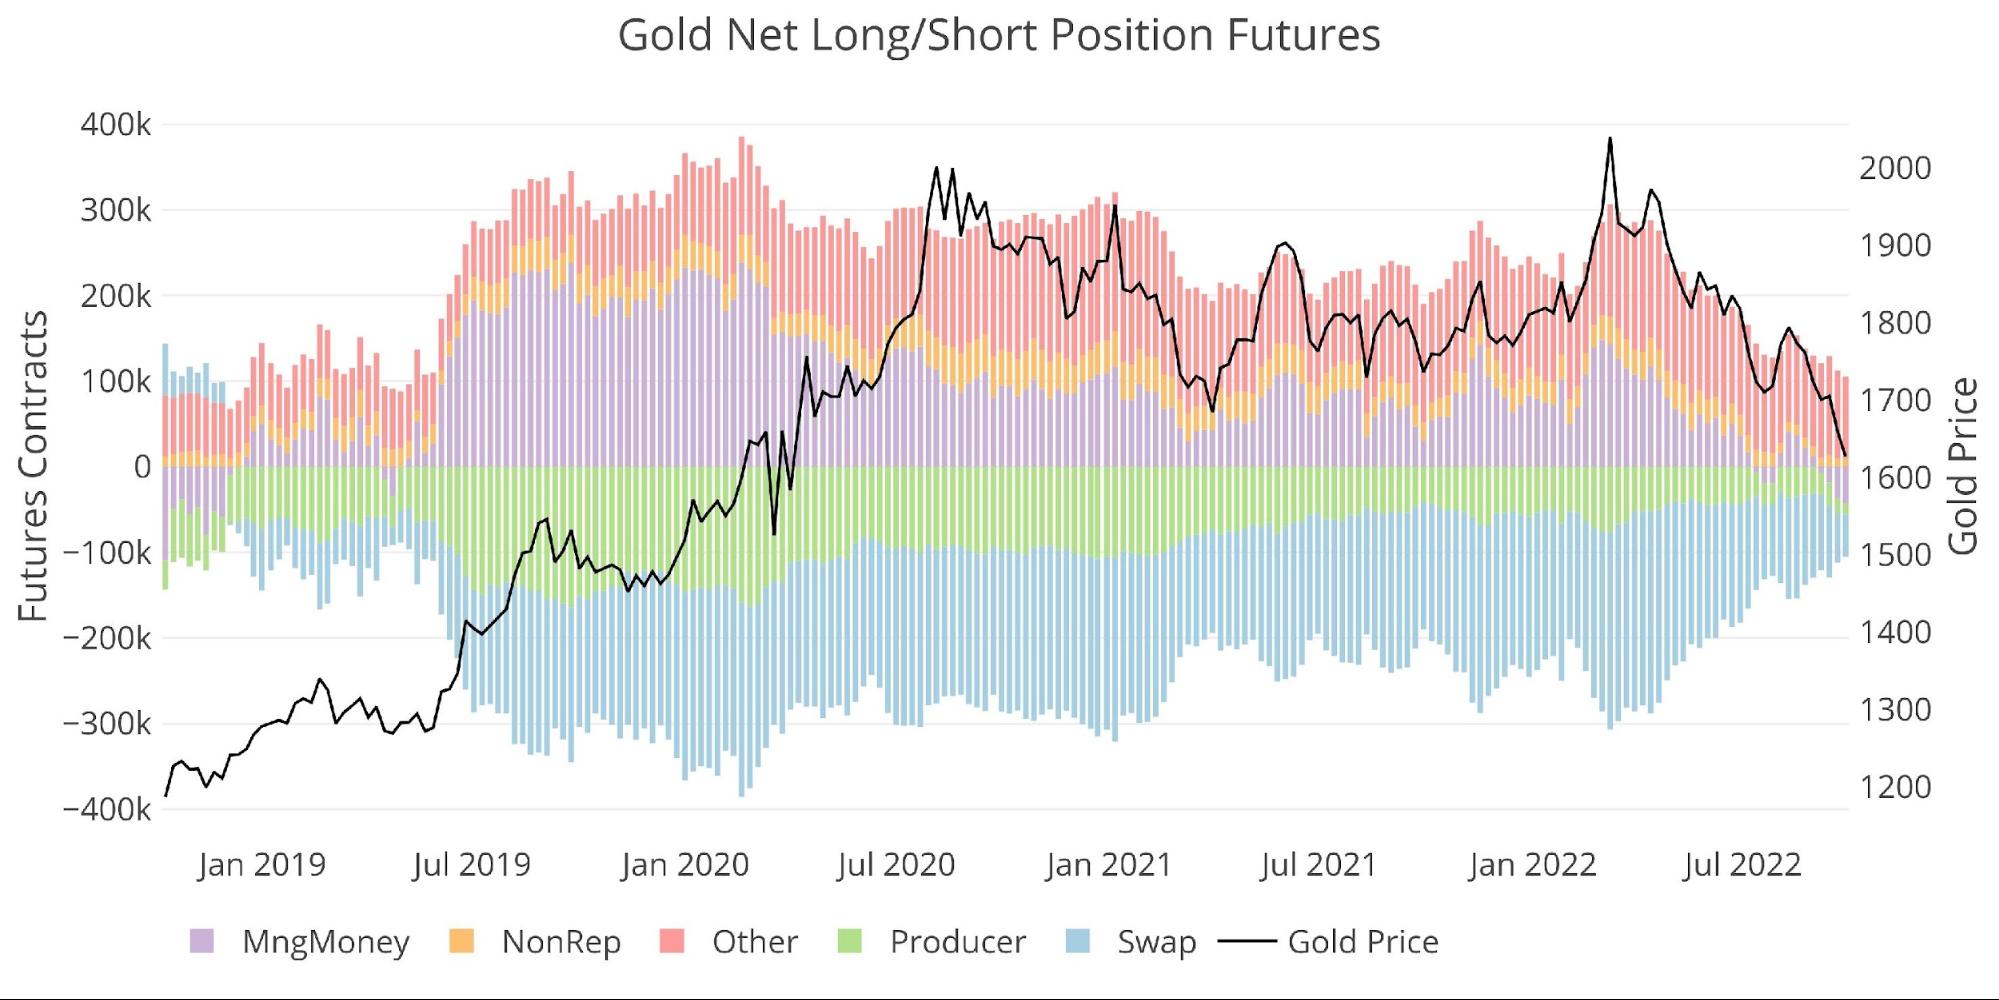
Figure: 1 Net Notional Position
Managed Money net shorts have taken out the Net Short from 2019 and now show the largest Net Short position since November 2018.
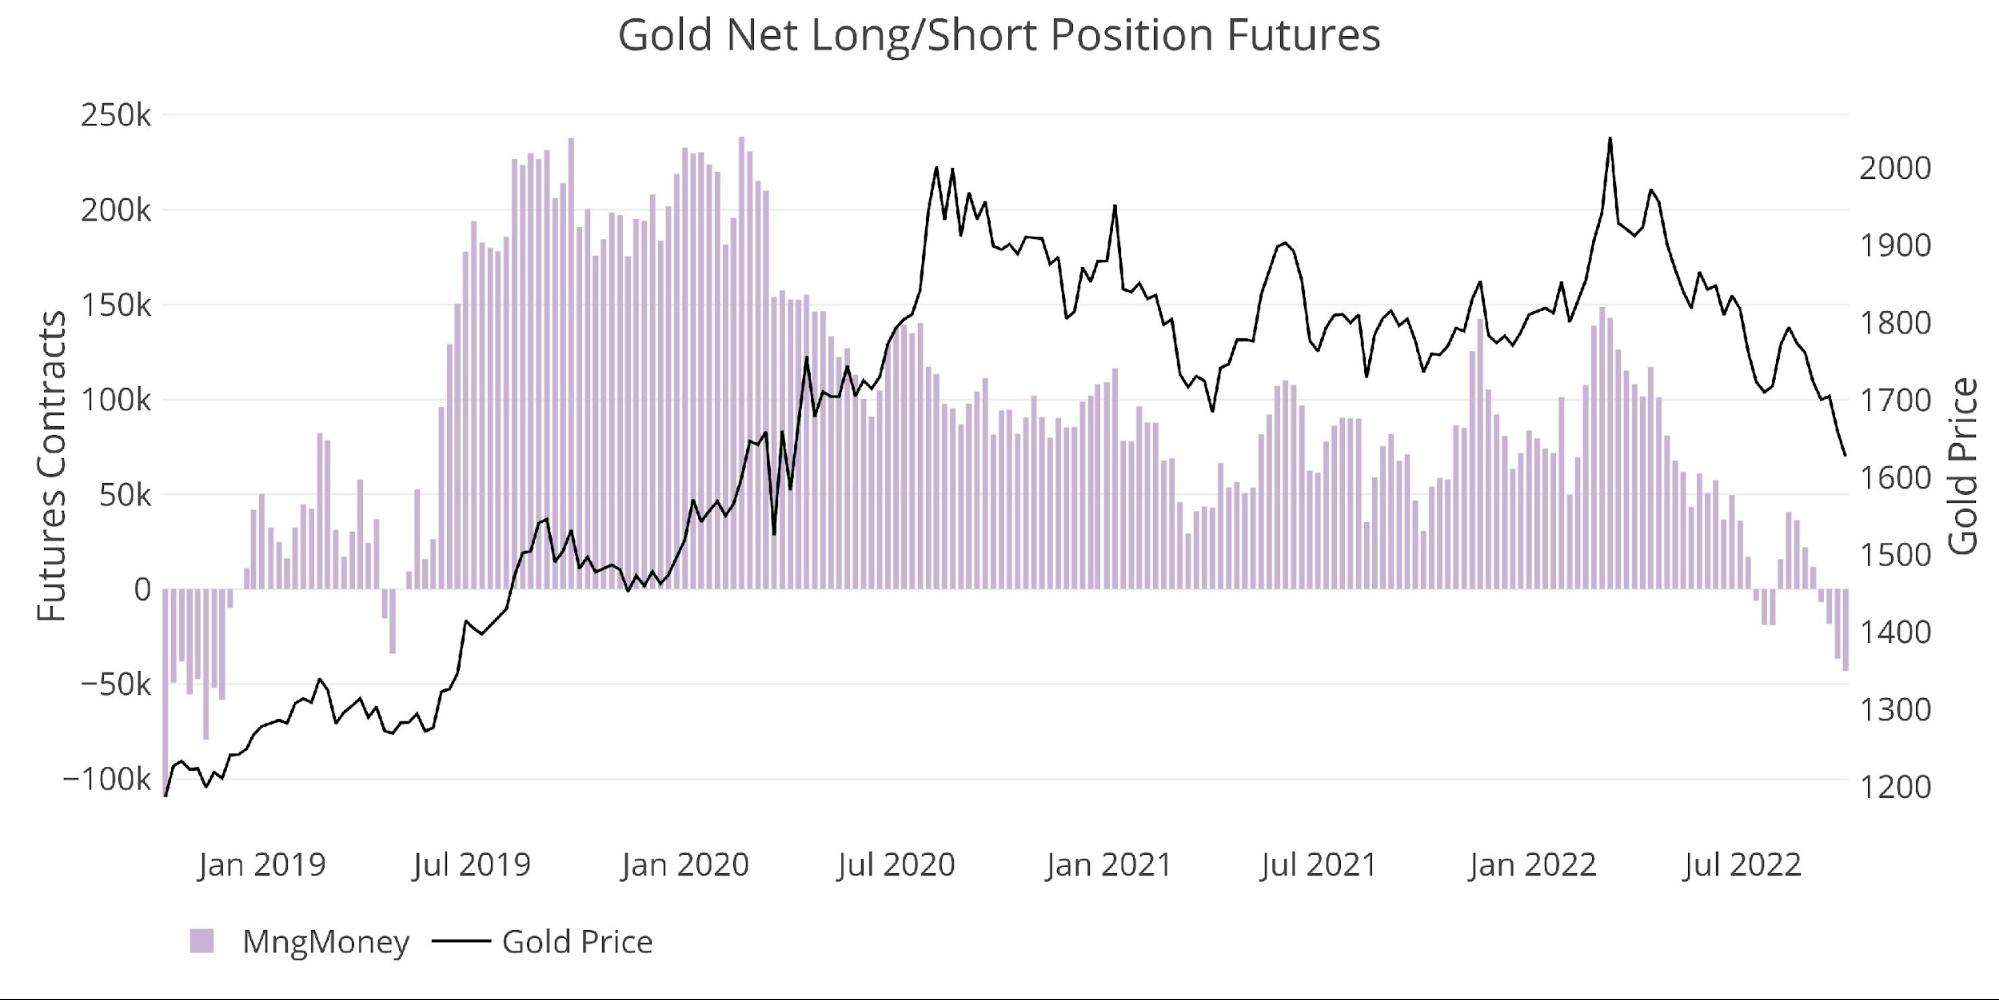
Figure: 2 Managed Money Net Notional Position
Weak Hands at Work
Managed Money is very speculative in nature, jumping in and out of the market quickly. That being said, Managed Money has been completely one-directional (short) for 7 weeks in a row. This is the longest such stretch since Managed Money set a record back in August 2018 with 10 straight weeks of increasing Net Shorts.
That was when gold last bottomed at $1207 before ripping 66% in 2 years up to +$2000. Sentiment is equally bearish now, setting up for the possibility of a true short squeeze… especially when the Fed “unexpectedly” pivots in the months ahead.
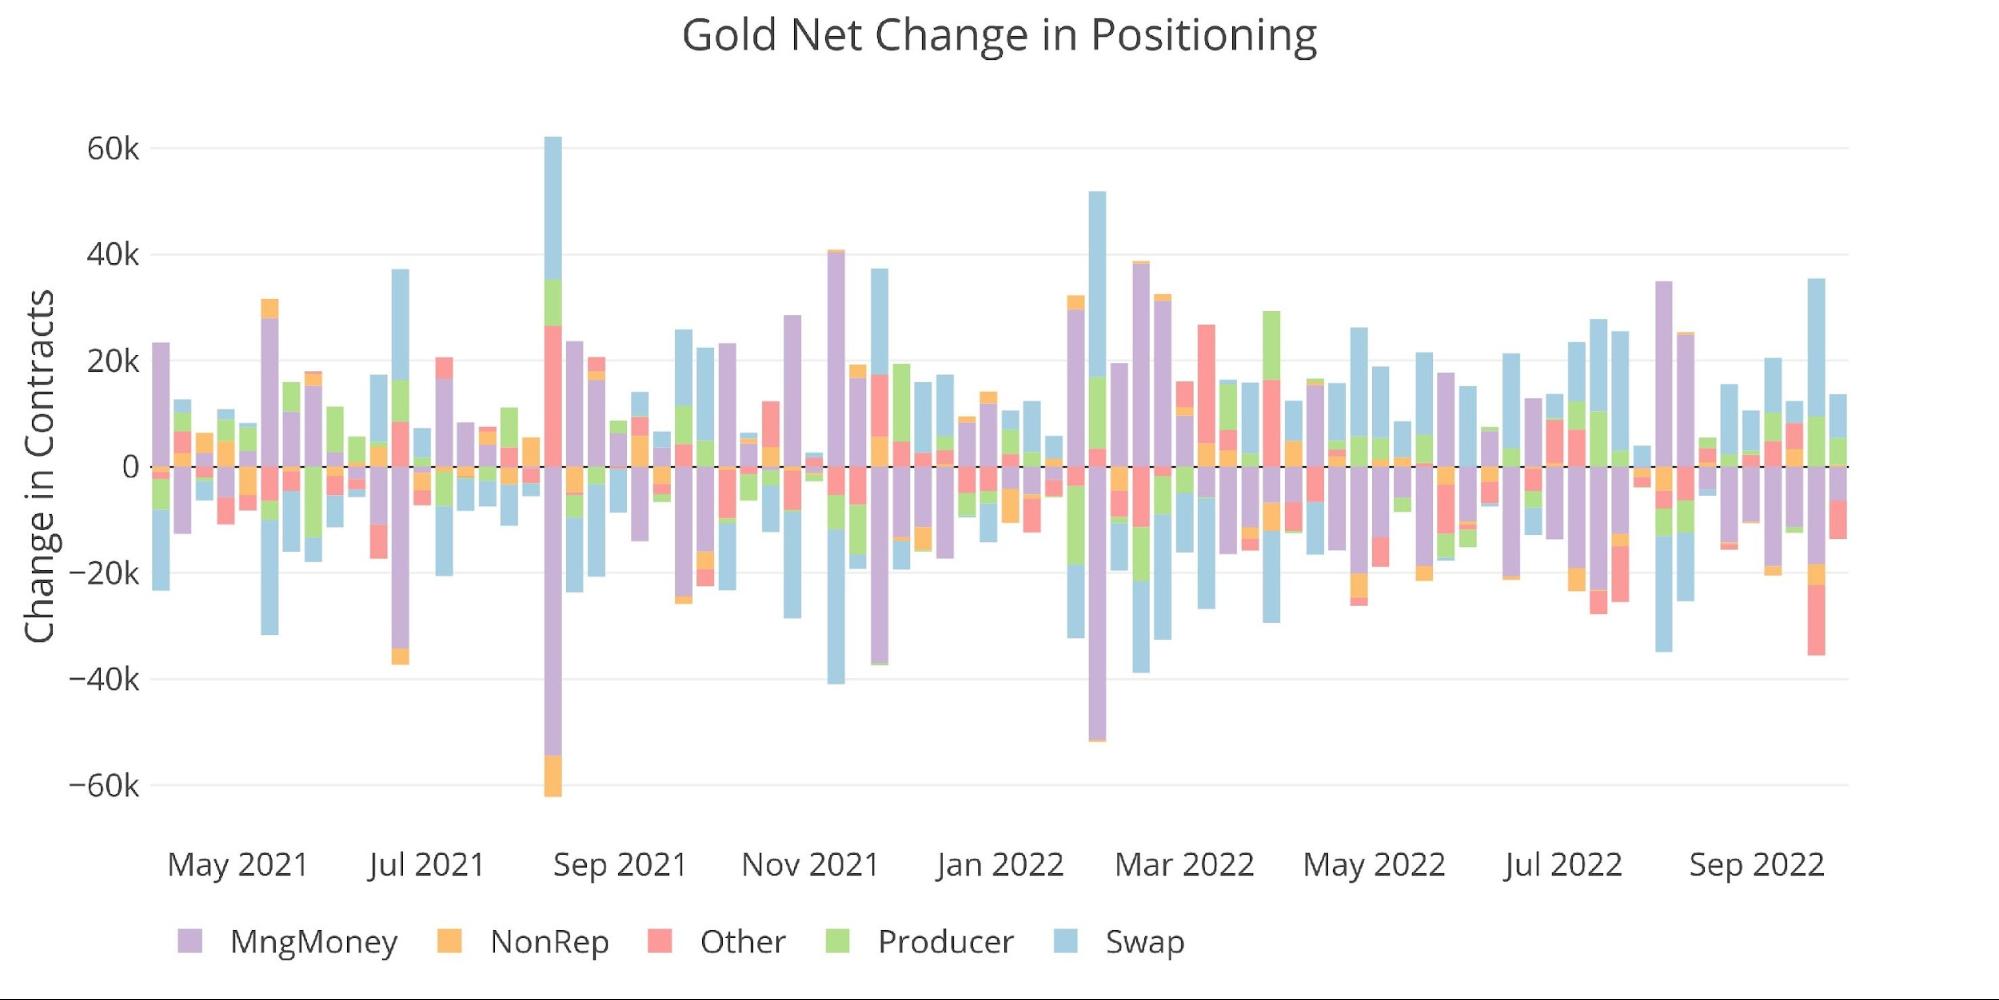
Figure: 3 Silver 50/200 DMA
The table below has detailed positioning information. A few things to highlight:
-
- Over the month, Managed Money was driven on both the long and short side
-
- Gross Longs fell nearly 20%
- Gross Shorts increased an incredible 46% from -80K to -117k
-
- Other Gross Longs fell 7.4% over the month and is now down 24% since last year
-
- Gross Longs have reduced their massive Covid increase by more than 50%
-
- Swap sat on the other side of Managed Money per usual – decreasing Net Short position by 50%
- Over the month, Managed Money was driven on both the long and short side
People have speculated that if “Other Longs” throw in the towel on gold it could drive it to new multi-year lows, potentially even below $1500. This does not seem fully supported by the data. Three years ago, Other Gross Long stood at 104k and increased substantially to 174k. It has dropped back to 132k which means it would only need to shed another 28k contracts to eliminate the new position entirely. This is about half the selling from Managed Money in the last month alone. If “Other” liquidated it would probably create a washout without a full collapse in the price.
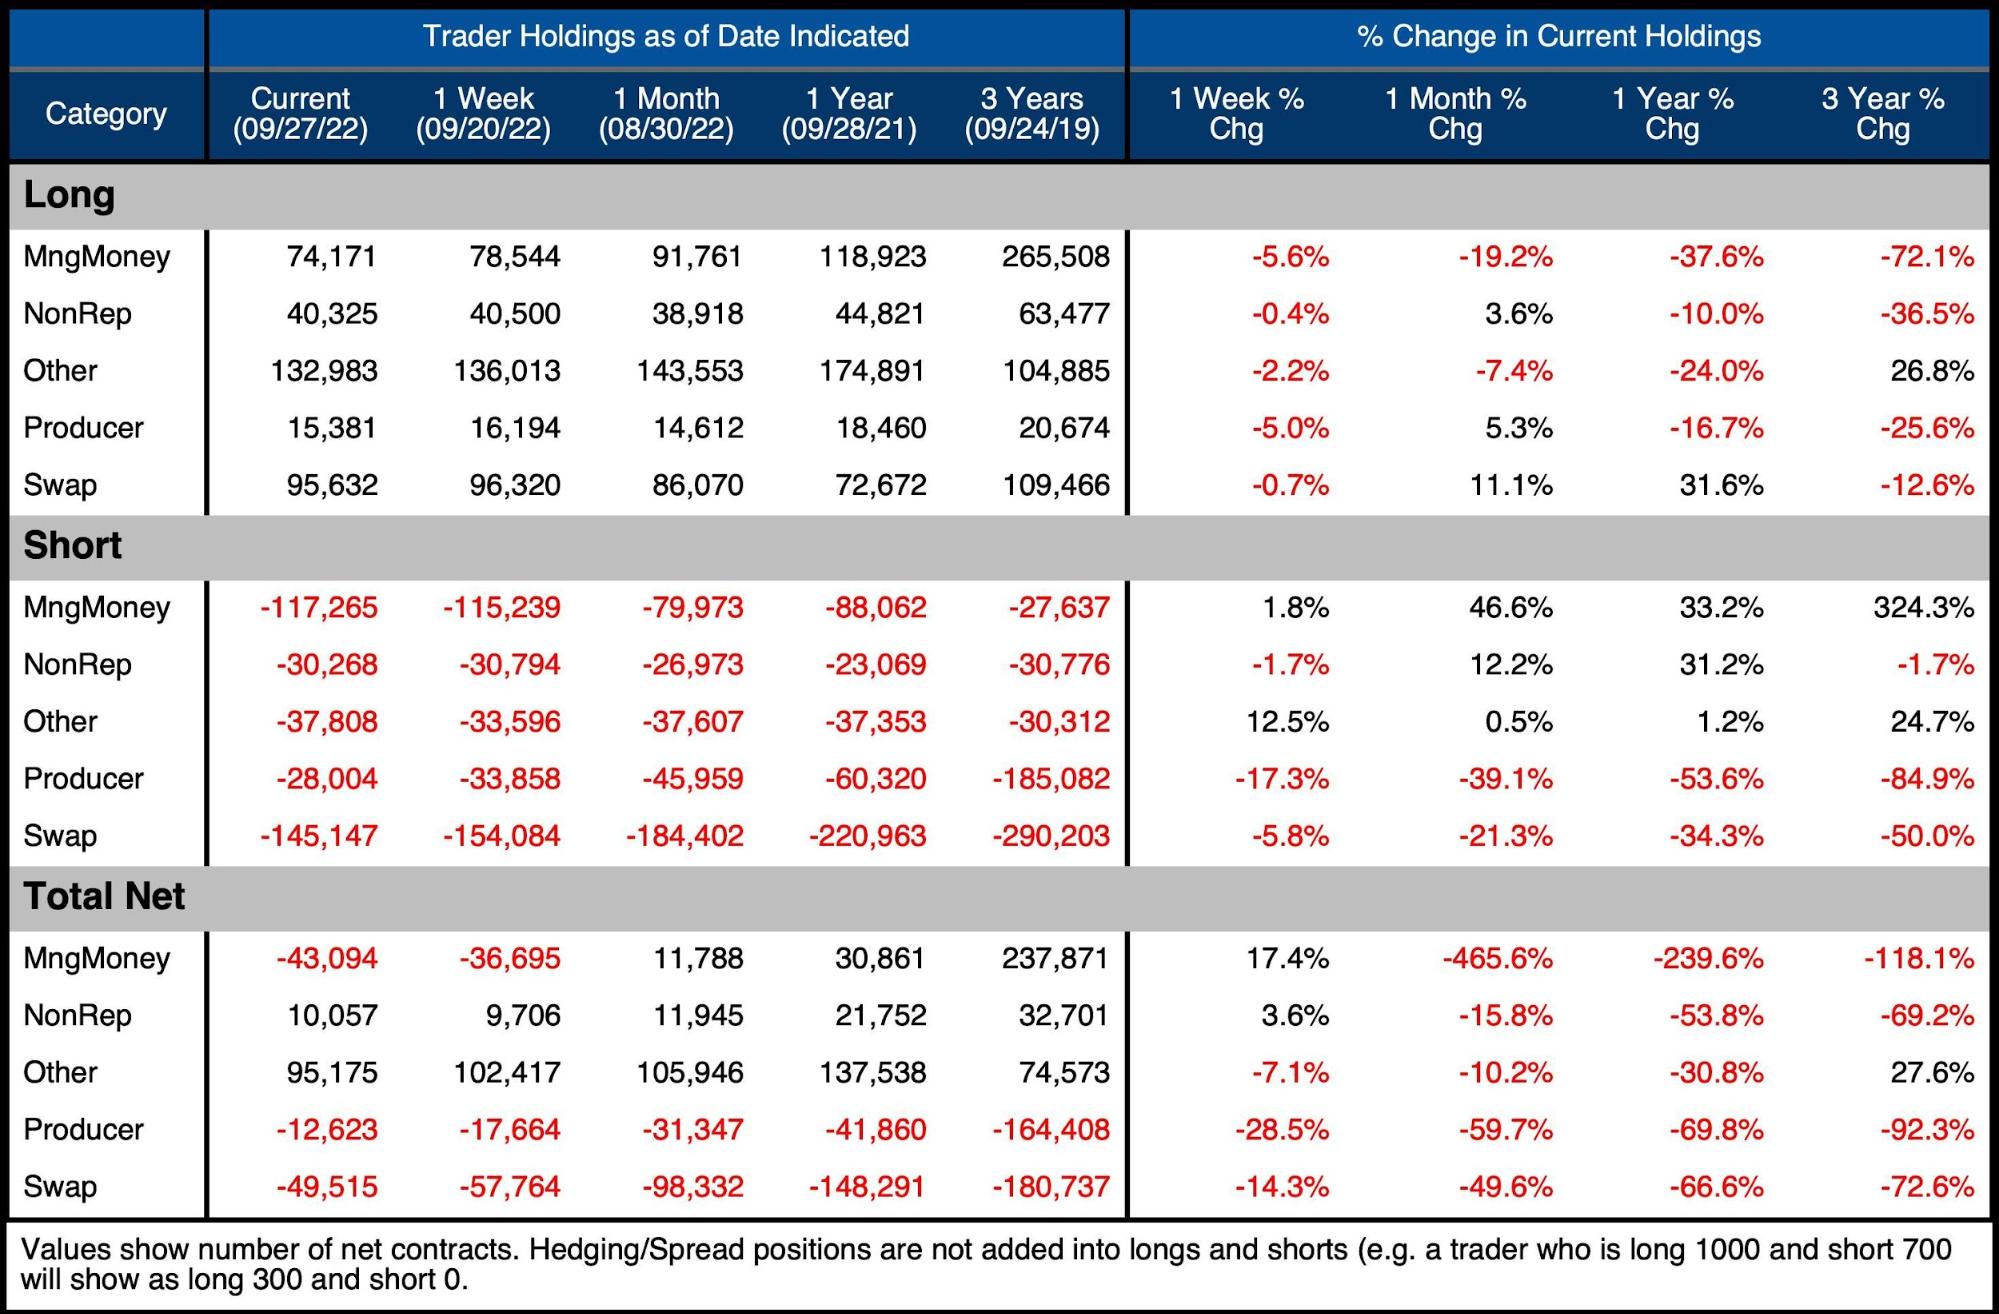
Figure: 4 Gold Summary Table
Net positioning continues to fall. Total net positioning represents the combined exposure of the groups once hedging positions are removed. It shows the size of net positions divided by total open interest. As can be seen below, this has fallen off a cliff in 2022. In April it stood at 50% and has dropped to 23%.

Figure: 5 Net Positioning
Historical Perspective
Looking over the full history of the CoTs data by month produces the chart below (values are in dollar/notional amounts, not contracts). After coming close to $100B twice, the market has retreated to $58B, which is the lowest amount since May 2019.
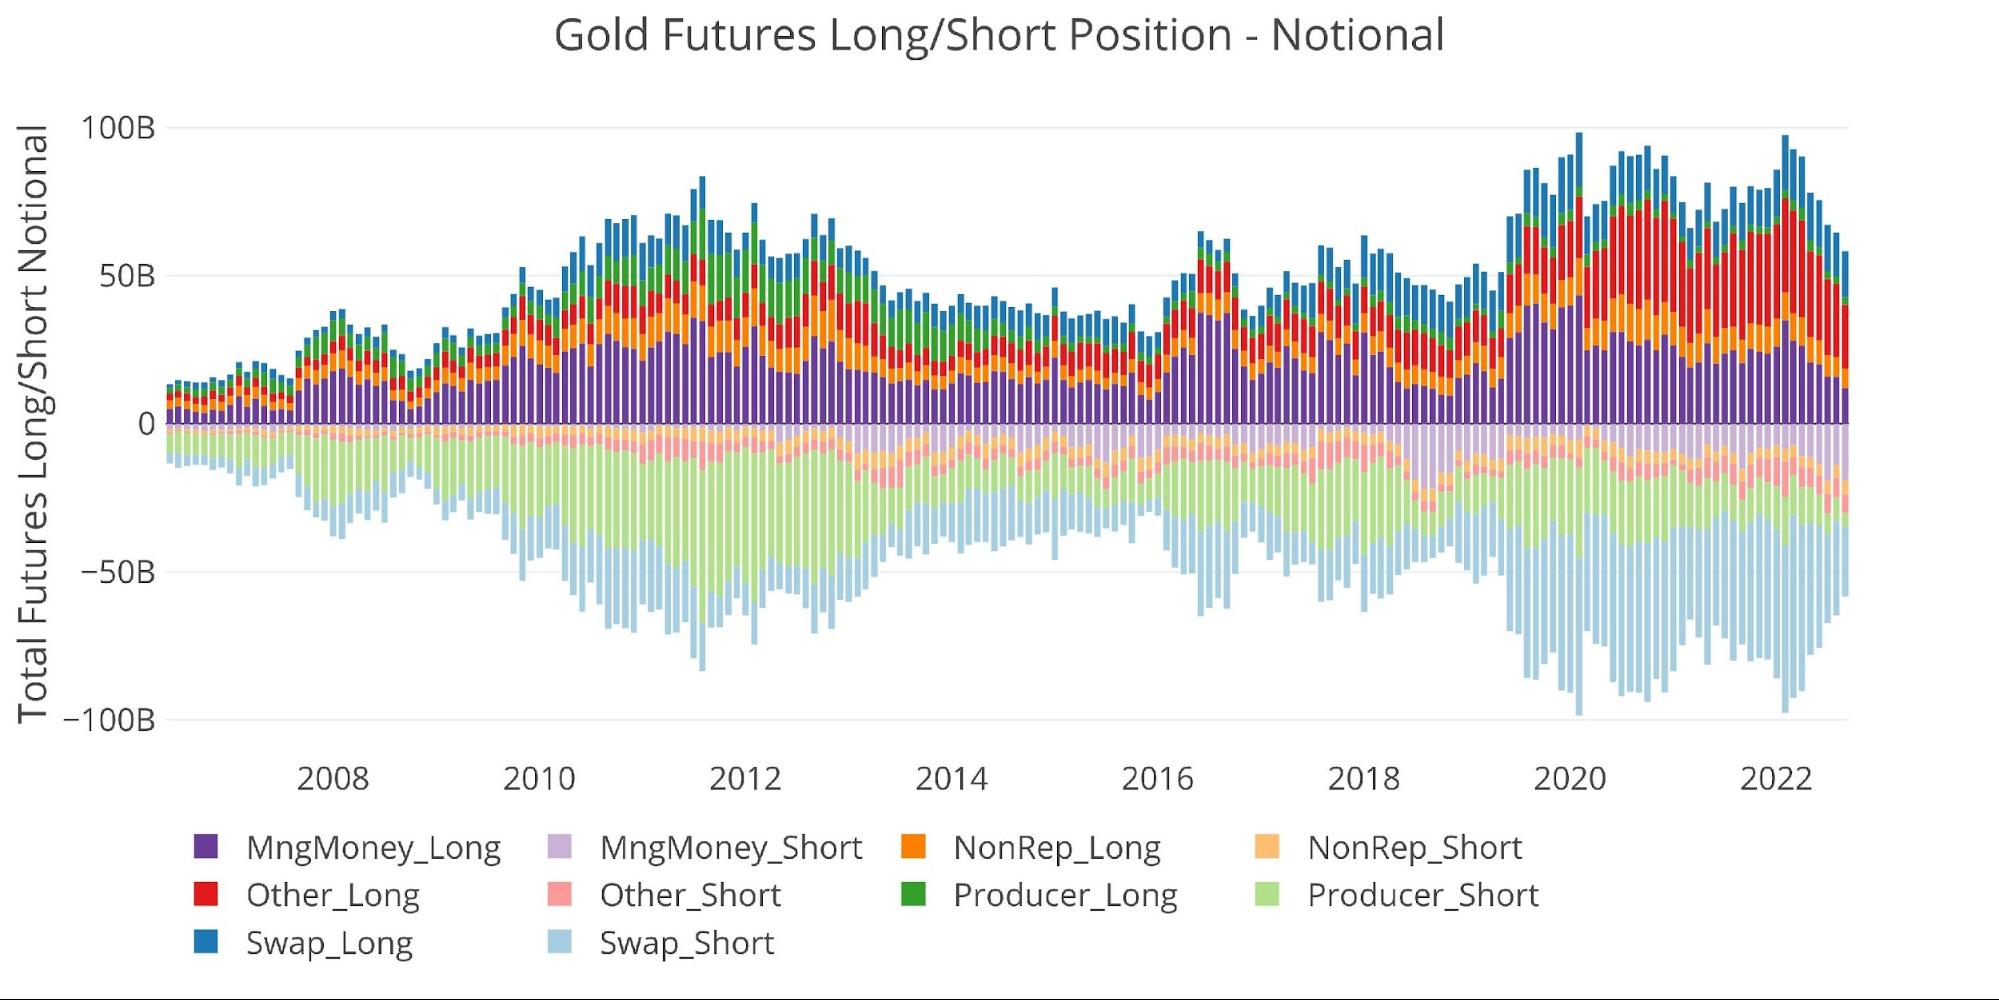
Figure: 6 Gross Open Interest
The chart below looks at net notional positioning against price over a longer time frame. The lack of interest in gold is very visible from this chart as positions have plummeted in recent months. The good news is that the last time OI positioning was this low was back in 2019 when gold was $400 lower.
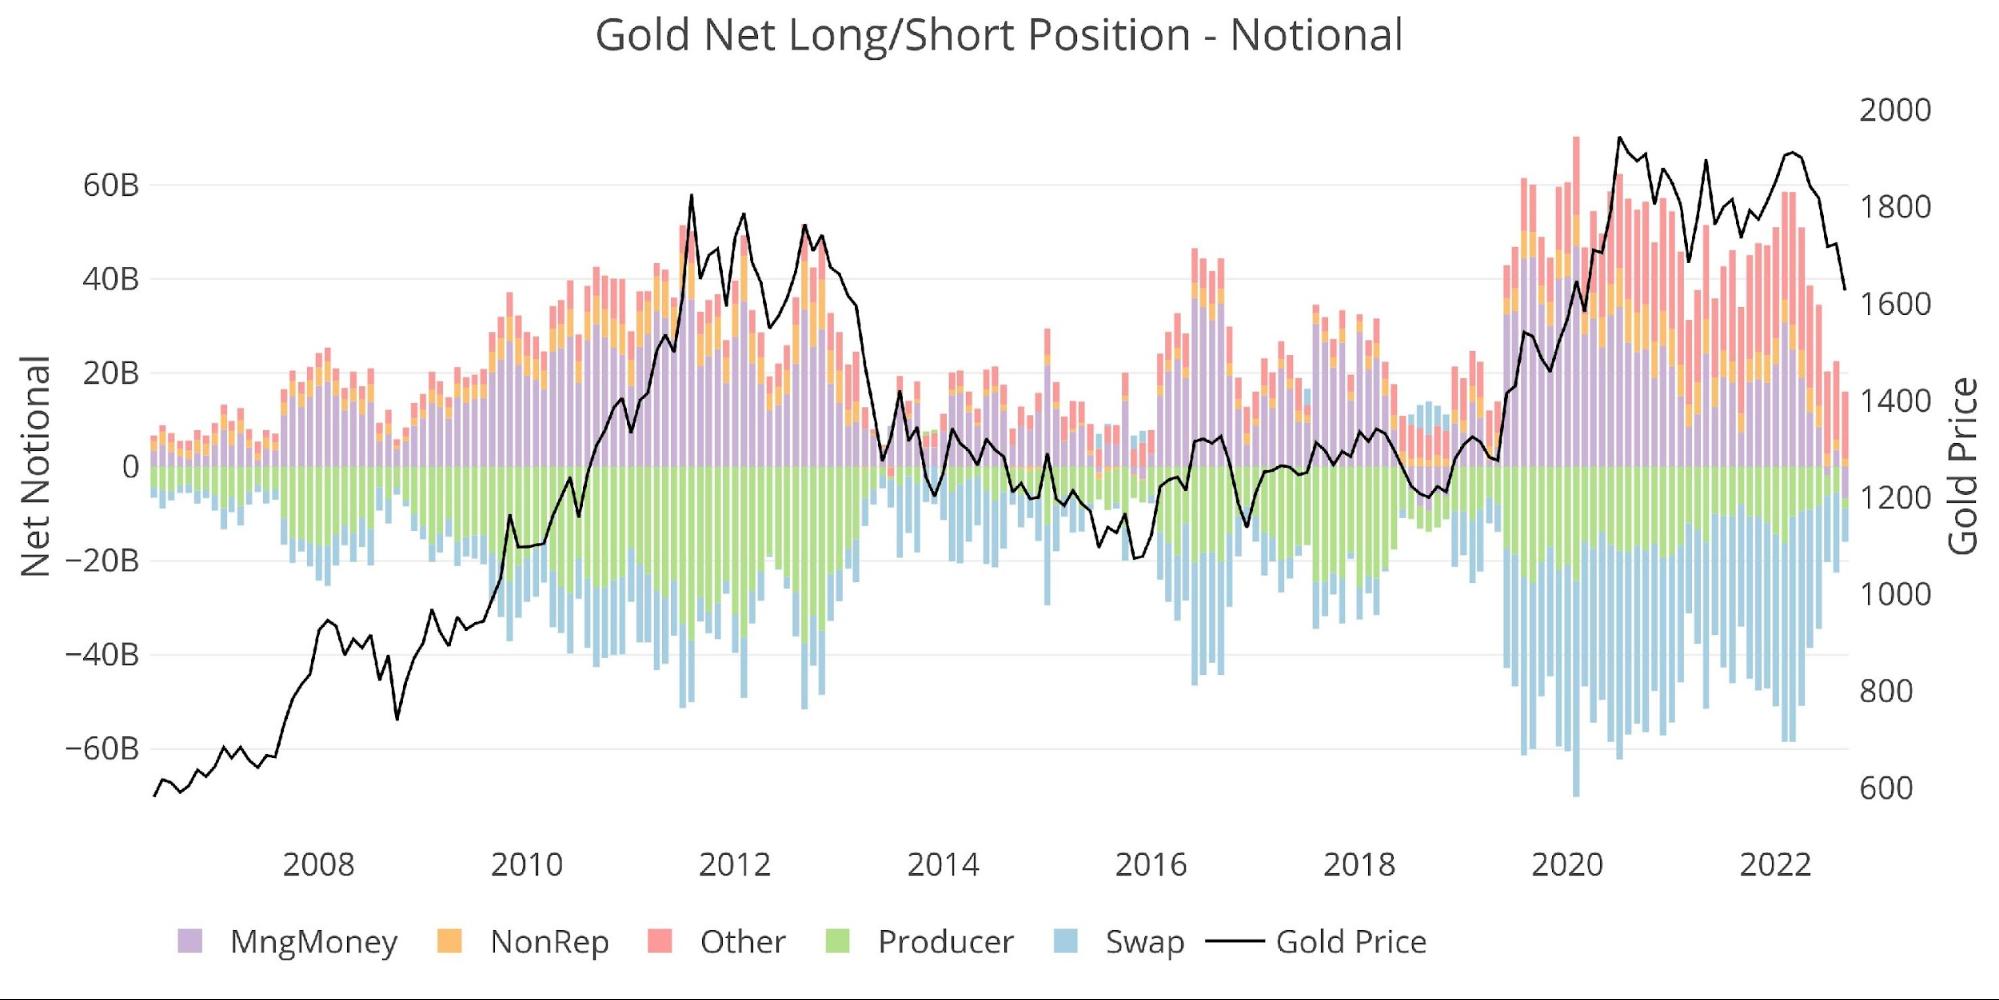
Figure: 7 Net Notional Position
Finally, the CFTC also provides Options data. The chart below further reveals the collapse in activity. After getting above a gross value of $26B, the market has fallen to $3B! The majority of this collapse has come from the Producer side, with gross longs falling to the lowest level since May 2008. Managed Money has also reduced its long positions considerably, and is now well under $1B.
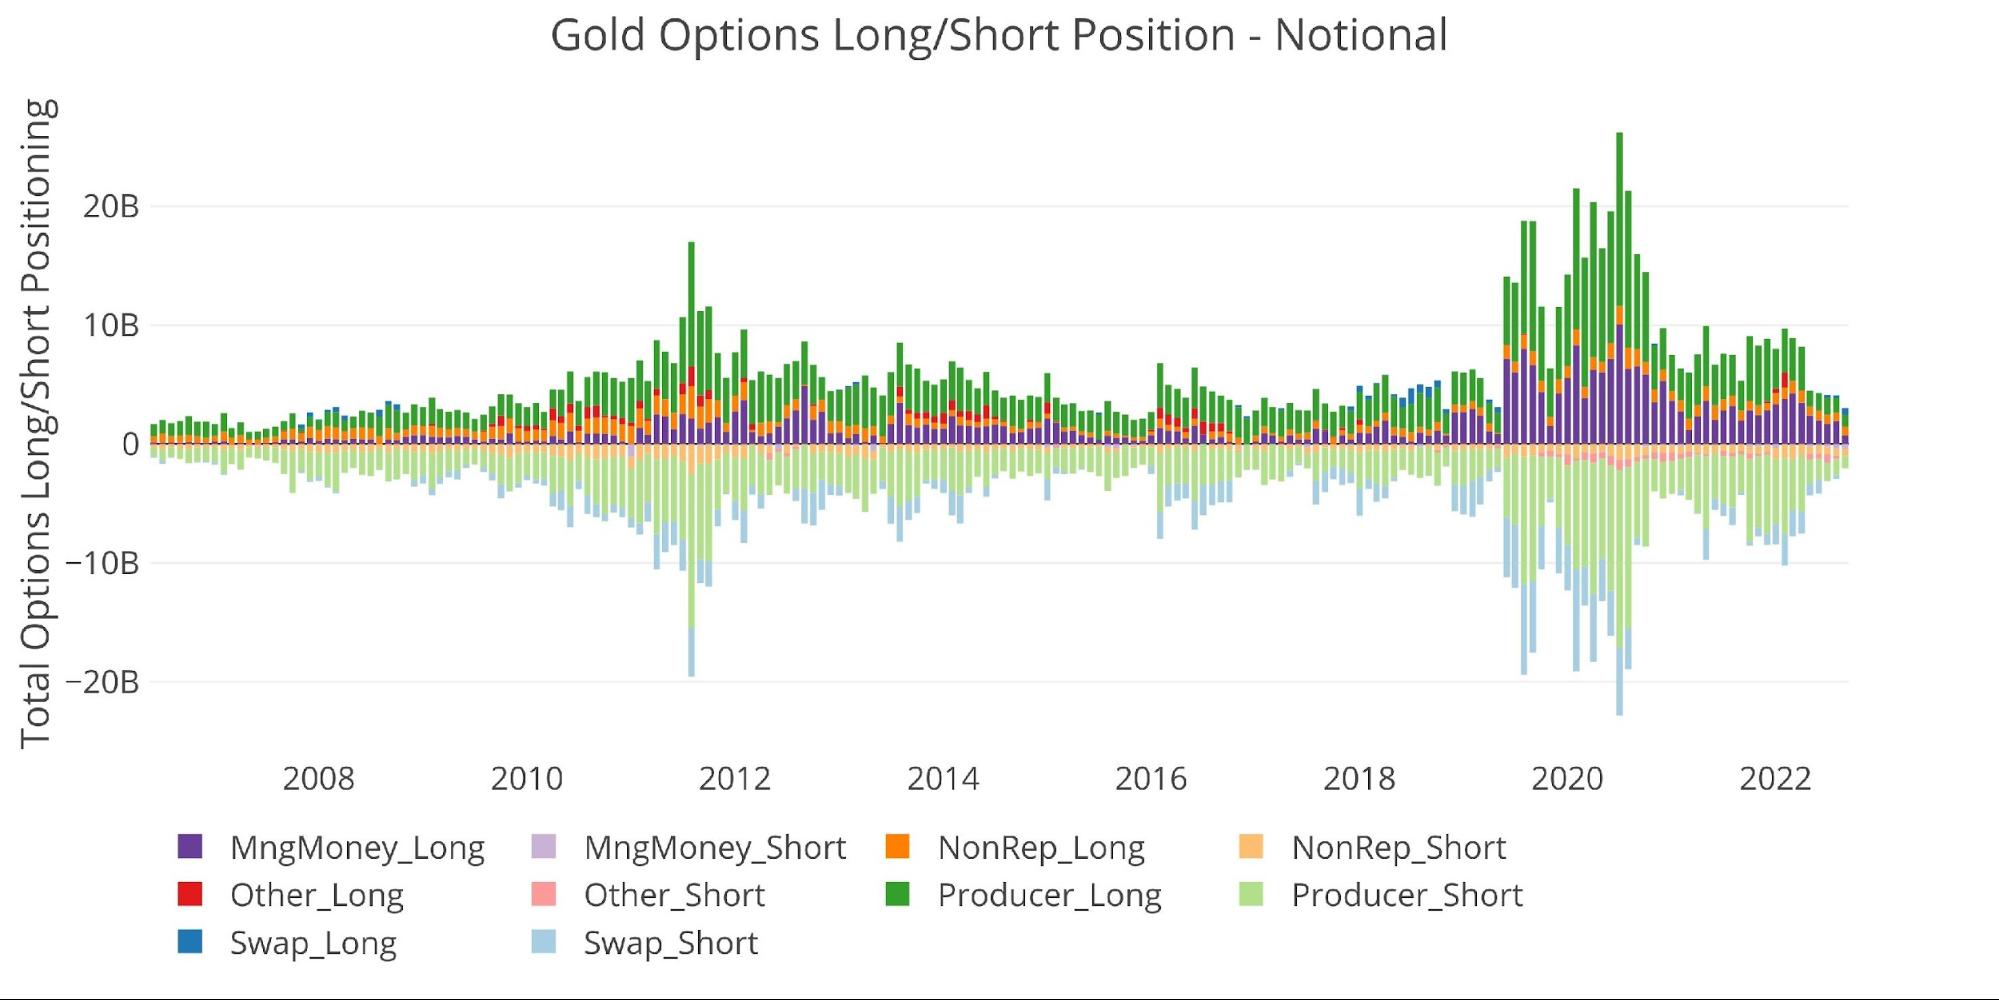
Figure: 8 Options Positions
Silver
Current Trends
Managed Money has also absolutely hammered silver lower while Swap has been on the other side, building a long position over the last three months. In September, Swap Net Long hit the highest point since October 2018.
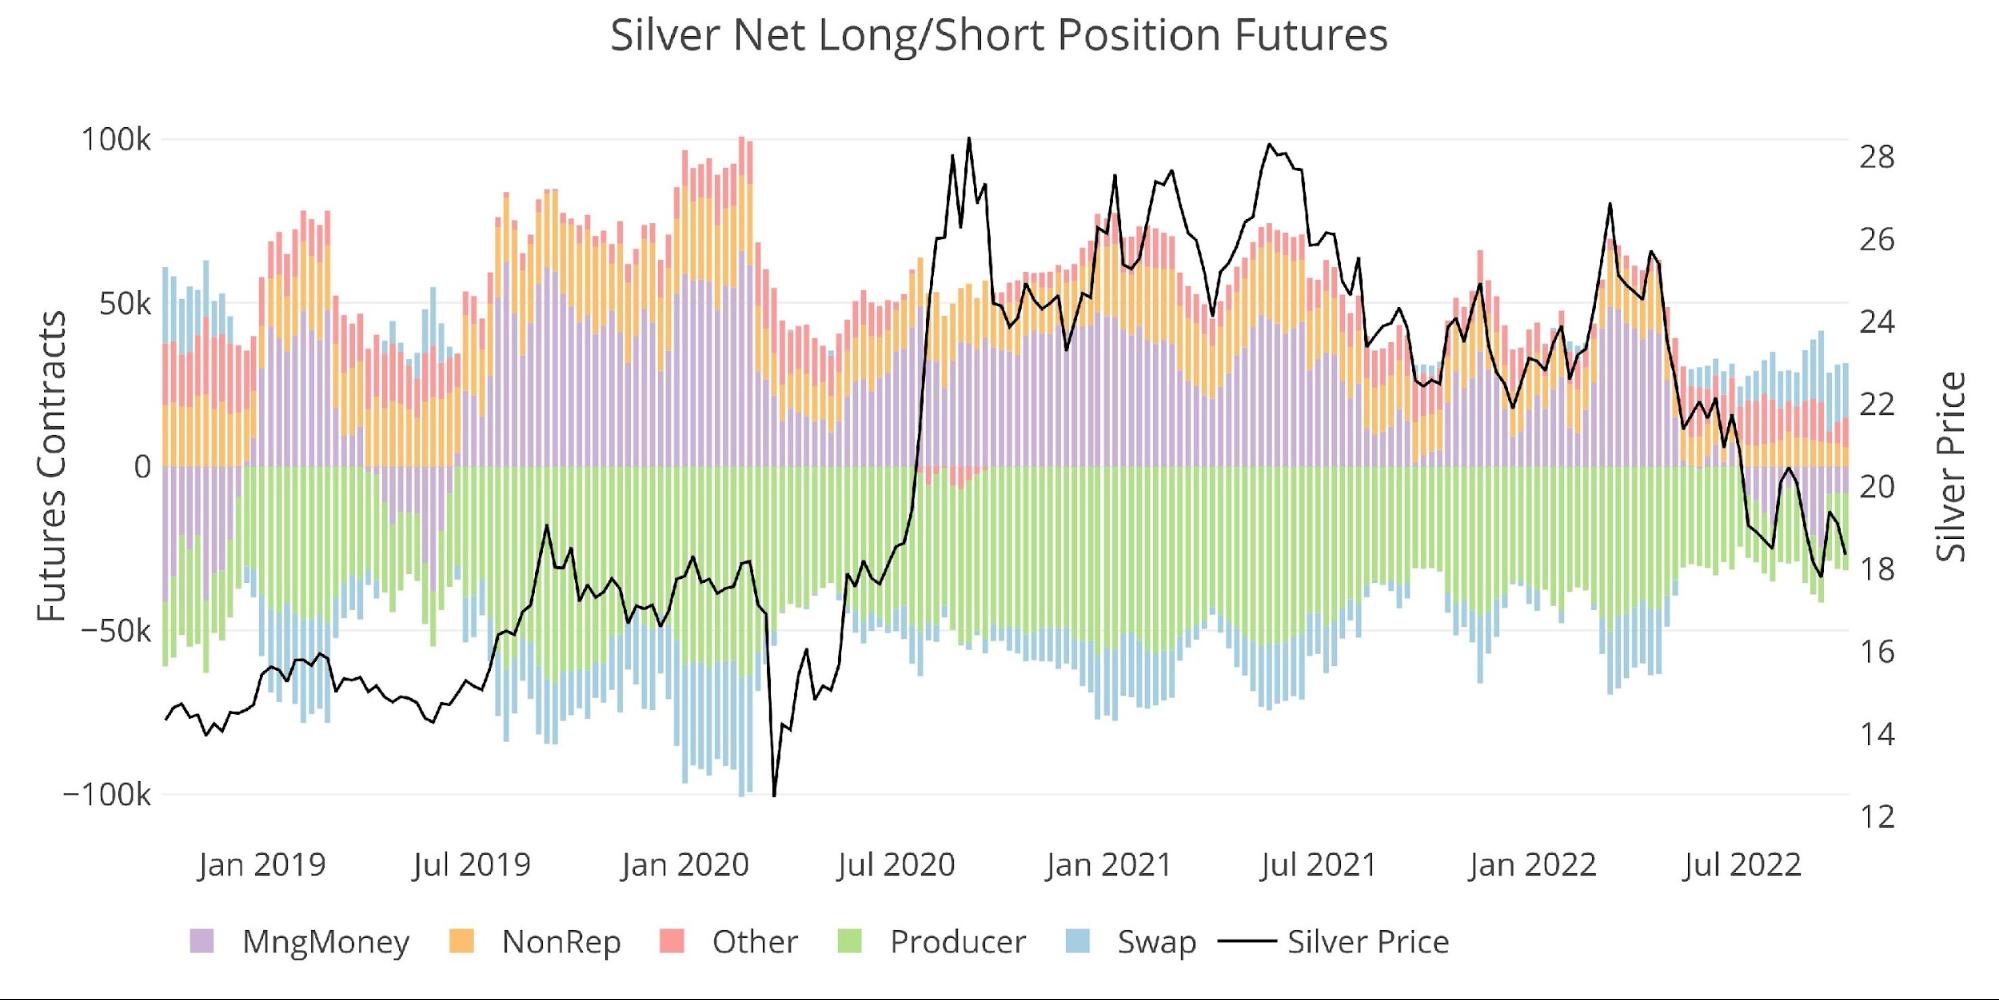
Figure: 9 Net Notional Position
While gold is seeing Managed Money reach new lows, silver has actually seen a rebound with Net Shorts shrinking. Net Shorts still sit at -8,093 contracts.
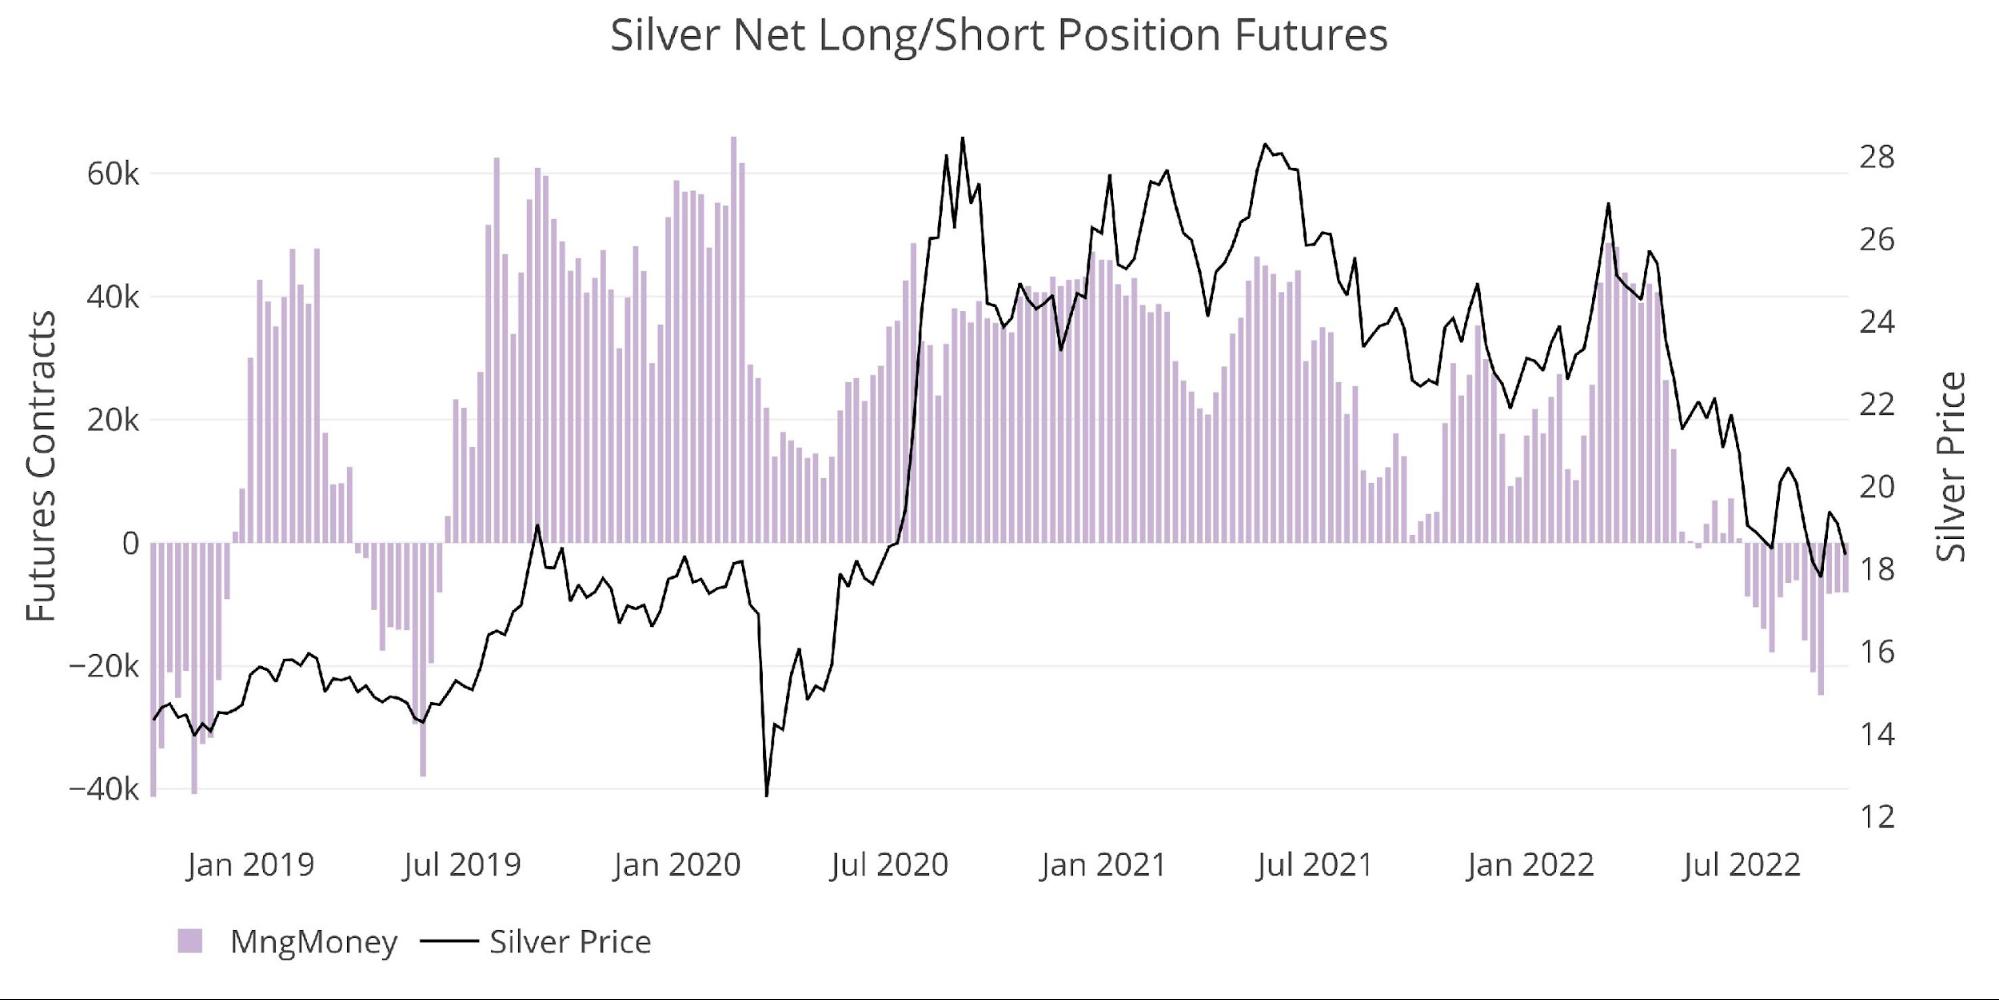
Figure: 10 Managed Money Net Notional Position
The chart below shows how Managed Money covered their short position three weeks ago, buying back 16k contracts which represented two-thirds of the Net Short position.
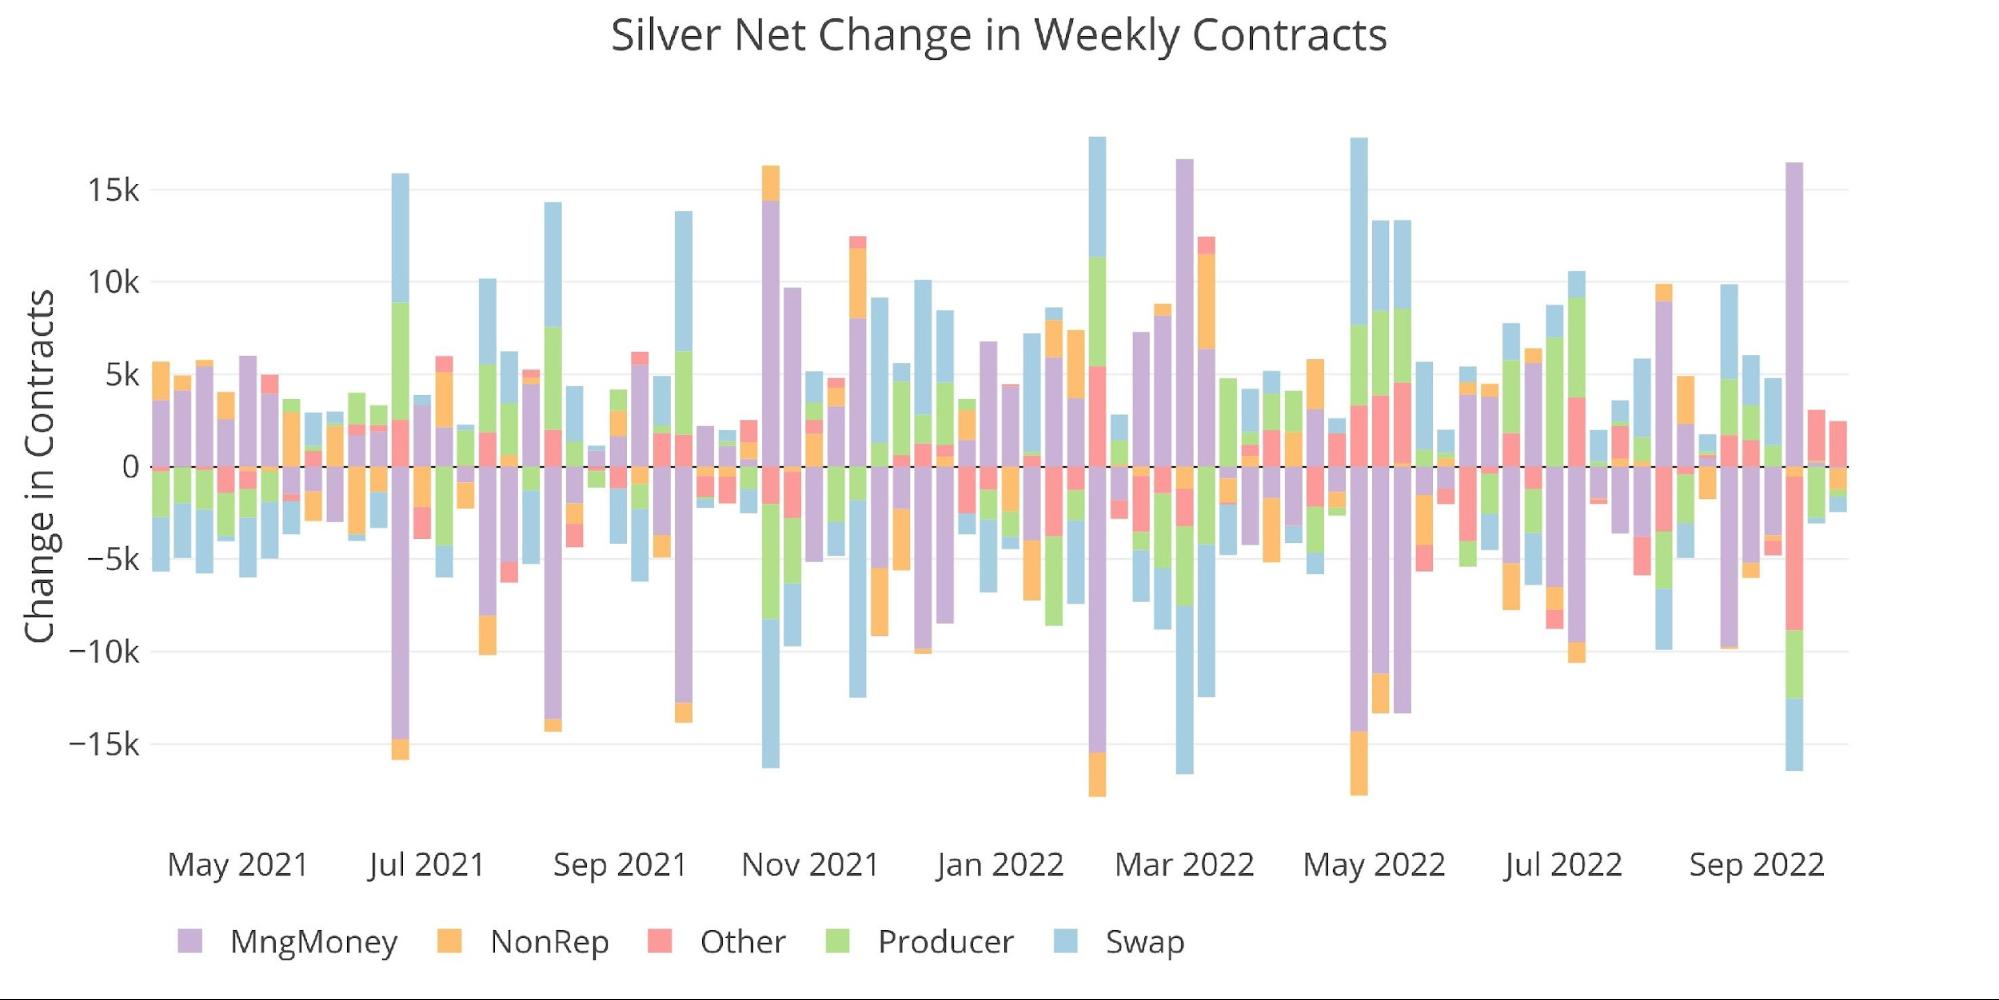
Figure: 11 Net Change in Positioning
The table below shows a series of snapshots in time. This data does NOT include options or hedging positions. Important data points to note:
-
- Managed Money activity was driven by the long and short side
-
- Gross Longs increased 10%
- Gross Shorts decreased 18.5%
-
- Producers cut their Gross Long position in half
-
- This resulted in Producer Net Short increasing by 31.7%
-
- Managed Money activity was driven by the long and short side
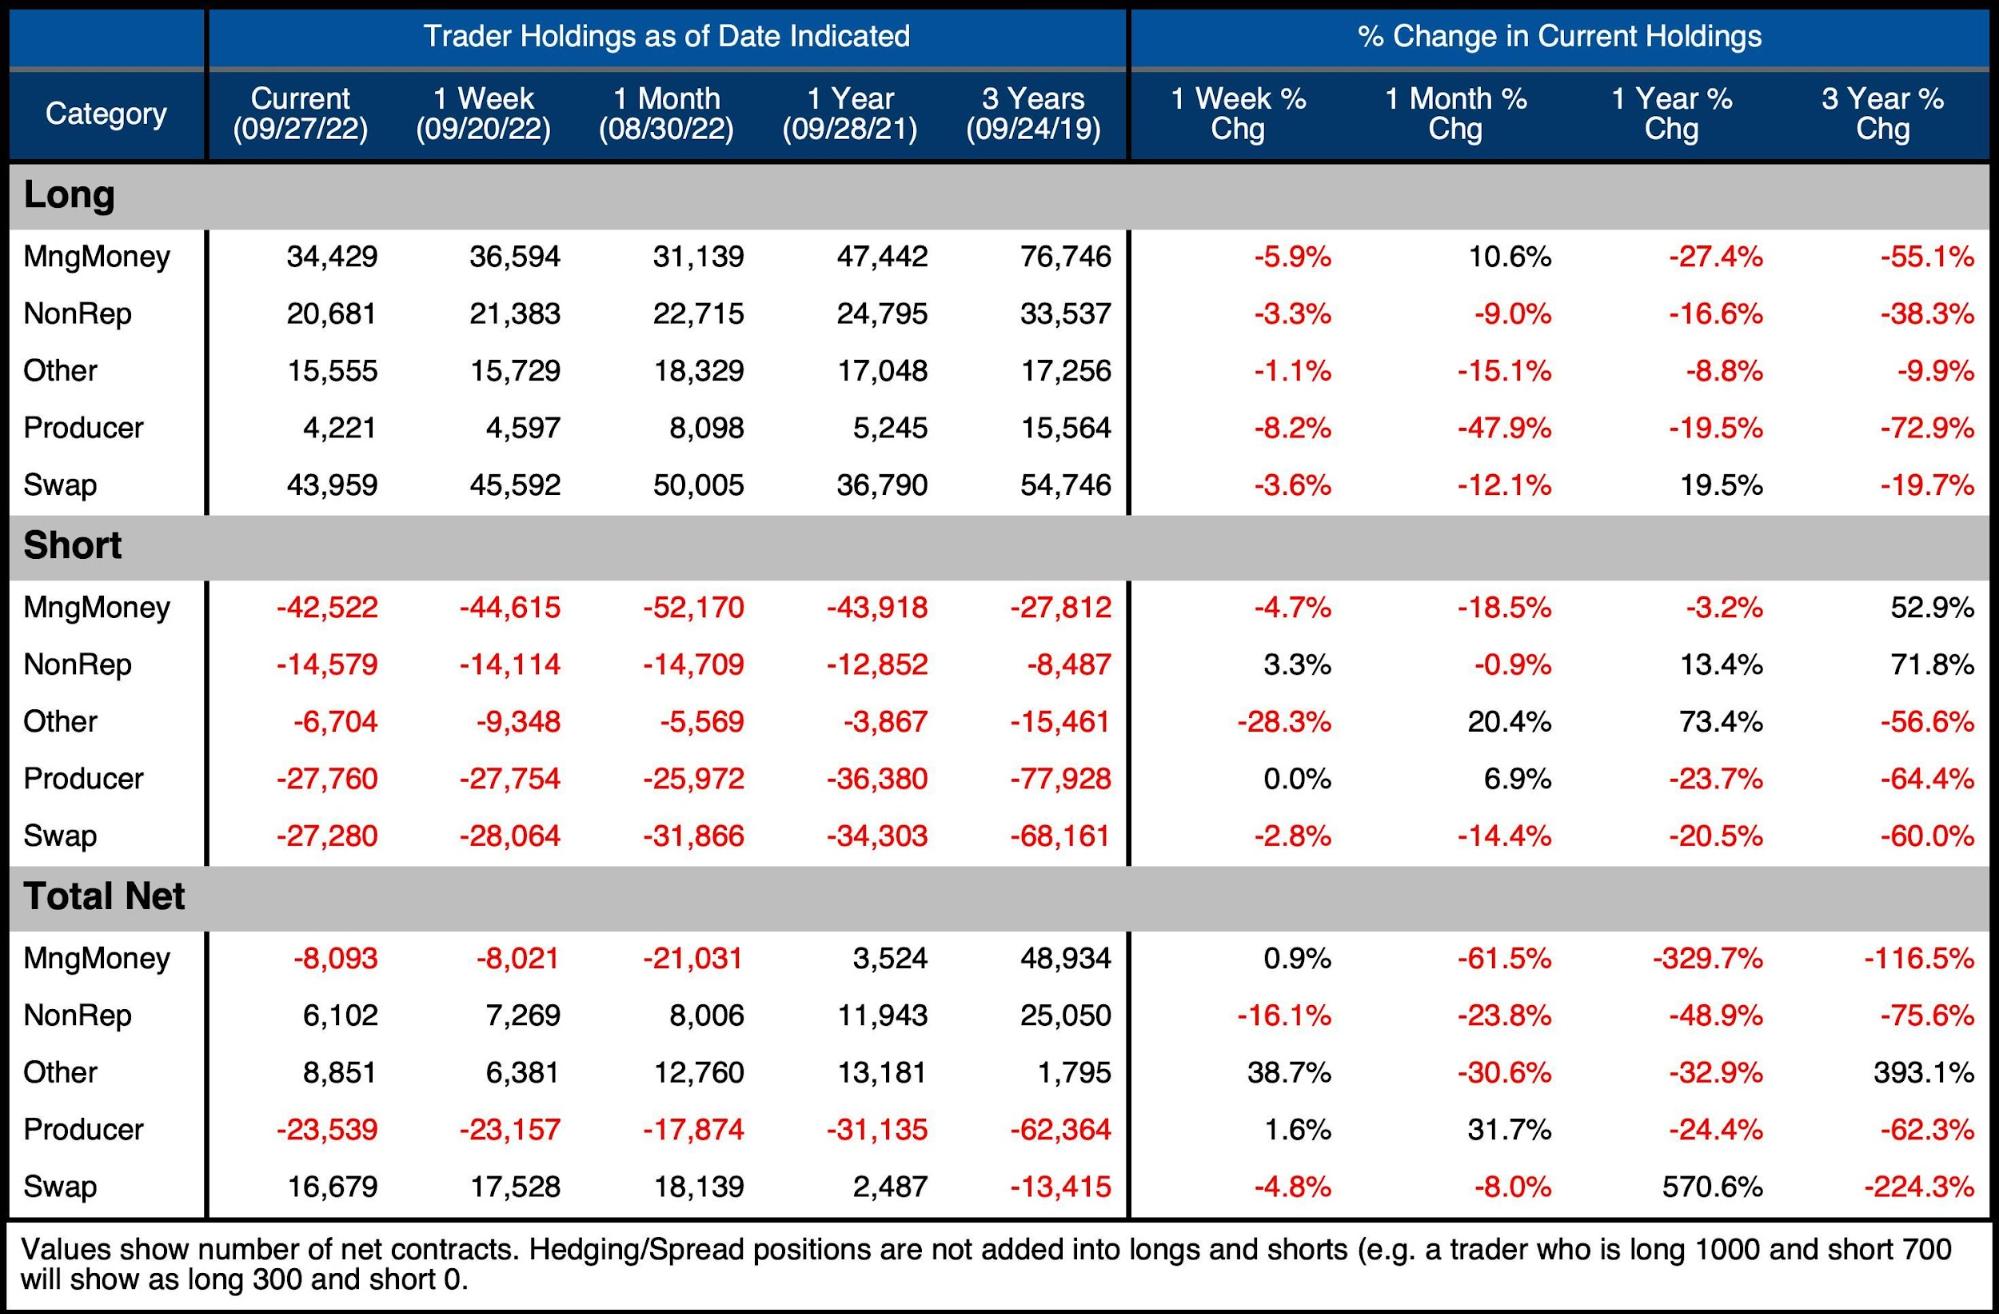
Figure: 12 Silver Summary Table
Net positioning as a percent of total open interest has rebounded off the lows but still sits near multi-year lows at 24.5%.
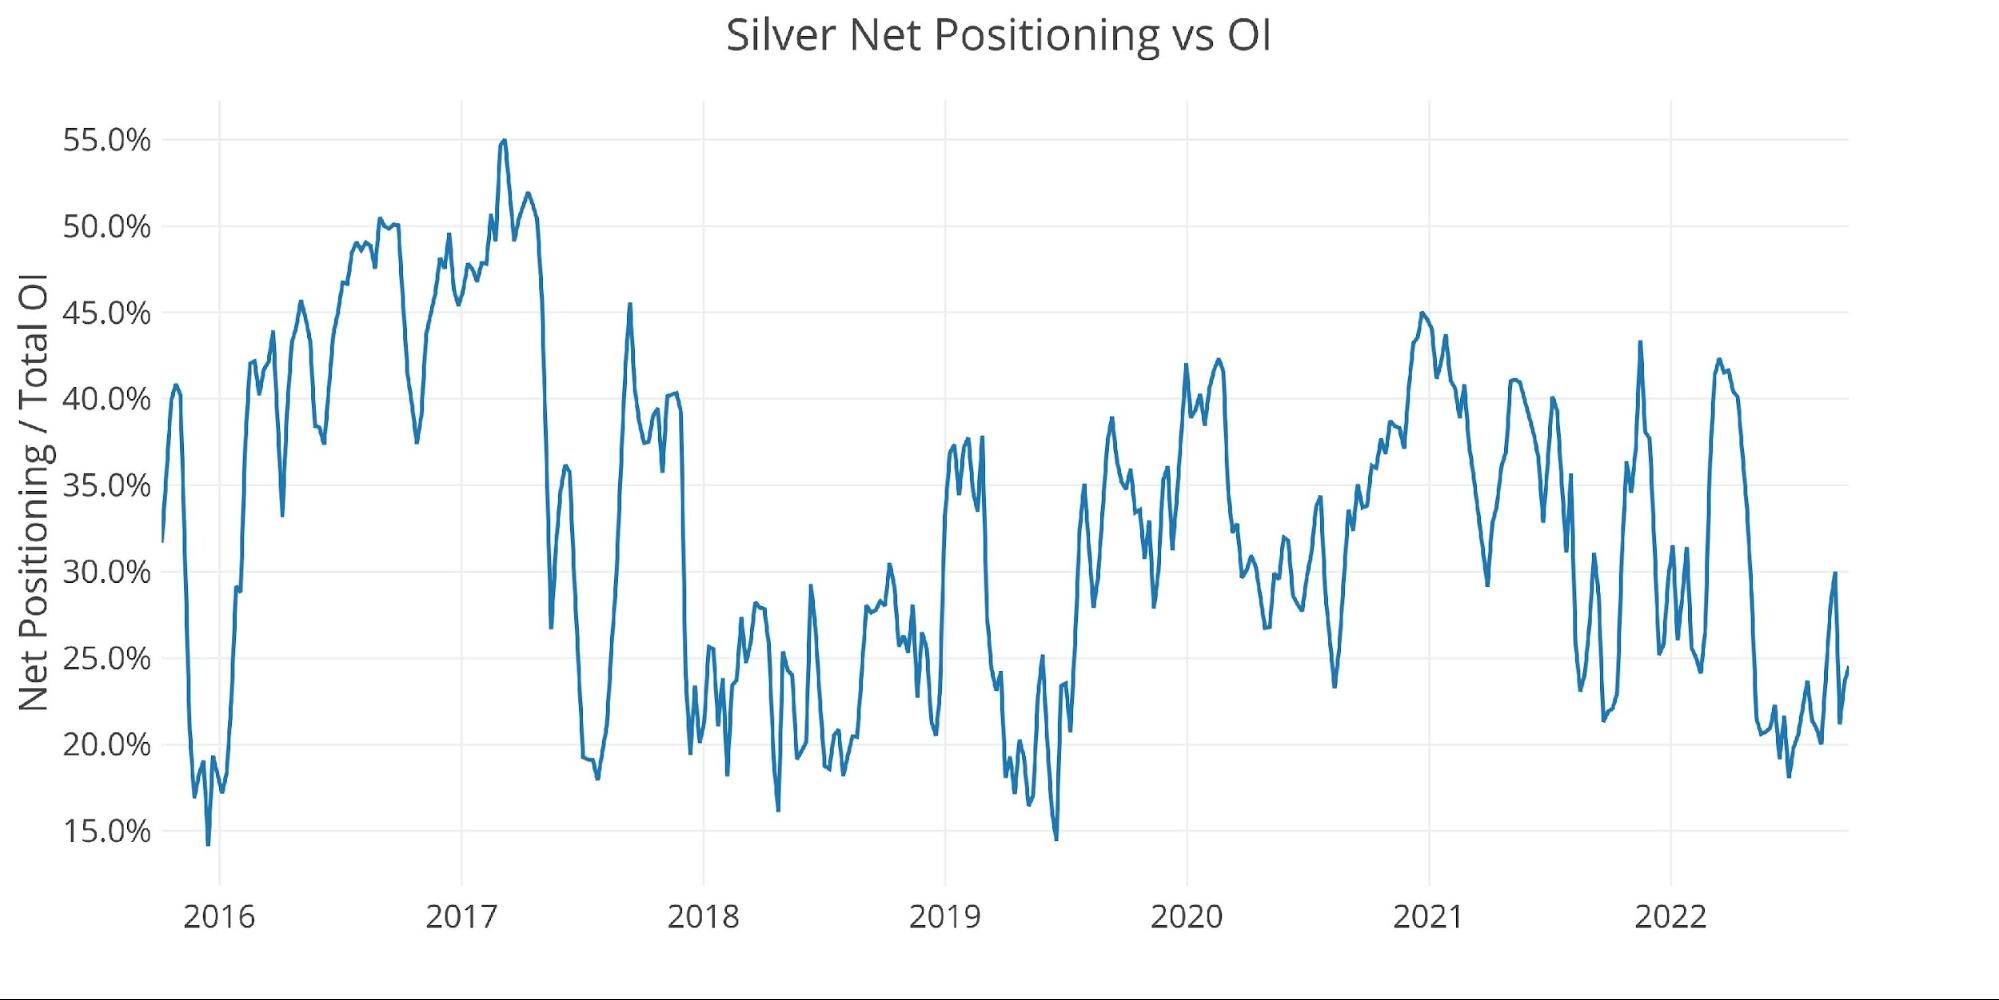
Figure: 13 Net Positioning
Historical Perspective
Looking over the full history of the CoTs data by month produces the chart below. Unlike gold, the “Other” category has remained surprisingly stable and small over this time.
Ignoring the Covid sell-off, Gross Longs are now at their lowest level since Nov 2018. This shows a general waning interest. This can be seen visually as the bars are converging similarly to gold.
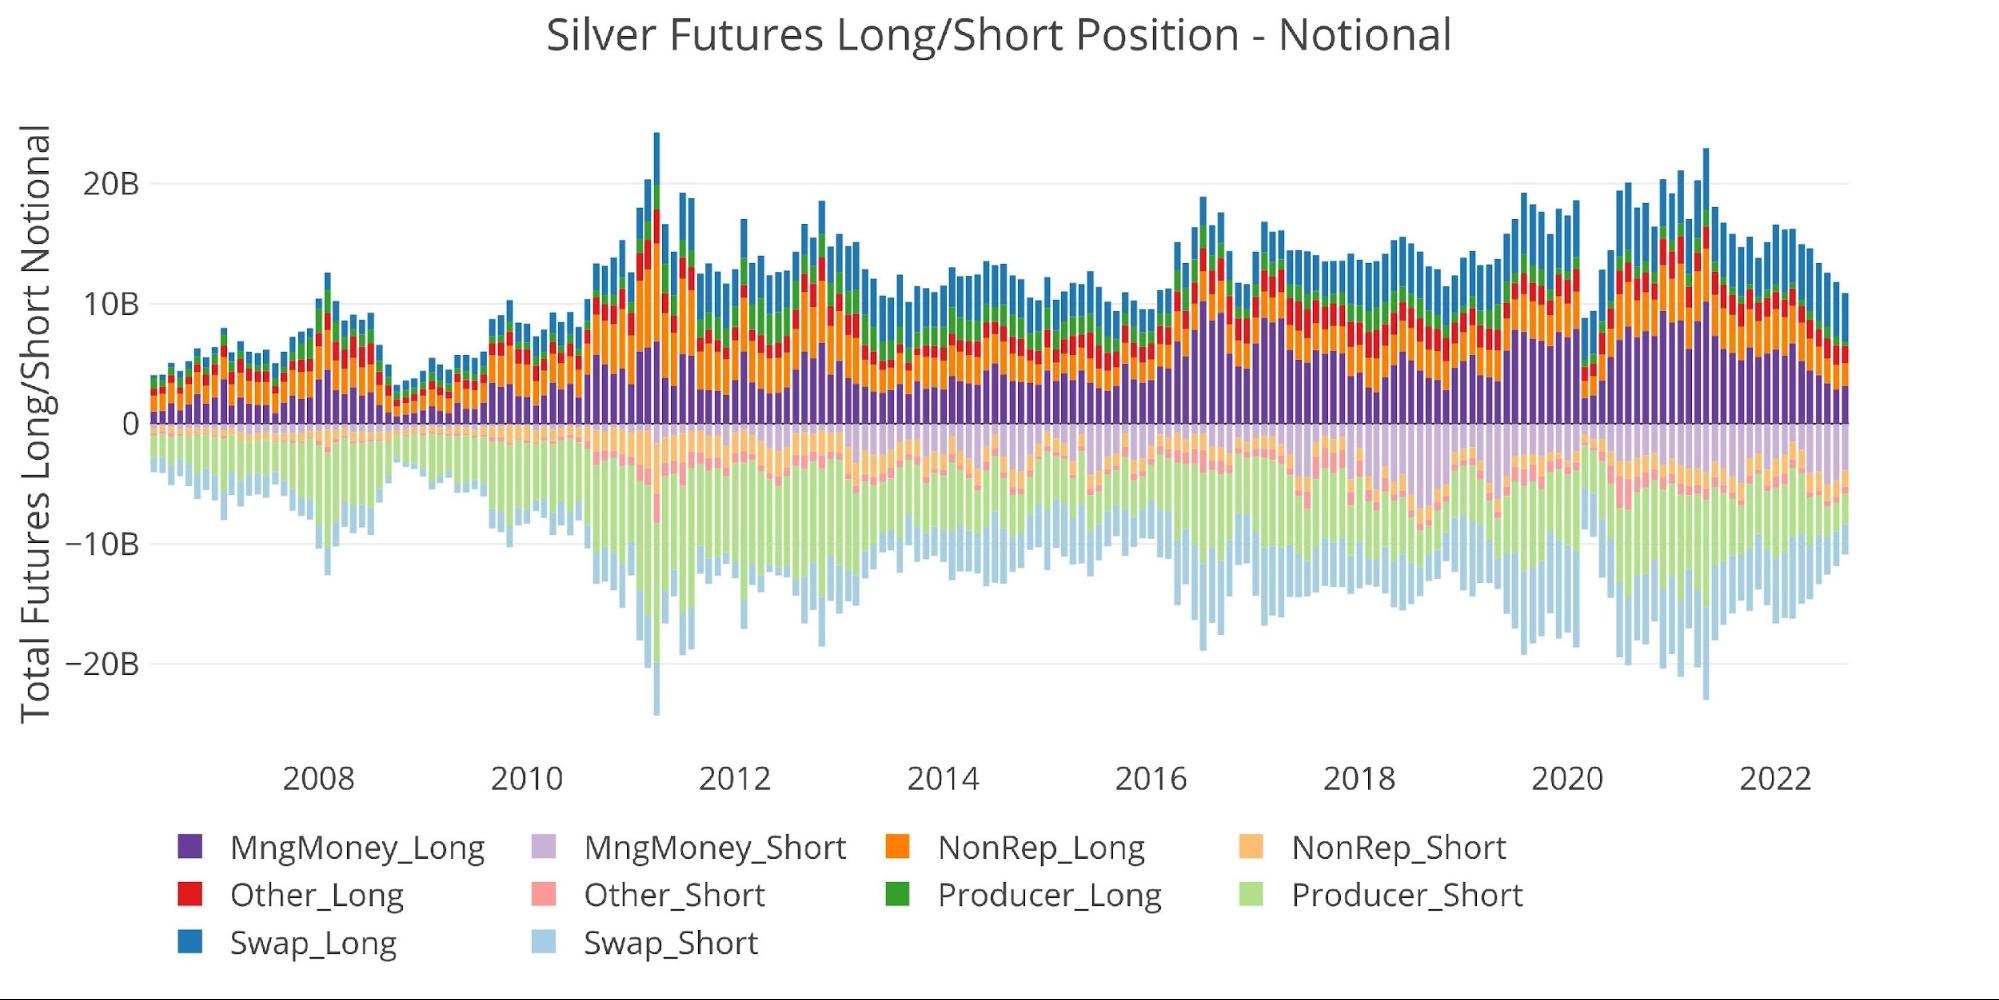
Figure: 14 Gross Open Interest
Looking at historical net positioning shows that Managed Money has never held a Net Short position for longer than 5 consecutive months, which it did back in 2018. September 2022 just completed month three of Net Short. Any rebound is going to push the price upwards quickly.
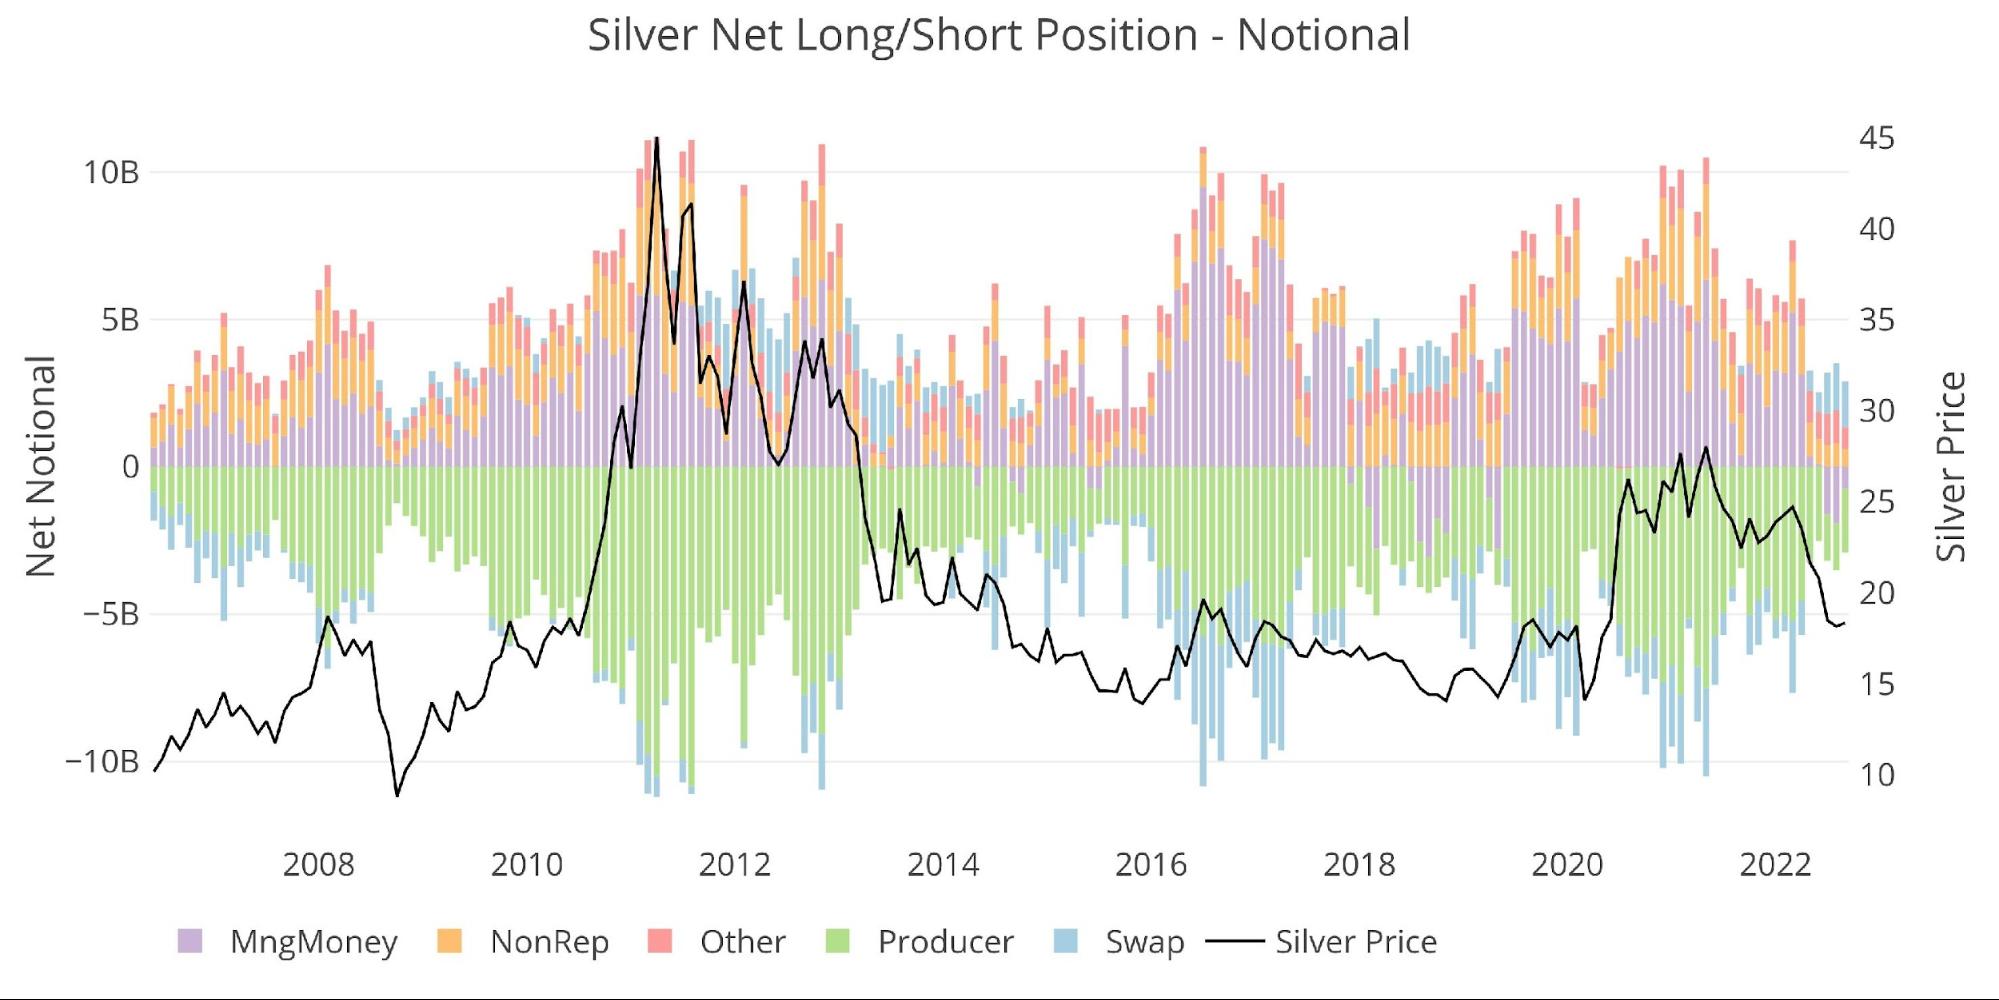
Figure: 15 Net Notional Position
The Options market is significantly smaller than gold and has continued to get smaller. Gross positioning is below $300M after getting close to $1.4B in 2020. it has rebounded in the latest month, driven by Producers and Swap.
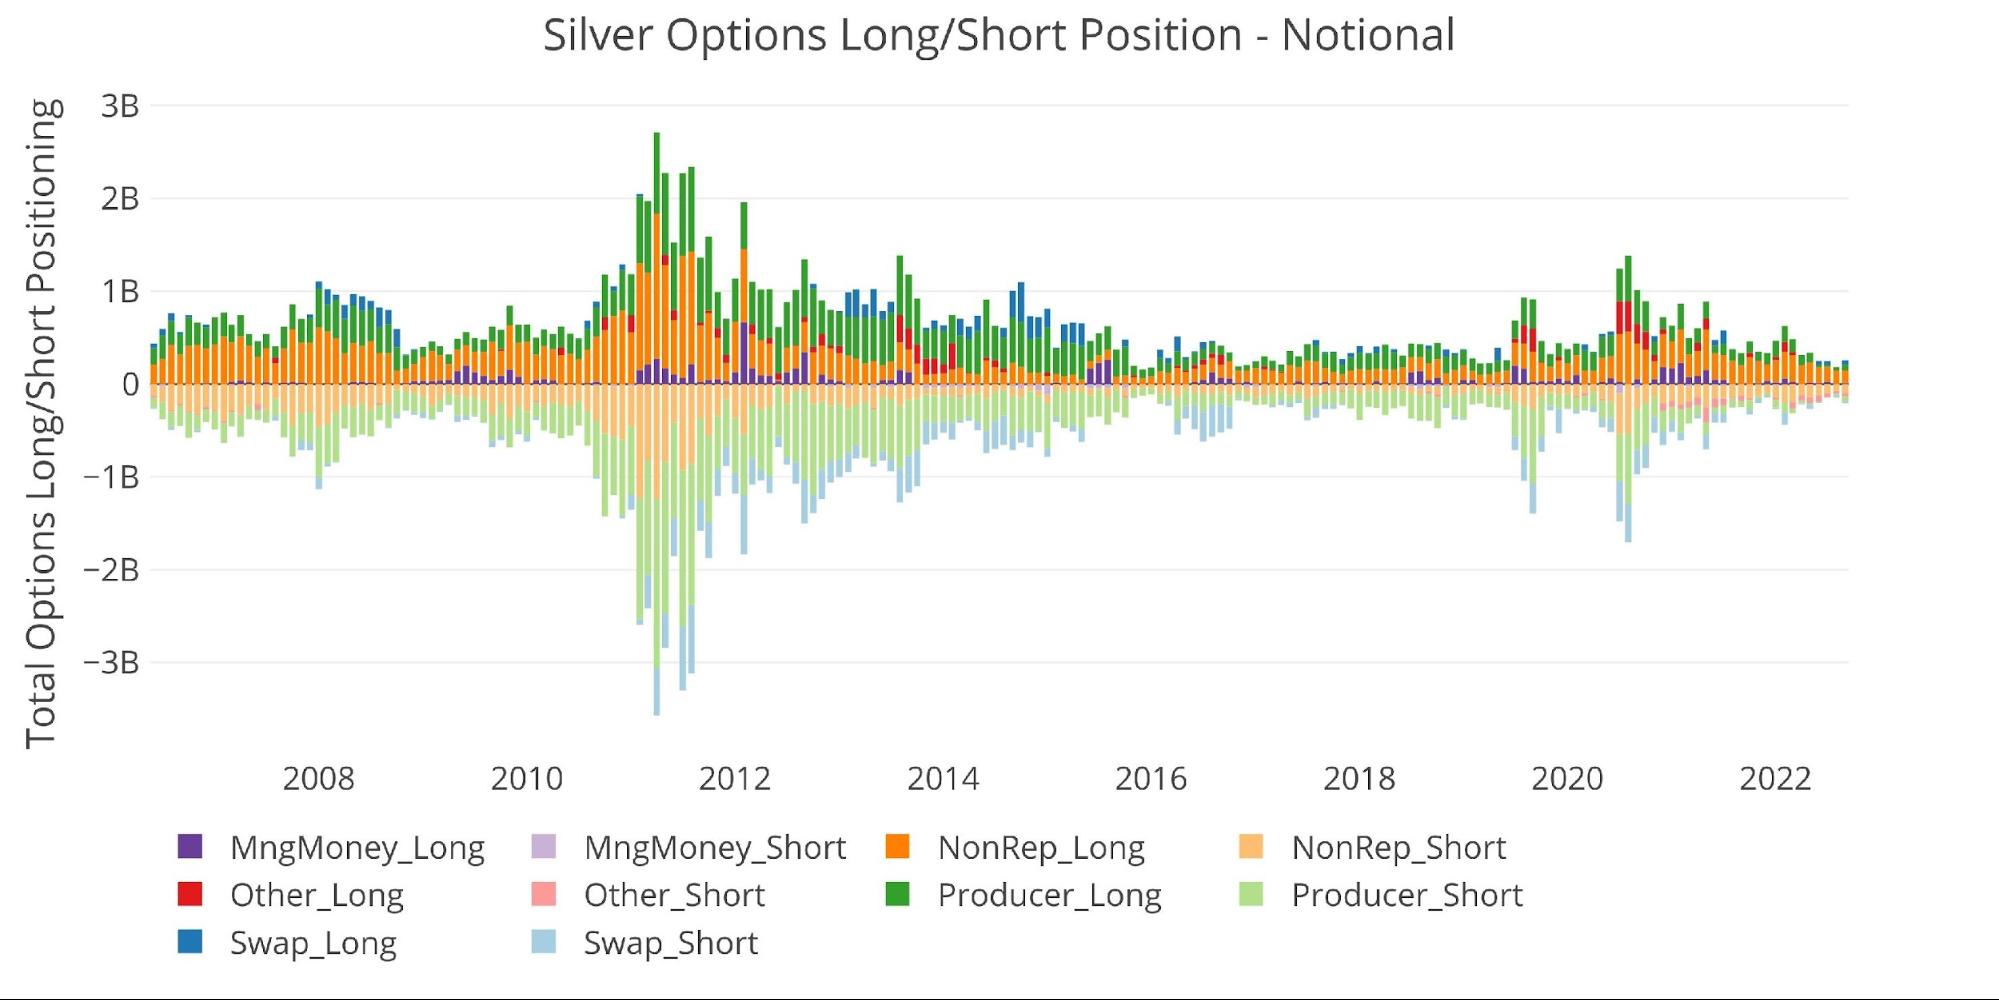
Figure: 16 Options Positions
Conclusion
Managed Money continues to dominate control over the market. Looking at the correlation table below shows gold at .94 and silver at an incredible .97. In gold, this is the highest correlation since 2019 and in silver, it is the highest in at least 6 years. The dominance in the market is striking!
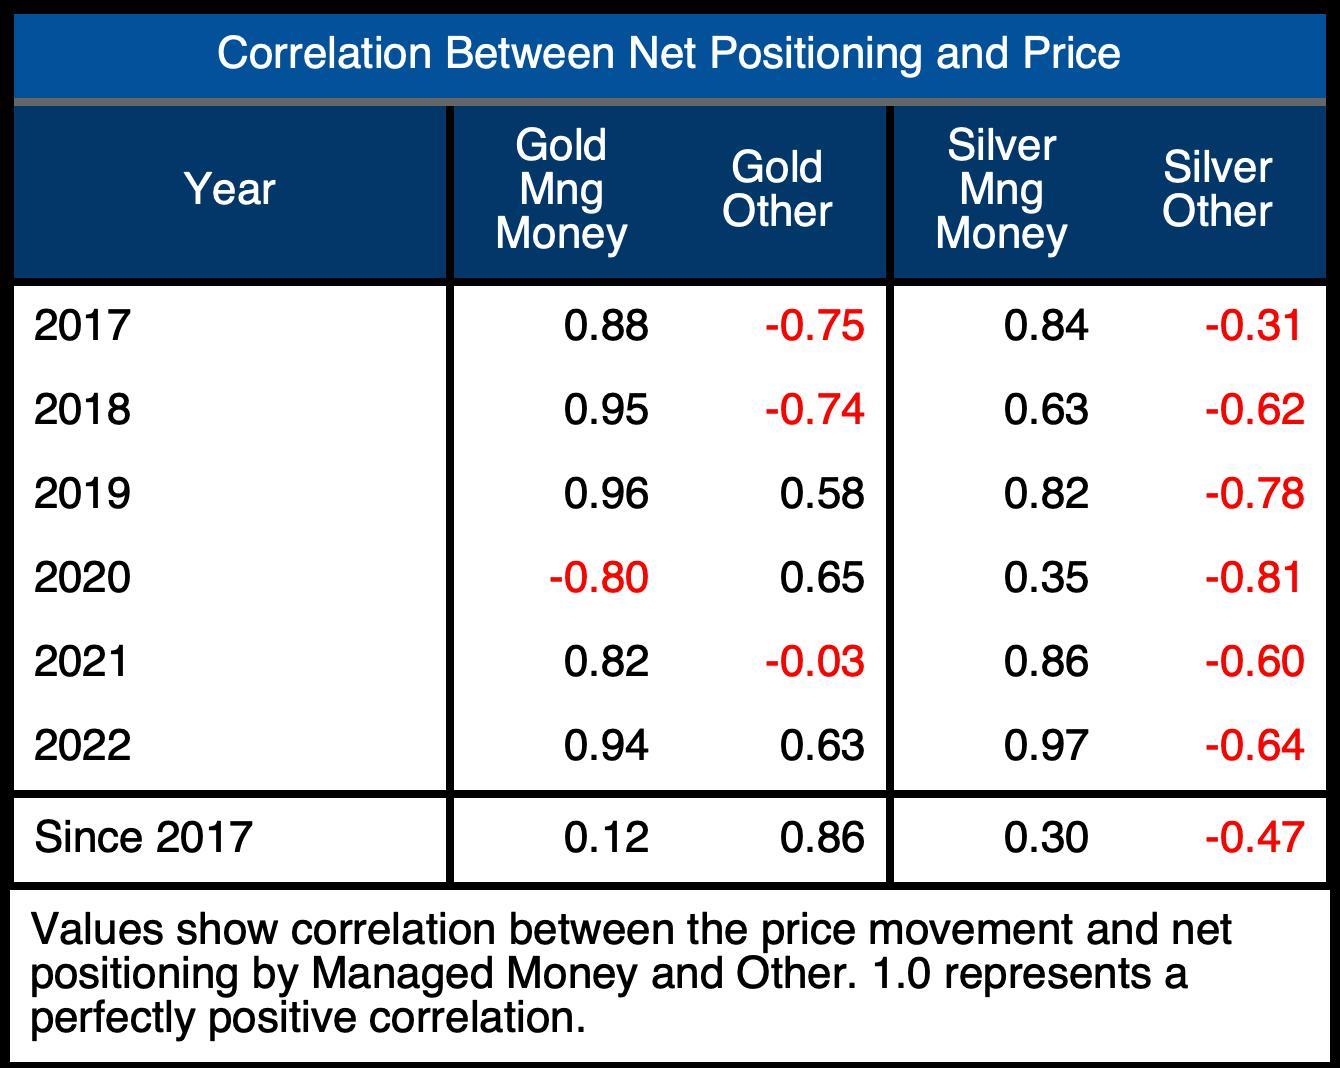
Figure: 17 Correlation Table
Two months ago, the Shorts looked a little too confident in their relentless selling. This resulted in a market that bounced. Then the hawkish Fed caused a quick snapback and the market hit new lows for the move on further selling from Managed Money.
Once again, the short side is looking overstretched. When sentiment gets this negative, it usually is a good setup for a short-squeeze. The entire market is long the dollar and short risk assets, including precious metals. Such a lopsided trade can have very powerful reversals once there is no one else to get on board the train. The CFTC CoTs data shows we are getting very near to that point.
The market is priced for a hawkish Fed that will get rates to 5% by next year. The market will soon learn this is impossible for the Fed. The reversal seen in 2018 could be minor compared to what might happen in the months ahead when the Fed does pivot.
Data Source: https://www.cftc.gov/MarketReports/CommitmentsofTraders/index.htm
Data Updated: Every Friday at 3:30 PM as of Tuesday
Last Updated: Sep 27, 2022
Gold and Silver interactive charts and graphs can be found on the Exploring Finance dashboard: https://exploringfinance.shinyapps.io/goldsilver/

Call 1-888-GOLD-160 and speak with a Precious Metals Specialist today!
Buka akaun dagangan patuh syariah anda di Weltrade.
Source link