
It is easy to get caught up in data releases. The media is keen to read a lot into them, hoping it will offer some sense of what is really going on, so often the news is about numbers just announced or expectations for what one economic measure will show from one month to the next.
However, as we outline below, many of the numbers that are released on a frequent and regular basis (CPI and employment, for example) can be misleading. Whether it’s down to the inputs or how the figures are presented to us, they rarely give enough insight into the breadth and depth of what is really going on. They are snapshots in a small time frame, with very selective inputs.
This is why we like gold. Gold is a constant. It is tangible, finite and exists without the say so of central banks and government policies.
So when you next hear the new CPI number of payroll data, rather than take it as a given that they are telling you what the economy looks like right now, why not look at gold and the gold price across a number of currencies and see what that tells you about the state of play now and in the long-term. Because, ultimately that’s what matters.
Equity markets plunged on Tuesday. The systematic correlation of equity markets meant that not only did U.S. equity markets decline sharply but it also meant many international equity markets were also sharply lower.
The main U.S. indices all plunged: the DOW (-3.9%), S&P500 (-4.3%), and NASDAQ (-5.2%). International indices, although not as steep of a decline, were also down, the FTSE (-2.3%), and DAX (-2.7%) for example.
The catalyst for the decline was the U.S. CPI report for August showed that inflation continues to be a major issue for the U.S. economy. This changed the probability of a larger Fed funds interest rate increase at the Fed’s meeting next week, and it also increases the probability of ‘larger’ increases at future meetings.
CPI is one of the main indicators for inflation in the U.S
Before the CPI data release on Tuesday the market was somewhat split between whether the Fed would increase interest rates by a further 50 basis points or by 75 basis points, after the CPI data the conversation has changed to whether the Fed will increase by 75 basis points or 100 basis points.
Furthermore, the stopping point of the current tightening cycle seems higher than before – some are calling for the Fed funds rate to reach more than 4.5% before the Fed pauses.
Economic weakness is already showing in the US economy (negative GDP, for the first two quarters for example) and the fear is that the higher the Fed raises rates the deeper the resulting recession will be.
The recession has been the ending result of all but two of the Fed’s nine tightening cycles since 1971.
The systematic failure extends to the very data that markets are reacting to – and which the central banks are basing their rate increases on.
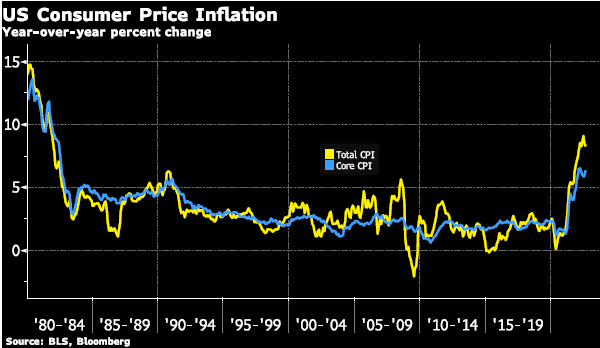
The Consumer Price Index is one of the main indicators for inflation in the U.S. This data is released each month by the U.S. Bureau of Labour Statistics and represents the increase in prices of a weighted basket of goods and services compared to a prior period, usually the previous month or previous year.
Two main components of CPI
There are two main components of CPI that are often touted by the press – Total CPI (also called Headline CPI) and Core CPI, which takes out the energy and food components.
The data released for August showed that Total CPI increased by 8.3% from August 2021 (which was a slightly smaller increase than the 8.5% in July). However, Core CPI increased by 6.3% compared to August 2021 (which was a larger increase than the 5.9% in July).
The idea behind Core CPI is that by taking out the energy and food components, which are generally more volatile (they can increase or decrease quickly depending on economic and political conditions), that the underlying components better determine the longer-term trend of the price pressures in the economy. This means that Core CPI is measuring the price differences of goods and services such as shelter, medical care, clothing, and vehicles (both new cars and used). The largest of these components is shelter which is approximately one-third of Core CPI, which is measured – not by the rise in housing costs or mortgage payments but by what the Bureau of Labour Statistics calls “owner’s equivalent rent of residence”. The problem with this measure is that it lags house price increases 12 to 18 months. This means that the 2020 and 2021 house price increases are just now getting picked up in CPI data.
The bottom line on CPI data is that not only is it a lagging indicator. This means that it is data from the past but that the actual components are very antiquated and don’t capture the true rising prices in the economy.
There is no doubt that inflation is an issue in today’s economies, and the official CPI data undoubtedly has under measured rising prices for many years now. However, our point here is that now the Federal Reserve and other central banks are basing their interest rate decisions on antiquated data sets and will most likely overshoot in their quest to bring inflation down, which will in turn cause a significant slowdown in the economy, which leads to high unemployment.
Don’t let low unemployment rates fool you, the unemployment rate does not generally start to rise until a recession is underway and unemployment does not peak until mid-recession.
All this is an example of the discussion in our recent podcast on What Problem Does Gold Solve?
Gold provides an avenue to protect our portfolio from financial systematic risk. The rapid rise in interest rates into an economy that is addicted and relies on cheap money is not going to end well. The systematic risks are only starting to rear their ugly heads and it is likely to get ugly before central banks are forced to retreat into lower rates again – probably by the middle of next year.
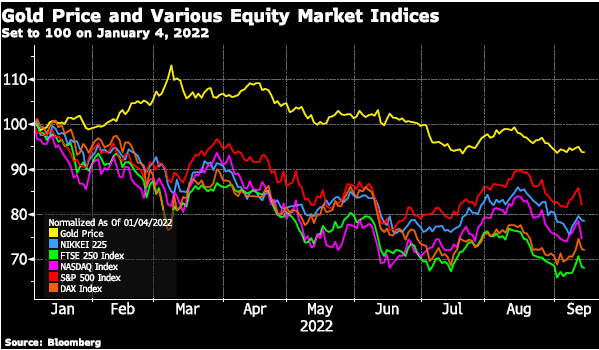
We end with two charts:
The first chart below shows the relative performance in 2022 year-to-date of gold and various equity market indices.
The second chart shows the gold price in various currencies. For those holding gold in currencies besides the U.S. dollars the returns have been even better this year-to-date.
If you’re new to gold and silver investment or perhaps looking for a refresher about holding gold in your portfolio, then have a listen to Stephen Flood’s interview on the Capital Club podcast. Stephen discusses the problem that gold solves as well as suggested allocations and what counterparty risk really is. Listen here.
You might have noticed that in the last few months we’ve sent some brilliant interviews and commentary your way, all from the GoldCore Team. If you’ve enjoyed it or would like to watch our latest interview with Jim Rogers then head to our YouTube channel and hit ‘subscribe’.
GOLD PRICES (USD, GBP & EUR – AM/ PM LBMA Fix)
13-09-2022 1727.05 1704.85 1474.38 1474.35 1699.94 1699.56
12-09-2022 1726.50 1726.40 1478.23 1477.28 1698.01 1705.51
09-09-2022 1726.95 1713.40 1485.87 1479.52 1711.58 1705.18
08-09-2022 1720.25 1709.35 1498.17 1488.33 1720.42 1716.19
07-09-2022 1705.05 1702.65 1486.63 1492.54 1722.10 1719.34
06-09-2022 1712.50 1702.60 1477.89 1480.41 1721.23 1724.73
05-09-2022 1711.95 1710.95 1488.54 1486.13 1727.02 1723.44
02-09-2022 1706.90 1712.50 1476.30 1484.05 1709.46 1711.82
01-09-2022 1706.00 1694.30 1471.08 1469.64 1701.74 1702.26
31-08-2022 1712.40 1715.90 1472.15 1478.08 1713.60 1715.21
Buy gold coins and bars and store them in the safest vaults in Switzerland, London or Singapore with GoldCore.
Learn why Switzerland remains a safe-haven jurisdiction for owning precious metals. Access Our Most Popular Guide, the Essential Guide to Storing Gold in Switzerland here
Receive Our Award Winning Market Updates In Your Inbox – Sign Up Here
Source link


