
Please note: the COTs report was published 7/29/2022 for the period ending 7/26/2022. “Managed Money” and “Hedge Funds” are used interchangeably.
Gold
Current Trends
As discussed last month, overall net positioning is the smallest it has been since May 2019. Then, on July 12th, Managed Money went short gold for the first time since April 2019.
As the chart below shows, both of these events in 2019 occurred just before gold went on a massive rally, rising from $1270 to $1550 in 3 months (all pre-Covid).
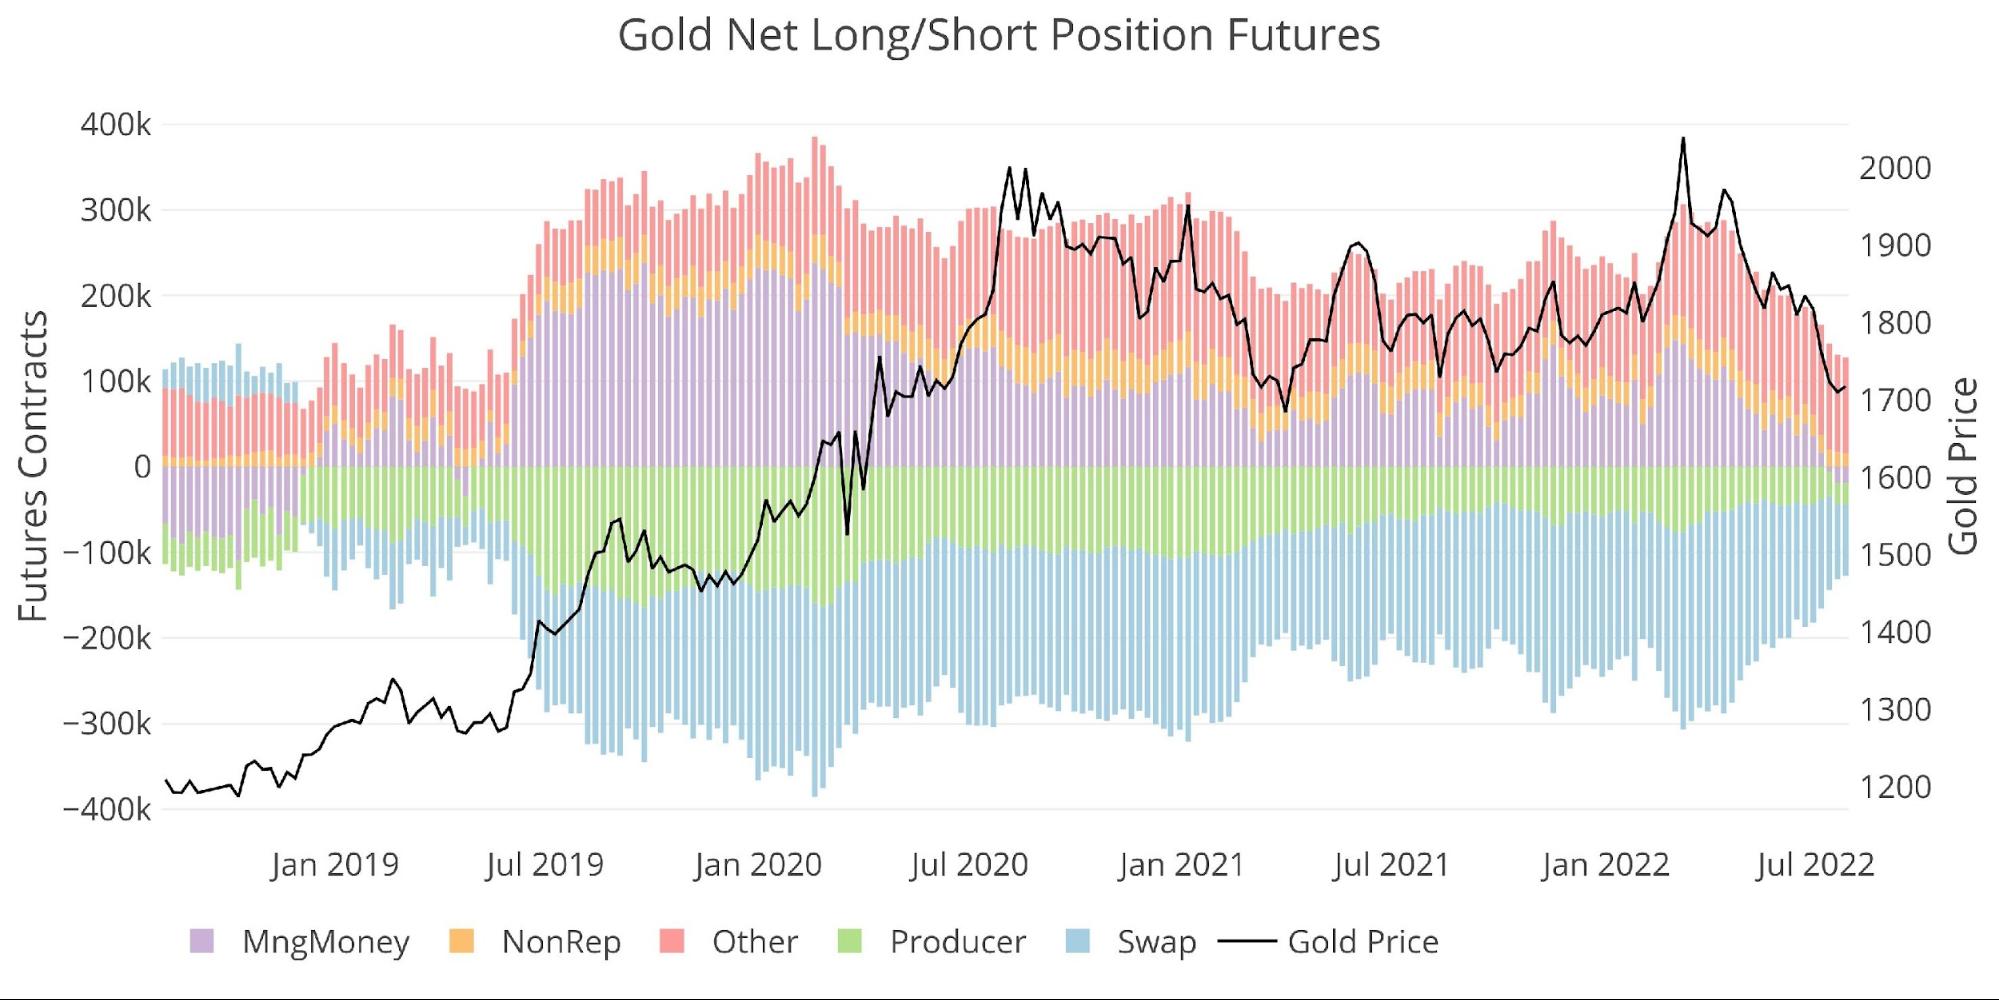
Figure: 1 Net Notional Position
The last time Managed Money was net short, gold was trading at $1270. Gold closed at $1717 as of Tuesday when traders submitted their positioning to the CFTC. Gold is 35% higher compared to the last time Managed Money was this pessimistic on gold.
How much lower can the shorts take gold? It seems they have run out of gas and been unable to break through solid support at $1680. Does this mean the downside is over? Does it mean the market is set up for a short squeeze?
Another hot inflation report could prompt even more short selling or ETF outflows that could take prices lower. However, the current positioning from Managed Money suggests there is far more risk to the upside than the downside.
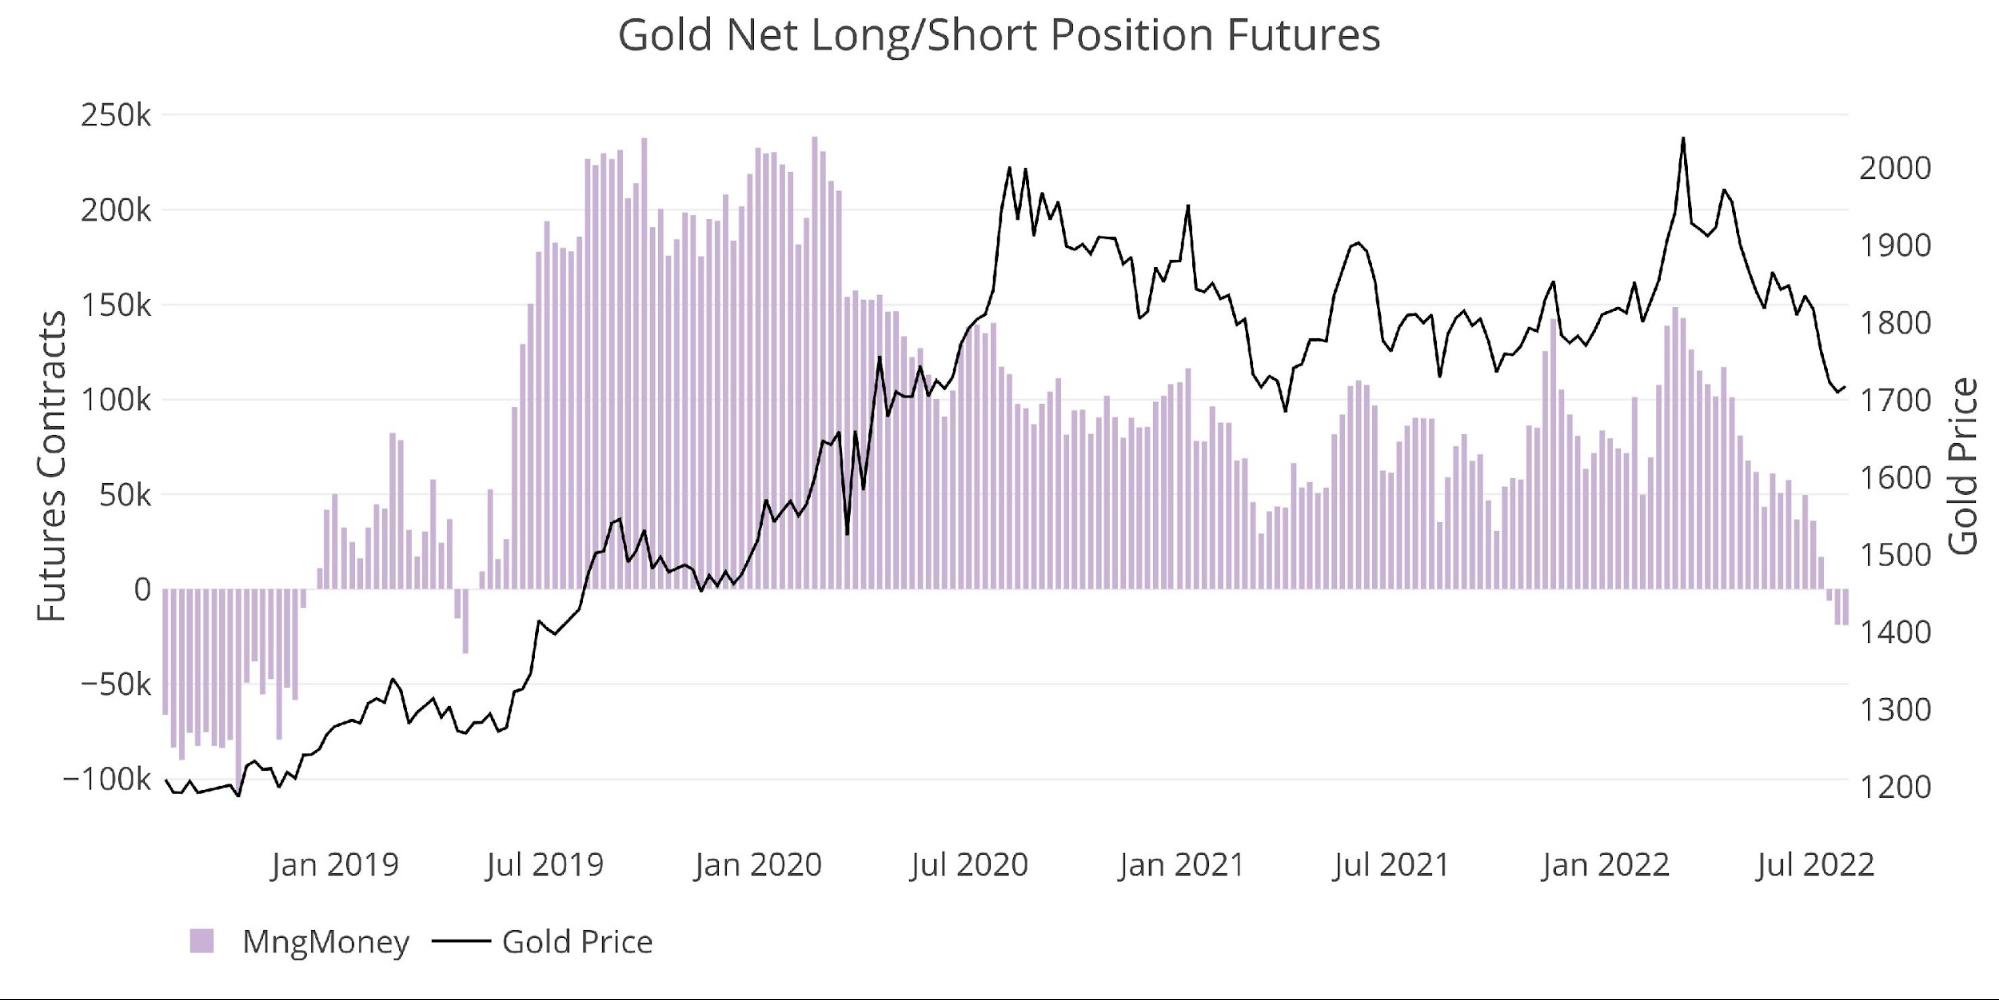
Figure: 2 Managed Money Net Notional Position
Weak Hands at Work
Heading into the FOMC this week, Managed Money was clearly betting on a hawkish Fed pushing gold lower. But this was clearly a “buy the rumor, sell the fact” event.
Gold spec shorts were caught off-guard and saw a pretty solid rally in gold after the FOMC and GDP print. As the chart below shows, Managed Money had been piling in leading up to this week but then made almost no changes over the final days.
As shown below, Managed Money tends to be very volatile. However, since March 8th, the shorts have taken one side of the bet and absolutely hammered the price lower. Over the 20 weeks, 16 have led to an increase in net short with only 4 seeing an increase of positioning to the long side.

Figure: 3 Silver 50/200 DMA
The table below has detailed positioning information. A few things to highlight:
-
- The net short position in Managed Money was driven by the long and short side
-
- Over the month, gross longs fell 16.8% or 18.6k. Gross shorts increased by almost 50% or 36.5k
- This led to a net change of 55k contracts or -152%
-
- Over the month, Other net longs fell by 10k or 8.1% while Non-Reportables fell 35% but only representing 9.5k
- Producer and Swap both saw meaningful declines in their net short position of 42.5% and 39.8% respectively
-
- This came mostly from a decrease in the short side for both groups. Gross longs only increased 5k against gross shorts falling 68k!
-
- The net short position in Managed Money was driven by the long and short side
Producers and Swap generally sit on the other side of Managed Money and Other, so it’s not surprising to see their short positions fall, but a drop of 68k over a month is a massive fall.

Figure: 4 Gold Summary Table
Despite the large moves, the net positioning continues to fall. Total net positioning represents the combined exposure of the groups once hedging positions are removed. It shows the size of net positions divided by total open interest. As can be seen below, this has dropped to the lowest level since May 2019.
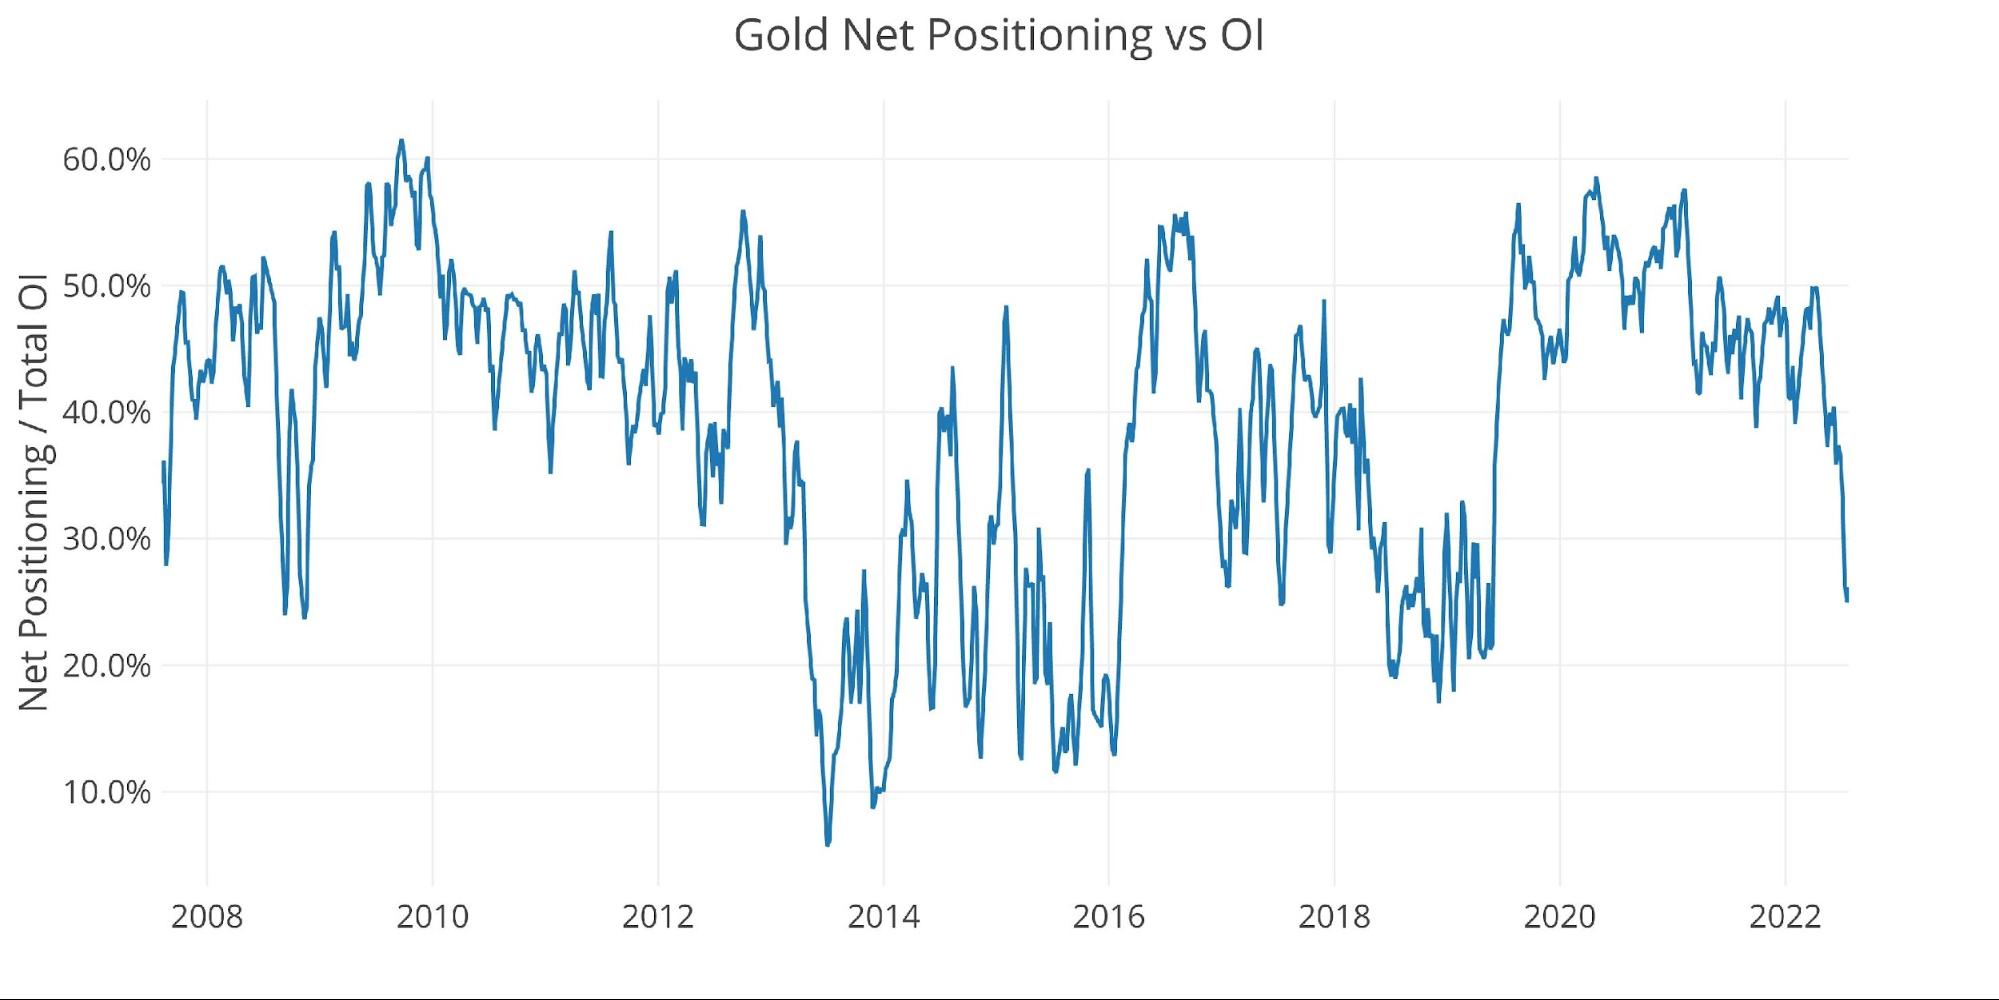
Figure: 5 Net Positioning
Historical Perspective
Looking over the full history of the COTs data by month produces the chart below (values are in dollar/notional amounts, not contracts). After coming close to $100B twice, the market has retreated to below $68B.
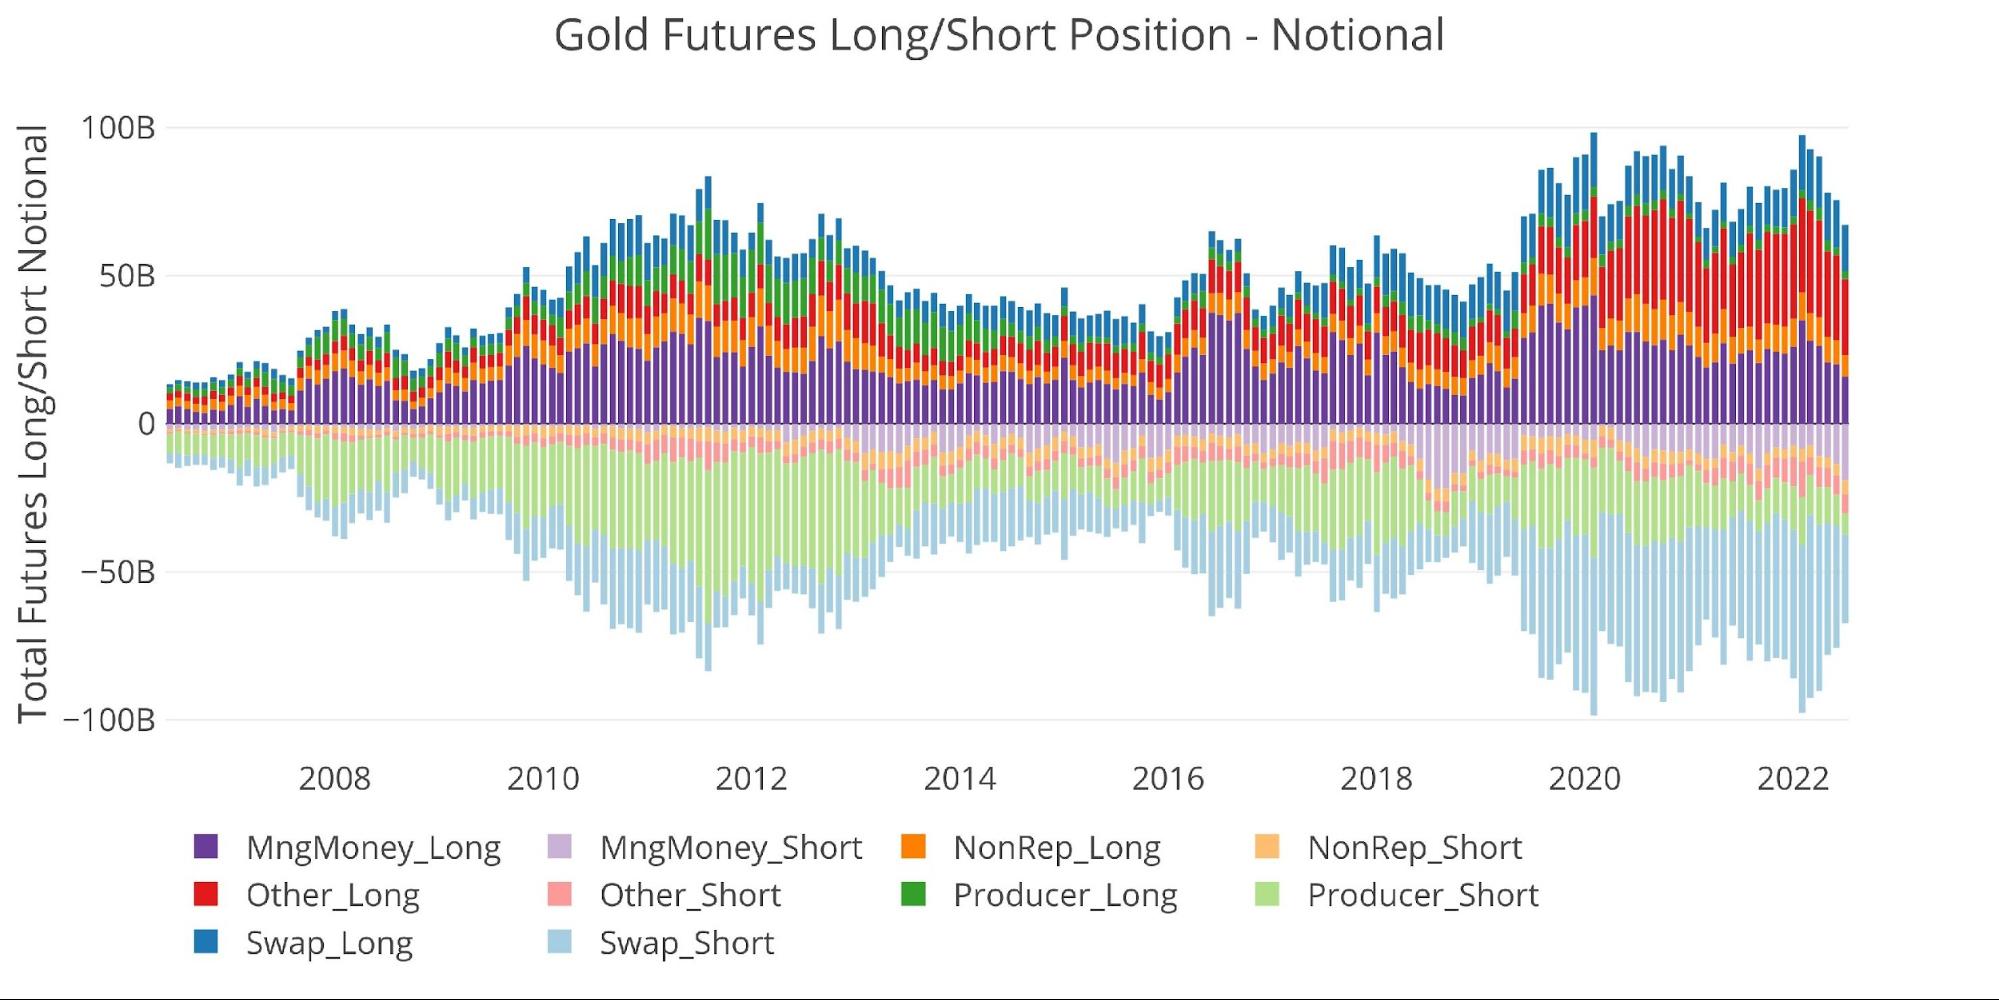
Figure: 6 Gross Open Interest
The chart below looks at net notional positioning against price on a longer time frame. As mentioned, while the correlation of Managed Money is strong, it is not perfect. The long-term bull market continues despite the volatile gyrations of Managed Money positioning. The recent collapse in net positioning can also be seen very clearly in this chart.
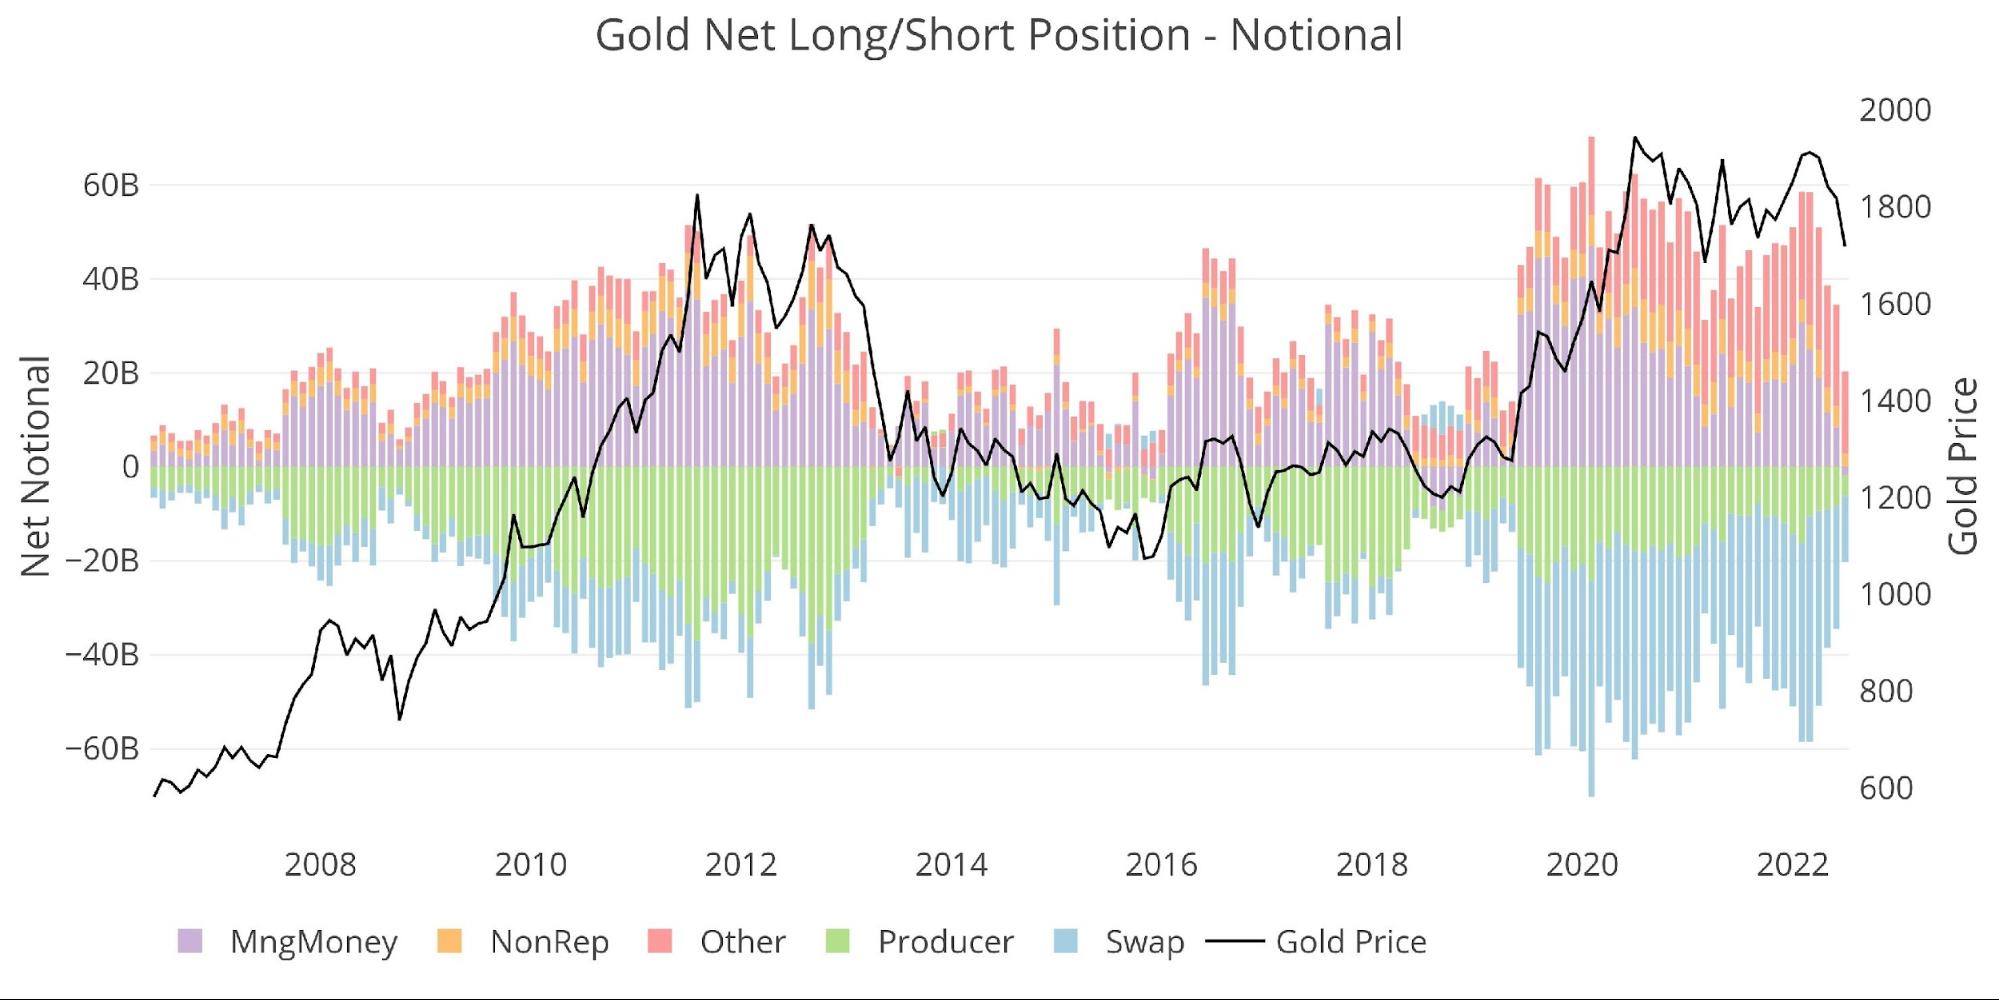
Figure: 7 Net Notional Position
Finally, the CFTC also provides Options data. The chart below further reveals the collapse in activity. After getting above a gross value of $26B, the market has fallen below $4.5B! The majority of this collapse has come from the Producer side, with gross longs falling to the lowest level since 2009 May. Managed Money has also reduced its long positions but now sits above Producer Long ($1.7B vs $1.45B).

Figure: 8 Options Positions
Silver
Current Trends
The moves in silver are even more extreme than the moves in gold. Managed Money has absolutely hammered silver lower while Swap has been on the other side, building a long position over the last three months.
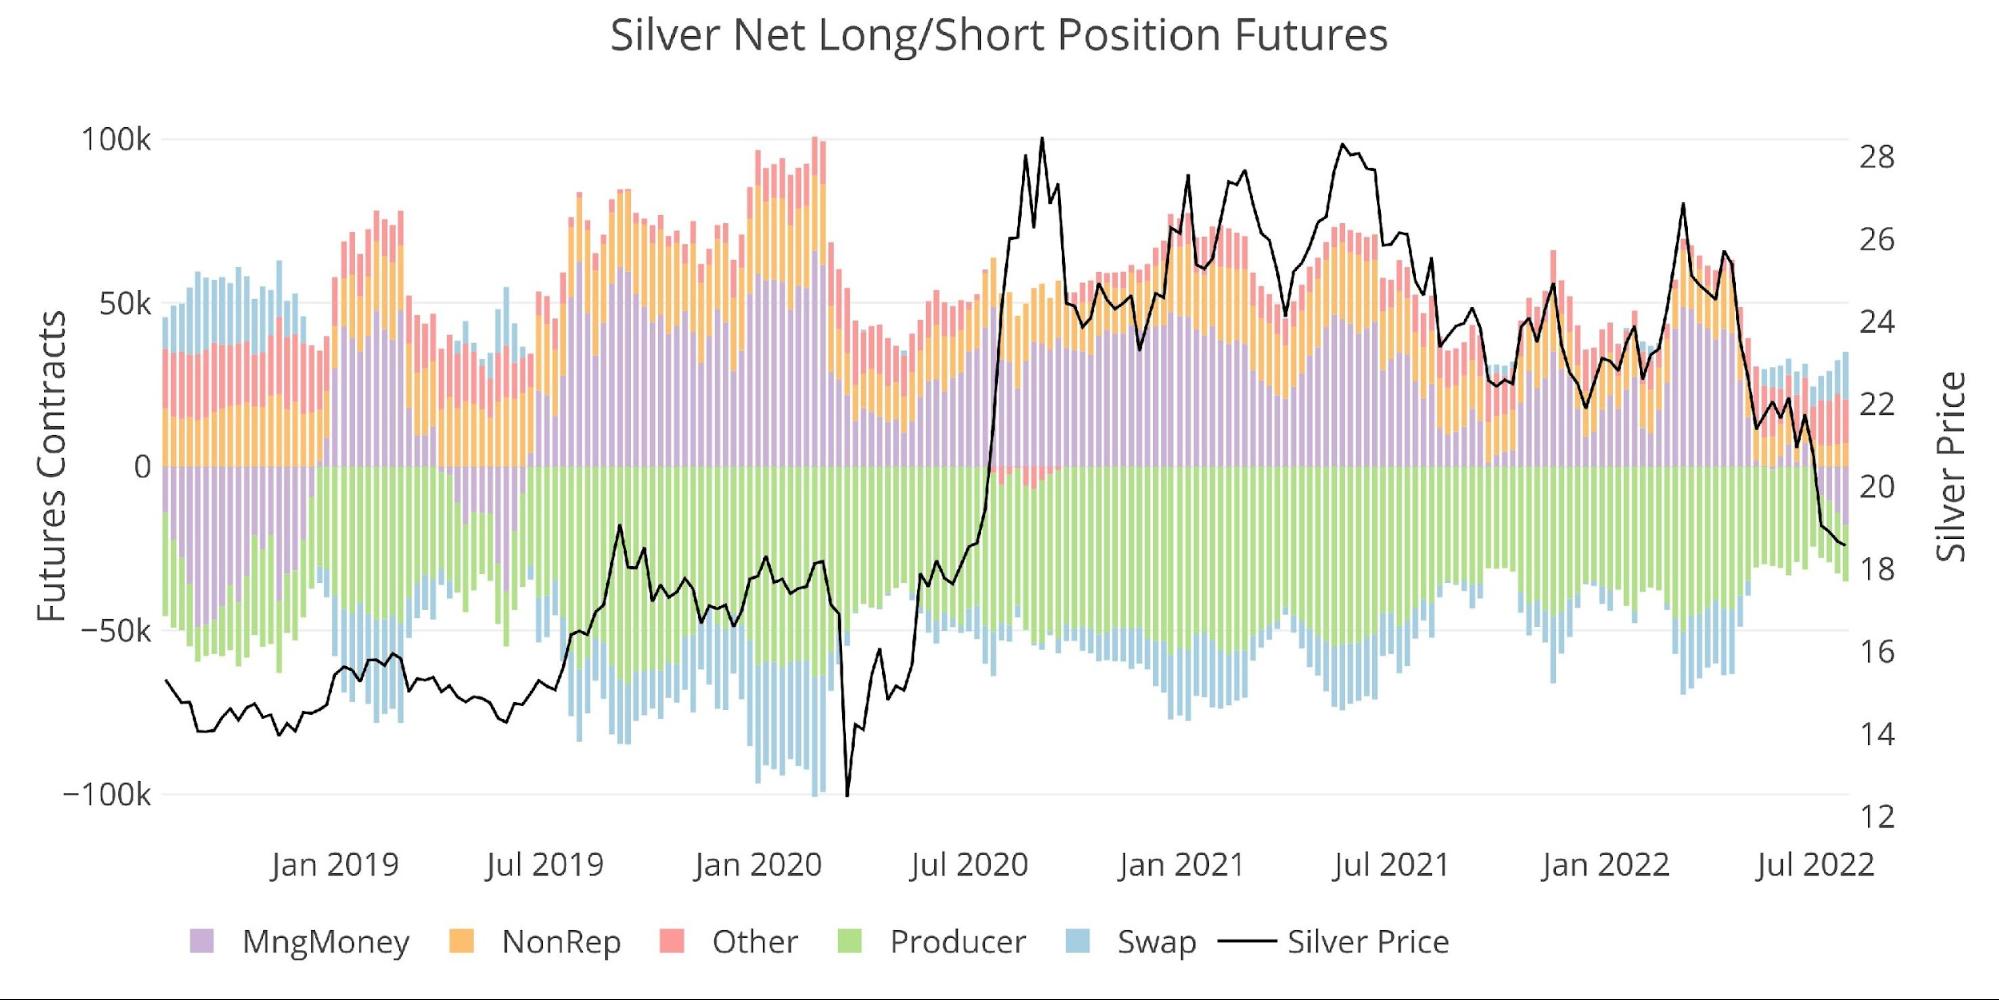
Figure: 9 Net Notional Position
While Managed Money was responsible for some of the big move up in 2020, they have been the main culprit hammering prices for the last four months.
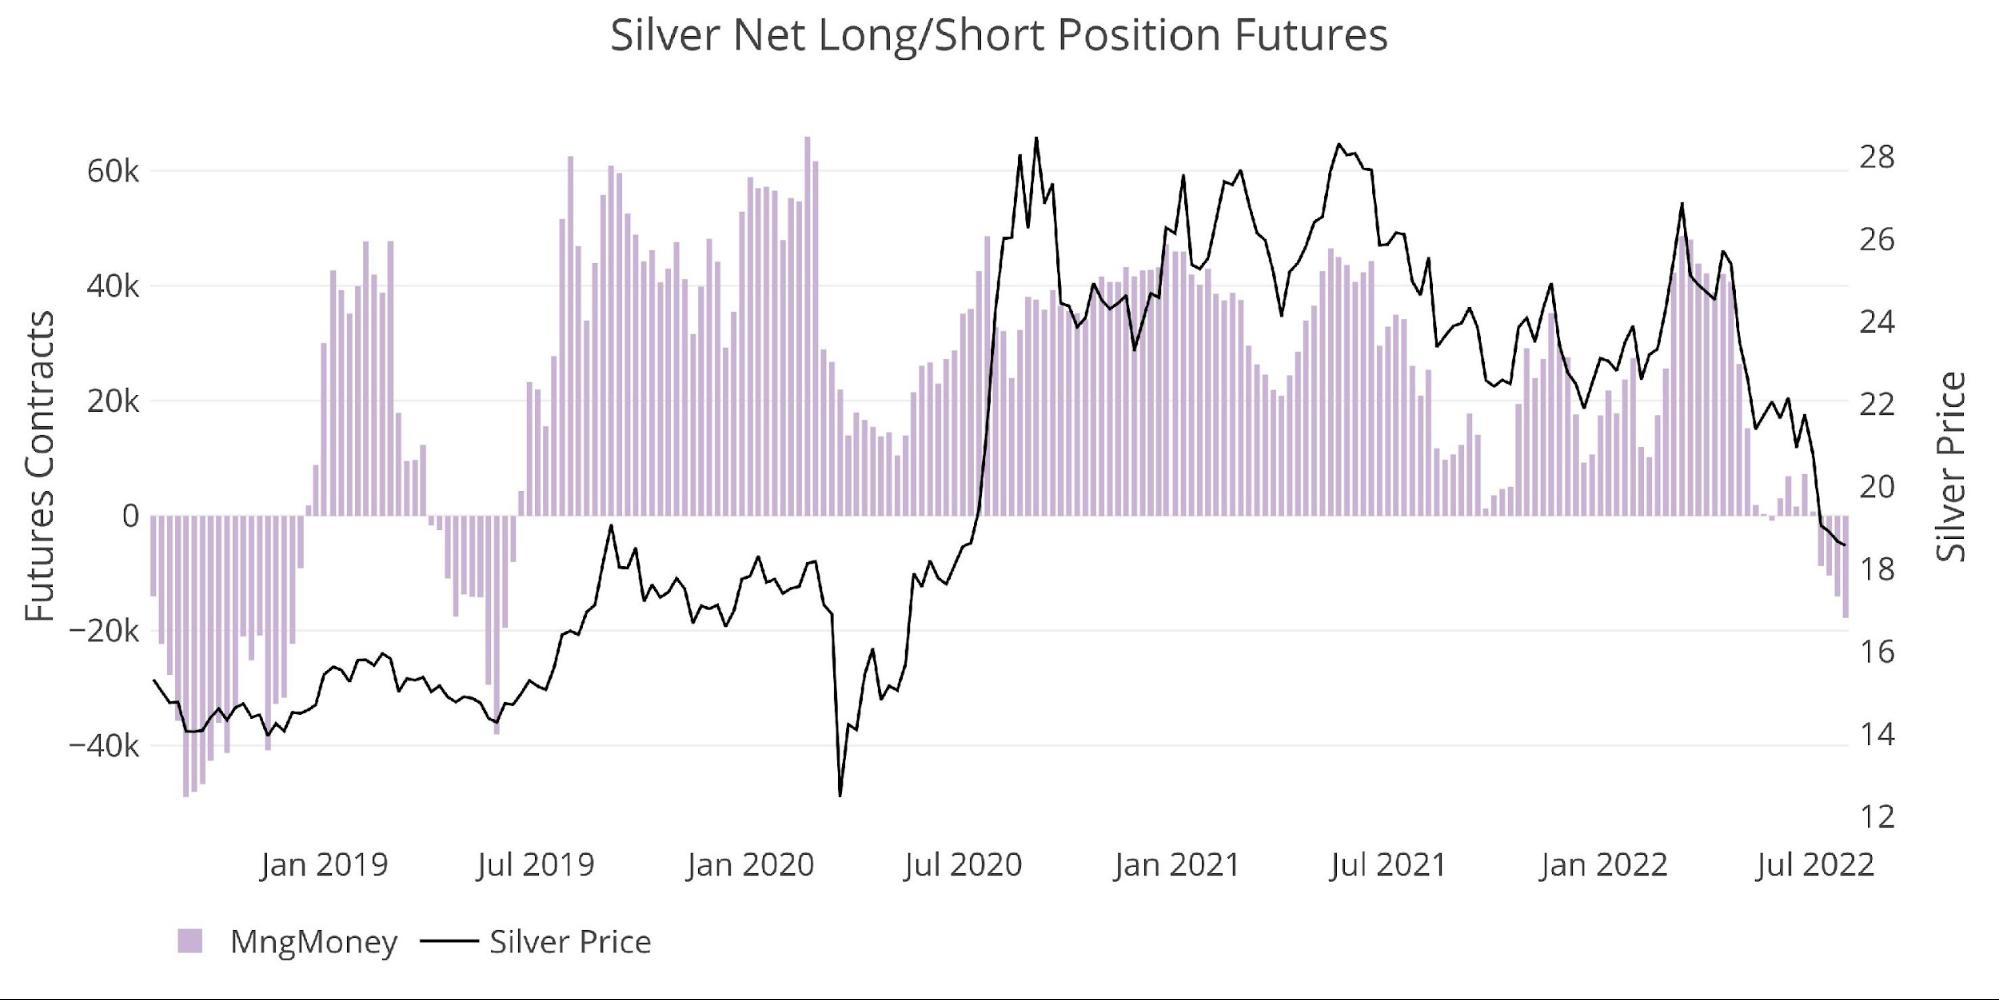
Figure: 10 Managed Money Net Notional Position
The chart below shows the same relentless selling in silver as gold. 16 of the last 20 weeks have seen a decline in Managed Money net positions.
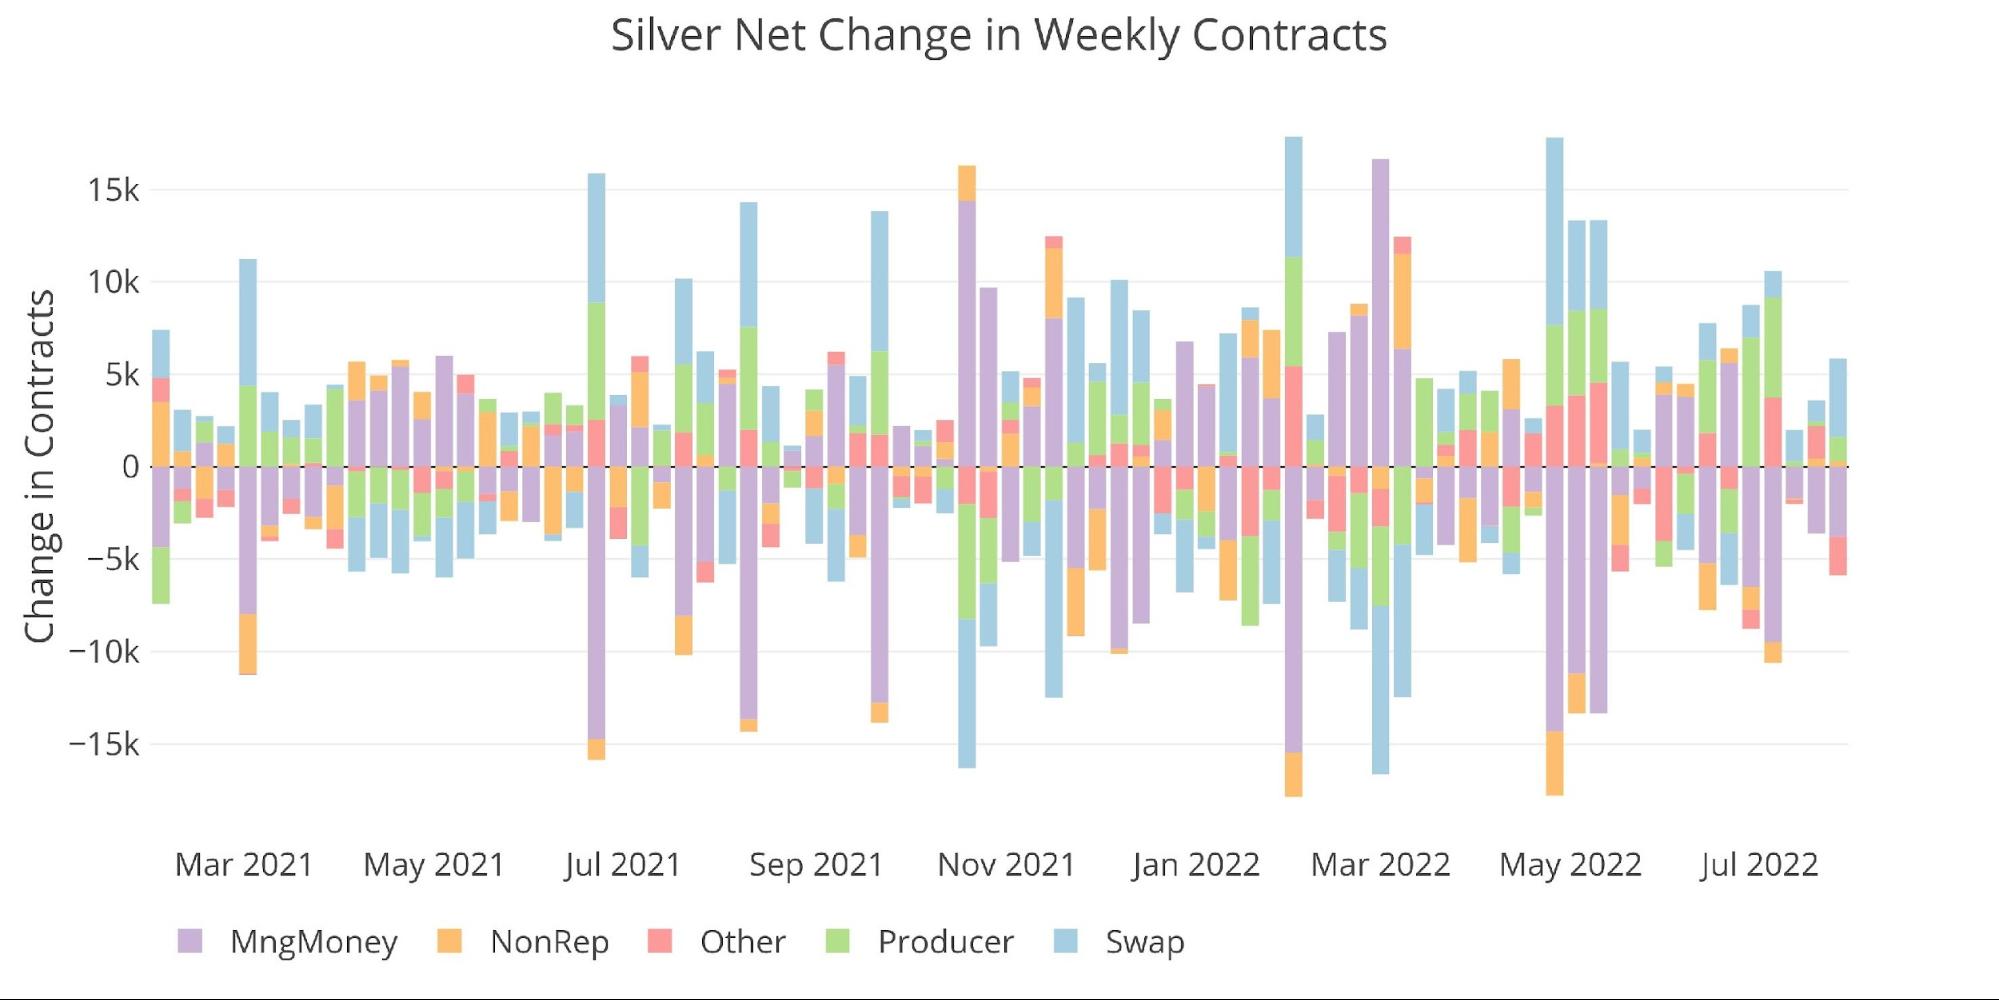
Figure: 11 Net Change in Positioning
The table below shows a series of snapshots in time. This data does NOT include options or hedging positions. Important data points to note:
-
-
- Managed Money activity has been driven by the short side again
-
- Gross longs have dropped 3k or 6% over the month
- Gross shorts are up 42% or 16k over the same time
- Over a year, gross longs are down 28% vs gross shorts increasing 82%. This has led to a change in net positioning of -185%!
-
- Swaps increased their net long position by 143% in the last month. This was driven more by closing short positions rather than opening long positions.
- Producers did the same as swap, decreasing their net short position by 30%
- Managed Money activity has been driven by the short side again
-
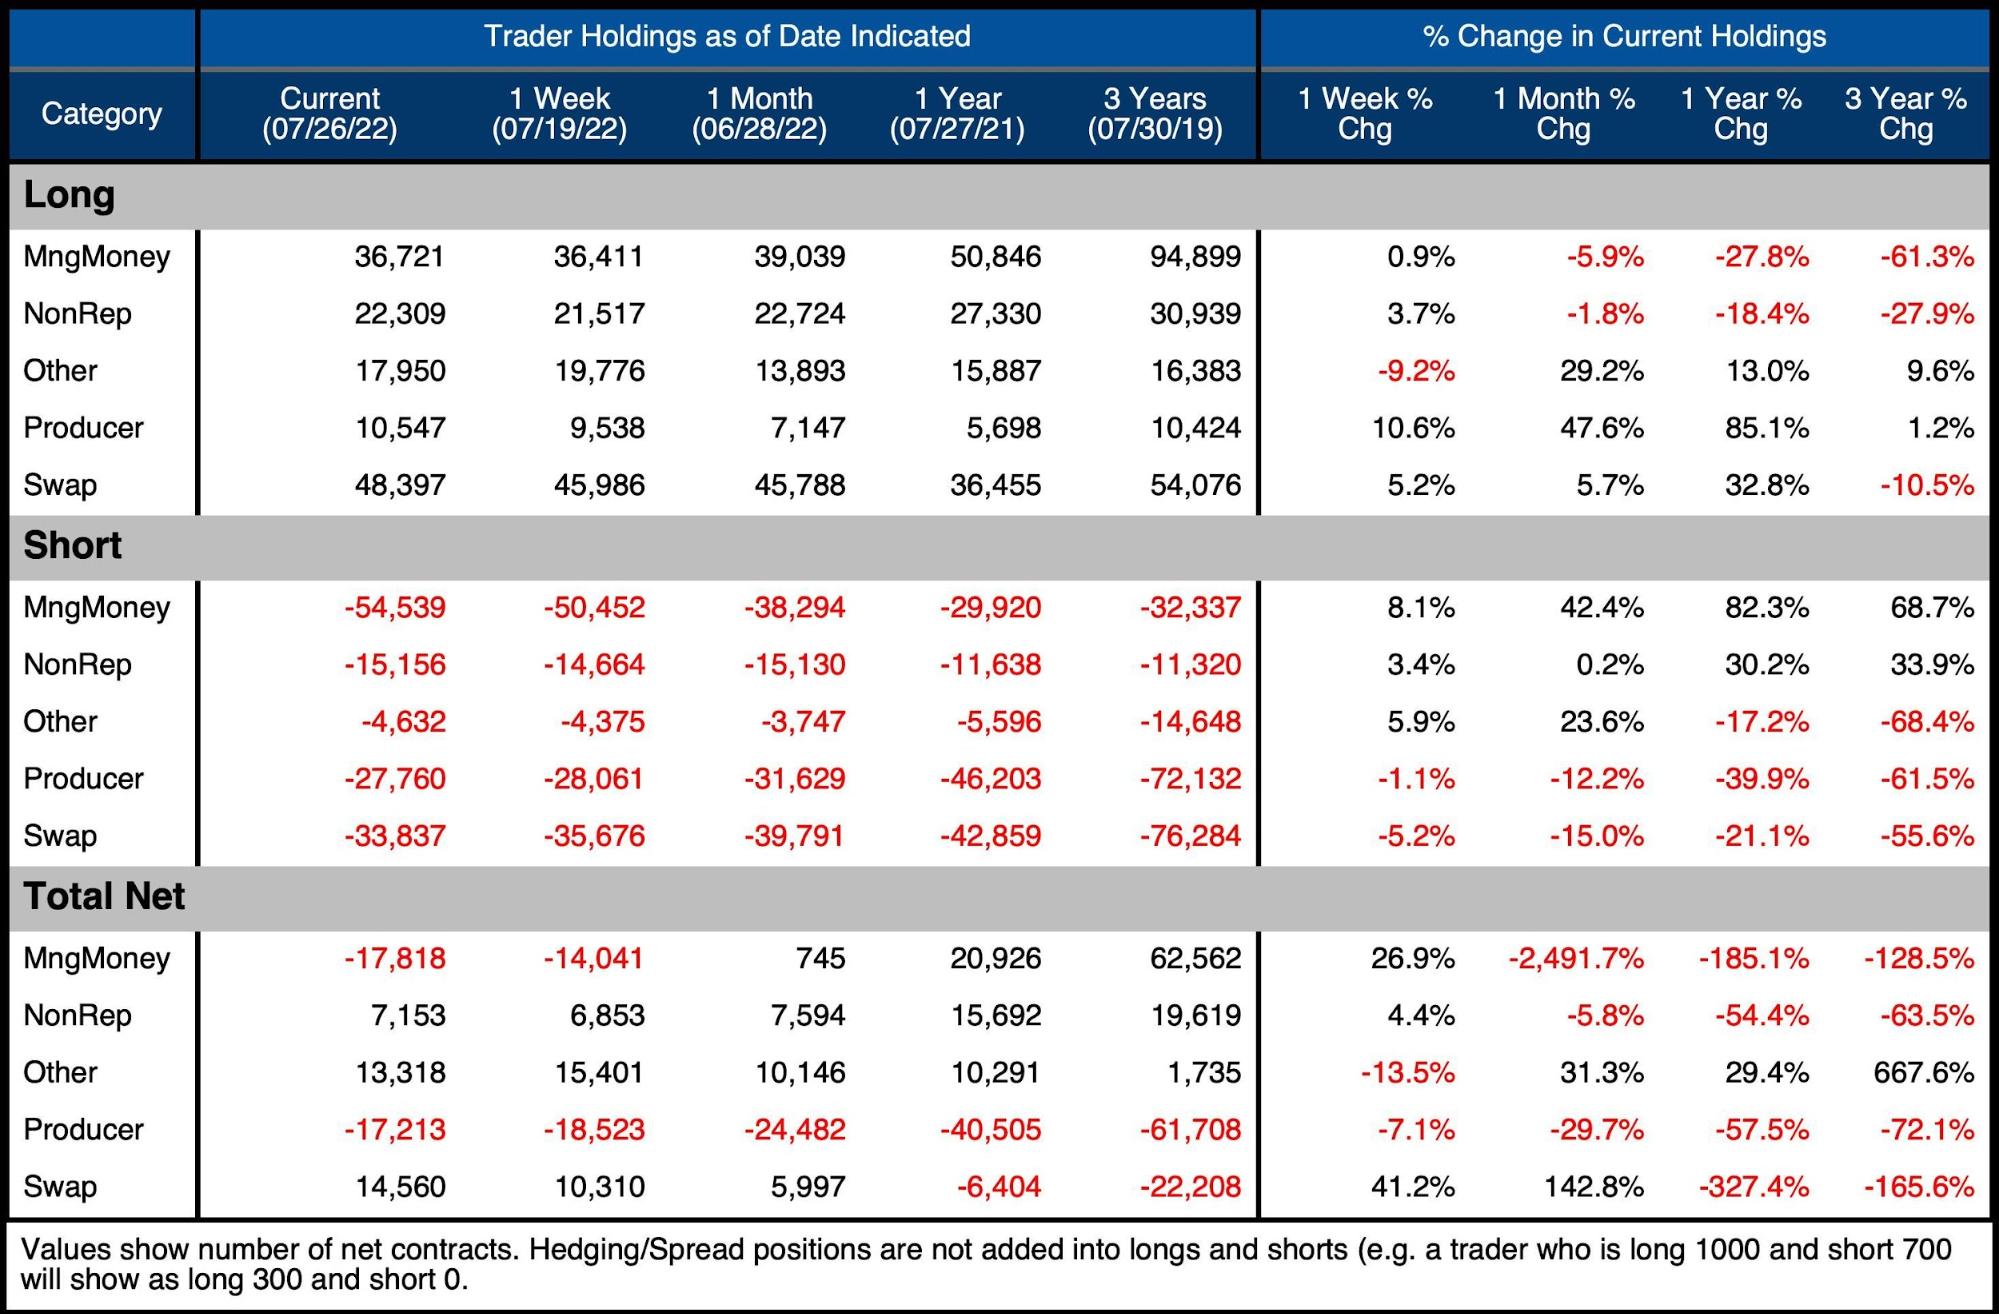
Figure: 12 Silver Summary Table
Net positioning as a percent of total open interest has also fallen off a cliff similar to gold. However, unlike gold, it’s possible that silver has found a bottom and turned up. Ironically, this is due to large net positioning on the short side of Managed Money.
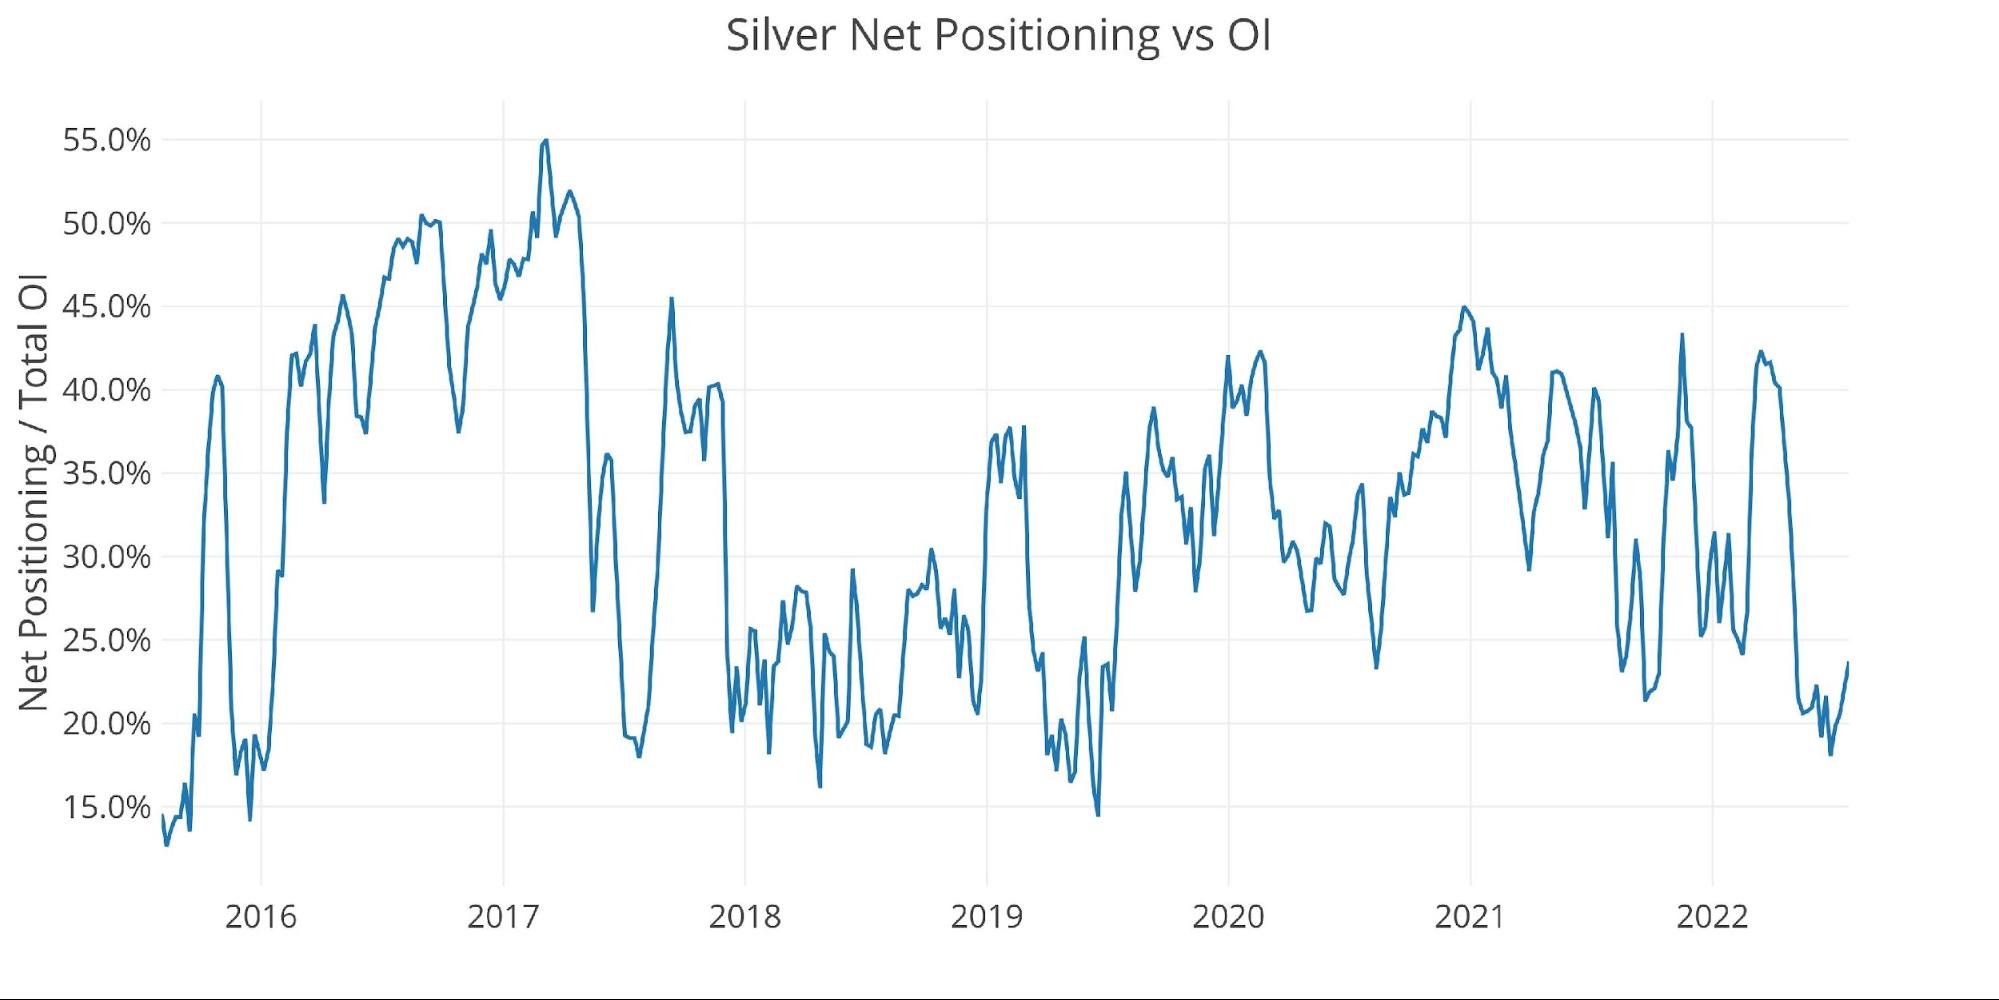
Figure: 13 Net Positioning
Historical Perspective
Looking over the full history of the COTs data by month produces the chart below. Unlike gold, the “Other” category has remained surprisingly stable over this time.
Ignoring the Covid sell-off, gross longs are now at their lowest level since Dec 2018.
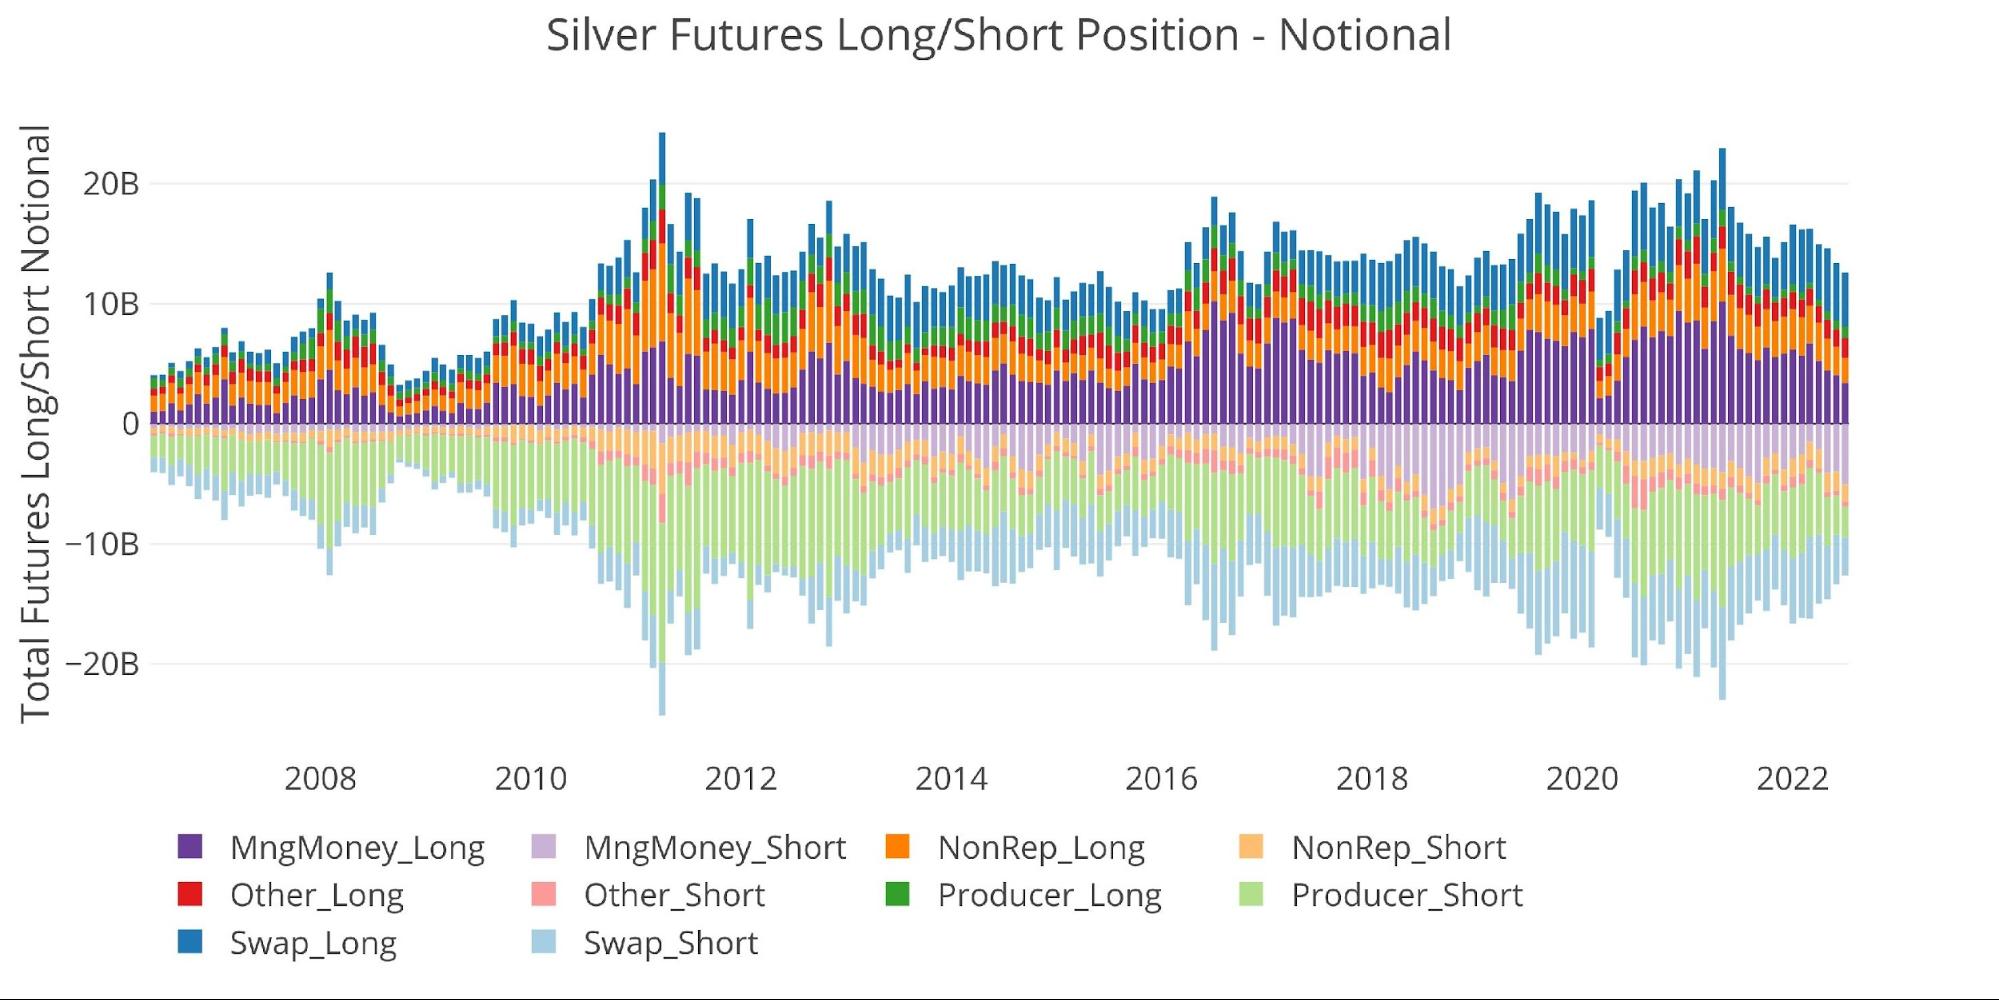
Figure: 14 Gross Open Interest
Looking at historical net positioning shows how far stretched managed money has become to the short side. Only in 2018-2019 has silver seen such a large net short position from Managed Money.
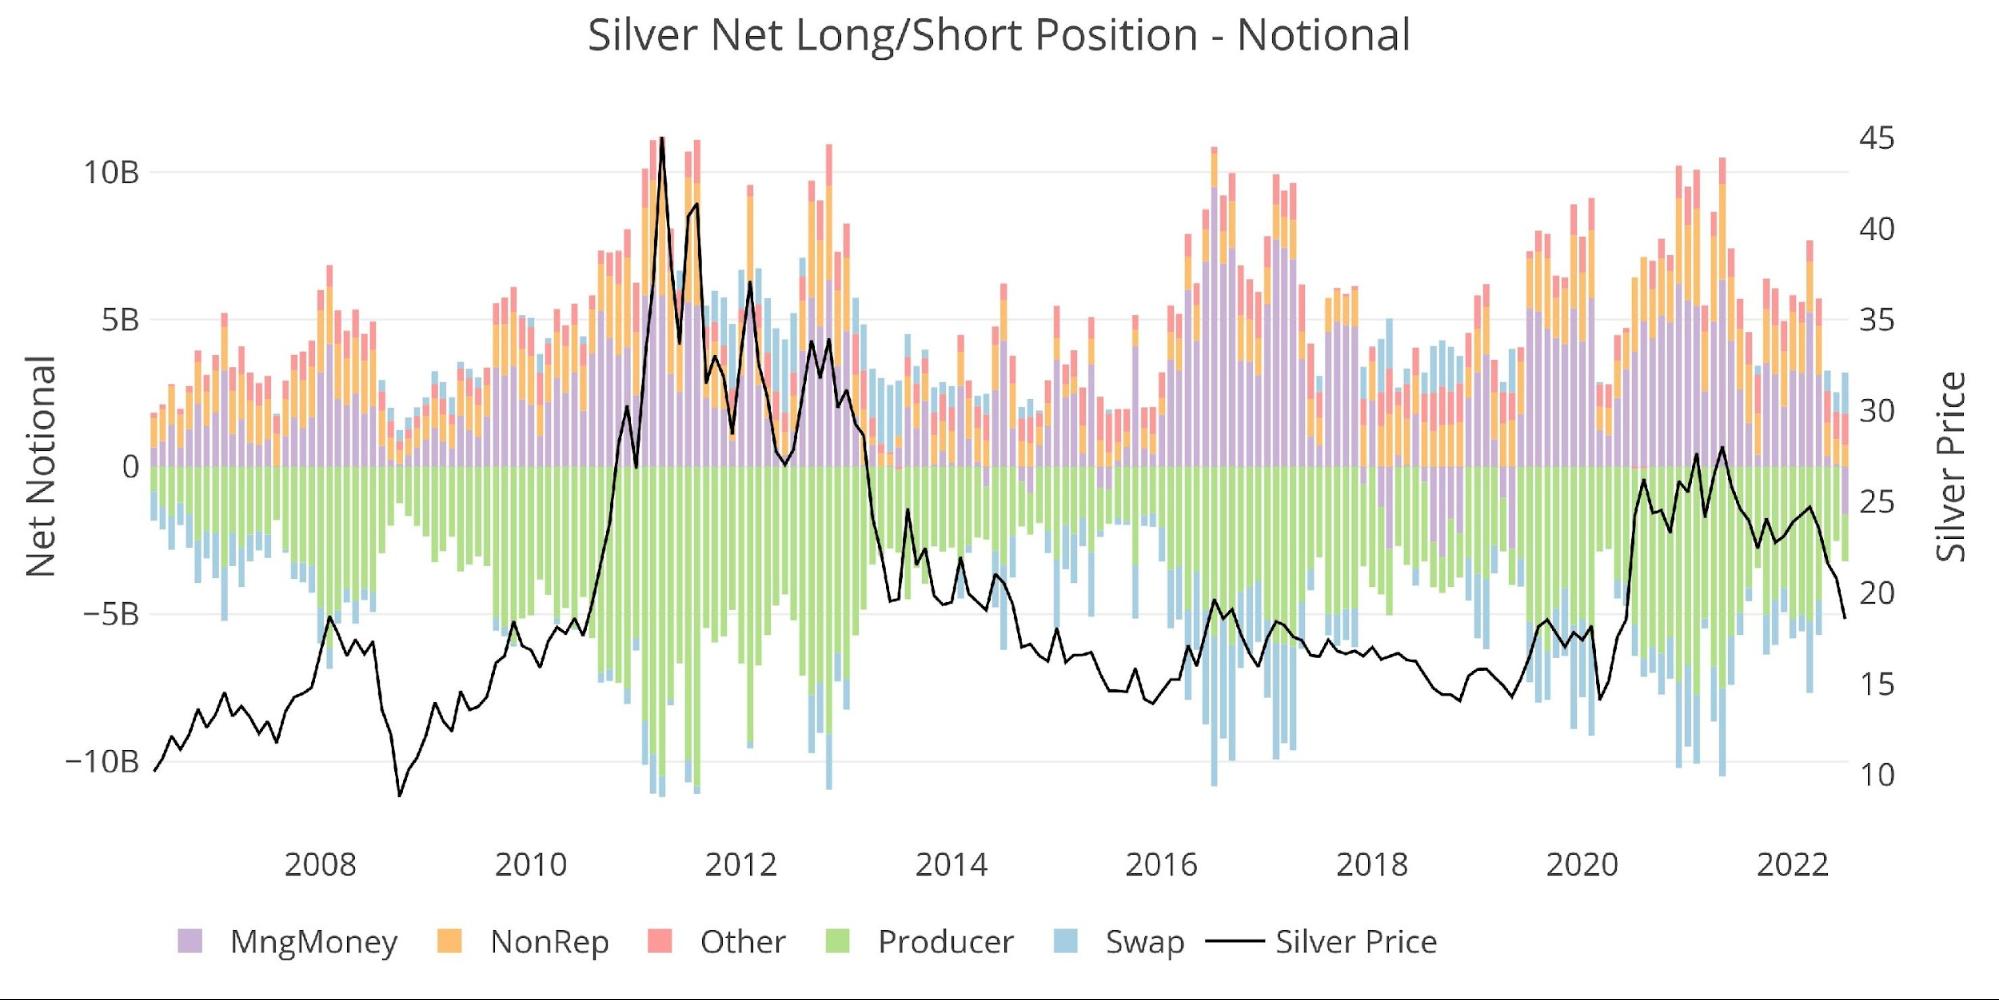
Figure: 15 Net Notional Position
The Option market is significantly smaller than gold but has continued to get smaller. Gross positioning is below $250M after getting close to $1.4B in 2020.
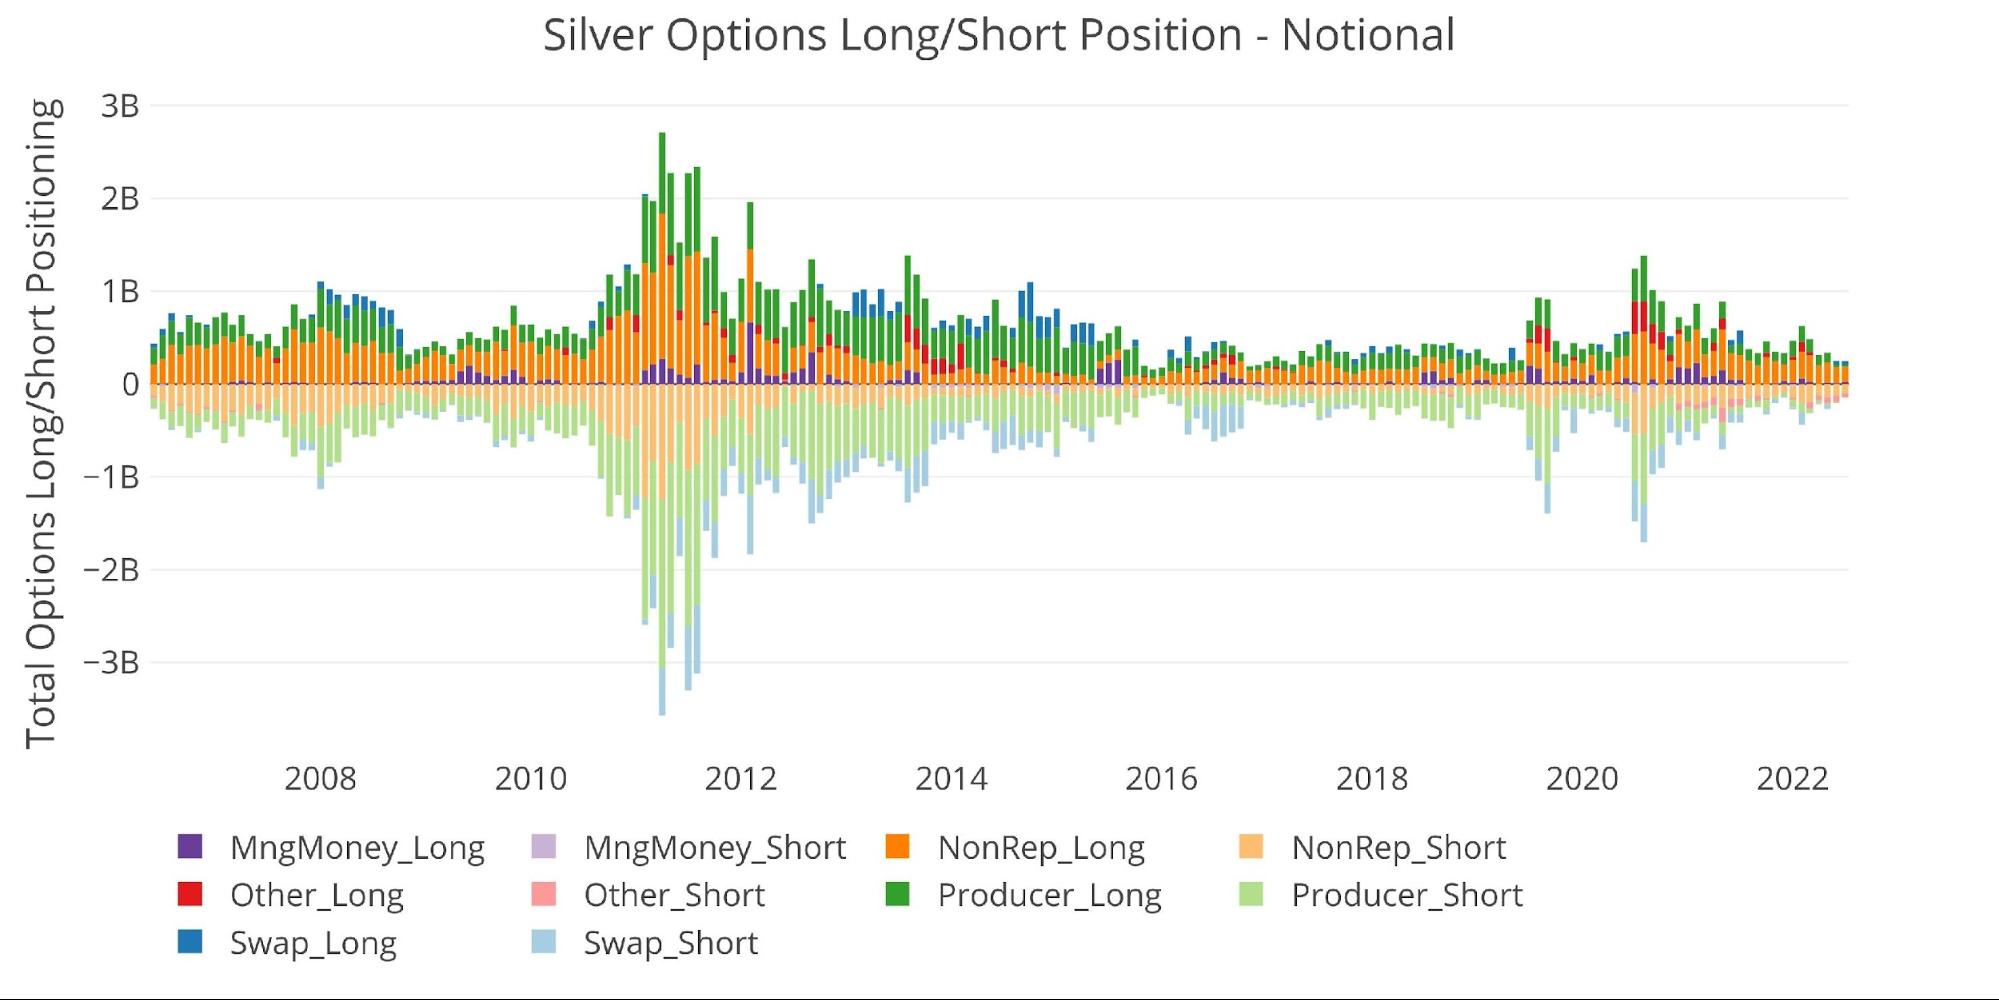
Figure: 16 Options Positions
Conclusion
“Oversold” is an understatement when looking at the most recent COTs report. Both metals have seen Managed Money reach extreme levels with massive selling over the last few weeks in the lead-up to the July FOMC meeting. This led to a relief rally in both metals from Wednesday to Friday.
The question now focused on the sustainability of this move. Was the recent rally due to profit taking, or has market sentiment flipped?
The Fed said they are far more focused on inflation than the broader economy. In the near-term, if inflation surprises to the upside, it would not be surprising to see the market continue to see speculative selling. Cooling inflation would likely create a situation where Managed Money scrambles to get on the other side of the market, which could create a price surge.
Regardless, of the near-term inflation picture, the economy will continue to deteriorate. The Fed and White House have now bet everything on the strong labor market, which is really not that strong given sky-high inflation creating pay-cuts across the board. However, when the labor market really rolls over with job losses, expect the Fed to pivot. This is when hot inflation numbers will start driving prices higher, as Managed Money loses faith in the Fed’s inflation fight.
Data Source: https://www.cftc.gov/MarketReports/CommitmentsofTraders/index.htm
Data Updated: Every Friday at 3:30 PM as of Tuesday
Last Updated: Jul 26, 2022
Gold and Silver interactive charts and graphs can be found on the Exploring Finance dashboard: https://exploringfinance.shinyapps.io/goldsilver/

Call 1-888-GOLD-160 and speak with a Precious Metals Specialist today!
Buka akaun dagangan patuh syariah anda di Weltrade.
Source link