Index Attempting Break of 200 Day EMA

This market seems hell-bent on going higher, so you cannot argue with it, despite the fact that fundamentals will certainly do not agree.
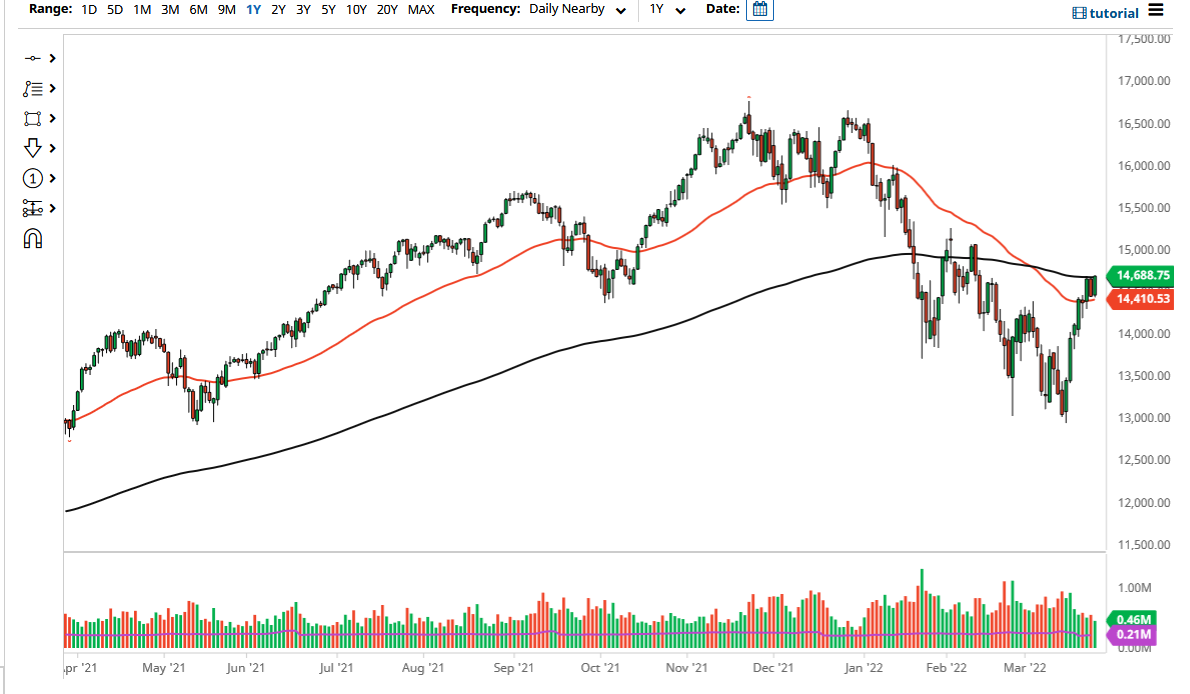
The NASDAQ 100 has rallied during the trading session on Thursday to reach the 200 Day EMA again. At this point, it looks like we are eventually going to break out above here, despite the fact that there are a whole host of reasons to think that the stock market is going to fall. Currently, it seems as if the traders on Wall Street reject the idea of the Federal Reserve being able to raise interest rates the way that they are projected to buy the bond market. It will be interesting to see this plays out, because somebody is going to be wrong, and they are going to be wrong in a big way.
Current volatility is making great stock trading opportunities – don’t miss out!
The 200 Day EMA is an indicator that a lot of people will pay close attention to, and if we were to break decisively above it, the market is likely to go looking towards the 15,000 level. Breaking above that would kick off a massive move higher for quite some time it seems. Ultimately, this is a market that seems hell-bent on going higher, so you cannot argue with it, despite the fact that fundamentals will certainly do not agree.
The most vicious rallies are in bear markets, so that could be what we are seeing, but right now it is obvious that we do not have anything stopping us from going higher it seems. That being said, you always need to keep the other side of the trade in the back of your mind, so if we were to break down below the 50 Day EMA again, it is likely that the market could drop to the 14,000 level, maybe even down to the 13,500 level after that.
As long as the volatility slows down, that could help the NASDAQ 100, and of course, you know that just a handful of stocks drive where this market goes, so keep an eye on the usual suspect such as Tesla, Microsoft, and Alpha bad. If they all rise, the NASDAQ 100 will as well. That is the nature of the index, as they make up so much of what moves the market. As we are closing above the 200 Day EMA, it looks very likely that we continue to go higher. This of course will move right along with other indices.
Source link


