Spot natural gas prices (CFDS ON NATURAL GAS) rose during the recent trading at the intraday levels, to achieve new daily gains until the moment of writing this report, by 5.36%. It settled at the price of $4.483 per million British thermal units, after rising during yesterday’s trading and for the second session on respectively, by 4.16%.

Natural gas futures saw a rebound on Monday, as a major weather model added a large chunk of demand to the late February forecast. The March Nymex gas futures contract settled at $4,160, an increase of 25.4 cents from Friday’s close, and the April contract jumped 22.5 cents.
Spot gas prices were also boosted by NGI’s Spot Gas National Avg as freezing temperatures continued to drive heating demand across the eastern US, jumping 1,040 cents to $5,670.
Meanwhile, NatGasWeather said the European weather model got 17 degrees Fahrenheit per day for the 15-day forecast, keeping cool air in the last week of February. However, through subsequent runs, the Global Forecasting System (GFS) has maintained a “fairly warm and bearish” forecast for February 21-28.
It seems that the mere possibility of the continued cold in March has caused some tension in the market ahead of the next US inventories report which could show inventories falling further significantly. The Energy Information Administration (EIA) is due to release its next weekly storage report on Thursday. Although a withdrawal of more than another 200 billion cubic feet is unlikely, a withdrawal is sure to blow past historical levels.
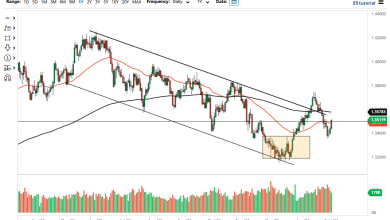
Technically, the rise of natural gas comes as a result of its earlier adoption of a major ascending trend line in the medium term. It coincided with its dependence on the support of its simple moving average for the previous 50 days, as shown in the attached chart for a (daily) period. The positive momentum that helped it to rise to settle above the important support level 4.214.
The attached chart also shows the beginning of the formation of what is known as positive divergence with relative strength indicators, after it reached oversold areas. This happened in an exaggerated way compared to the price movement, and the emergence of a positive crossover from it, to increase the positive momentum on the upcoming gas trades.
Therefore, as long as natural gas is stable above the support level 4.214, we expect it to rise further during its upcoming trading, to target the first resistance levels at 4.954.

Source link