Bitcoin continues to look less bullish than Ethereum.
Previous BTC/USD Signal
My previous signal last Thursday was not triggered as the bearish price action at $38,047 did not happen until after the Tokyo close that day.
Today’s BTC/USD Signals
Risk 0.50% per trade.
Trades must be entered prior to 5pm Tokyo time Friday.
Long Trade Ideas
- Go long after a bullish price action reversal on the H1 timeframe following the next touch of $42,446, $41,845, or $39,622.
- Place the stop loss $100 below the local swing low.
- Adjust the stop loss to break even once the trade is $100 in profit by price.
- Take off 50% of the position as profit when the trade is $100 in profit by price and leave the remainder of the position to run.
Short Trade Ideas
- Go short after a bearish price action reversal on the H1 timeframe following the next touch of $45,668 or $48,555.
- Place the stop loss $100 above the local swing high.
- Adjust the stop loss to break even once the trade is $100 in profit by price.
- Take off 50% of the position as profit when the trade is $100 in profit by price and leave the remainder of the position to run.
The best method to identify a classic “price action reversal” is for an hourly candle to close, such as a pin bar, a doji, an outside or even just an engulfing candle with a higher close. You can exploit these levels or zones by watching the price action that occurs at the given levels.

BTC/USD Analysis
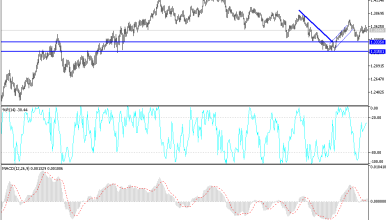
I wrote on Thursday last week that although there were bearish signs in the short-term price action and new lower resistance levels, the pattern of higher lows and the holding of support near $30k also gave reasons for a bullish case. I thought that swing and longer-term traders should be looking for a long trade from a bullish bounce at $35,583 which might set up later. Unfortunately, this did not quite set up, but the price got near that level and has risen since then.
The technical picture now is more bullish, and we have seen major cryptocurrencies continue to recover since last week and overcome some key resistance levels. However, despite the new bullishness, we saw Bitcoin could not overcome the resistance level at $45,668 which looks very pivotal. On the other hand, the nearest support level at $42,446 also looks very strong (partly because it is confluent with the big quarter-number at $42,500), and recently flipped very cleanly from resistance to support which is a sign of reliability. Therefore, it looks like the zone between these levels is a place where Bitcoin will be comfortable to range.
Later today we will get US CPI (inflation) data which is an extremely important data point for the markets (especially Forex markets) as it can have a major influence on the Fed’s monetary policy. Bitcoin could be just as volatile upon this announcement as major currencies. So, we could get a breakout from this range after the data release.
I think the best approach today will be to trade reversals from either $42,446 or $45,668. If the price can breakout beyond this range and get established above $46,000, that will be a bullish sign that the price is likely to head towards $48,455 later.

Regarding the USD today, there will be a release of CPI (inflation) data at 1:30pm London time.
Source link