2022.01.21
Inflation is the rate at which prices within a basket of goods or services (called the consumer price index or CPI) rise or fall. When a currency falls, the ability of that unit of money to purchase goods and services weakens, i.e., it takes more units of currency to buy the same basket of goods as before it weakened. The more a currency falls, the less you can buy with it because its purchasing power decreases. We call this devaluation/ loss of purchasing power.
Loss of purchasing power
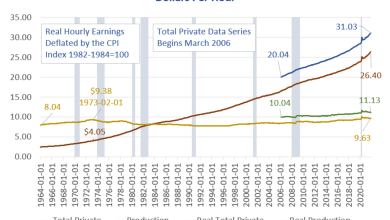
We know from a previous article that the purchasing power of most Americans earning wages or collecting a salary, has stagnated.
According to the Pew Research Center, from 1973 to 2018 the compensation of the typical US worker only grew about 12%. During the same period, the hourly median wage went up less than 10% in real (after inflation) dollars, or an average annual raise of barely 4 cents.
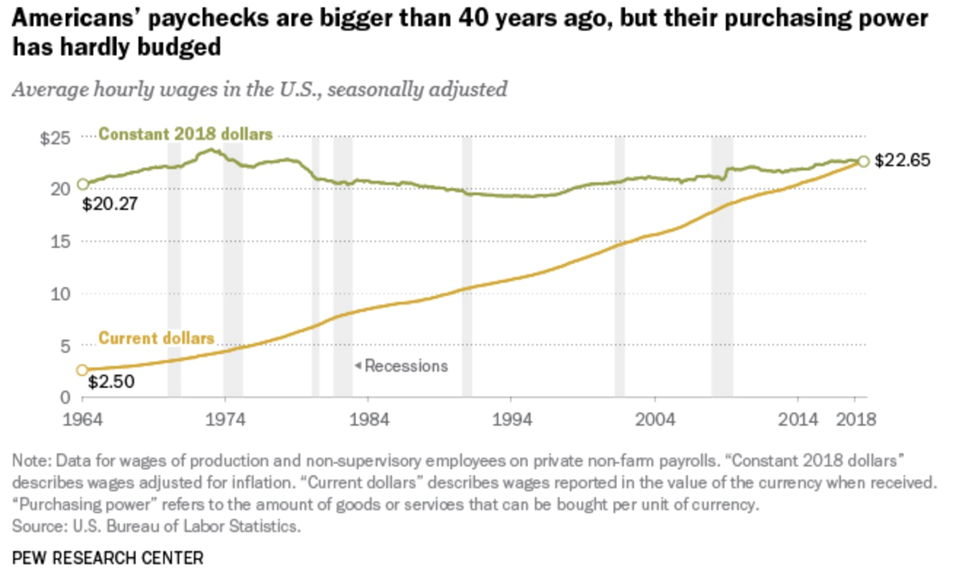
Real wages among the lowest-paid workers have fared even worse, increasing just 4.3% between 1979 and 2018.
Americans’ paychecks may have increased but their purchasing power hasn’t. According to Pew, despite some ups and downs over the past several decades, the real average wage in 2018 had the same purchasing power it did in 1978.
This is all down to inflation and the inability of fiat currencies to protect against it.
Admittedly the pandemic has somewhat reversed this trend, but inflation has also skyrocketed.
The chart below by Trading Economics shows US wage and salaries growth holding steady at about 5% since 2017, decreasing in the early part of 2020, then climbing sharply in 2021, as the US economy experienced a shortage of workers. In fact in the three months ending in September, pay jumped 1.5%, the most in 20 years. Why?
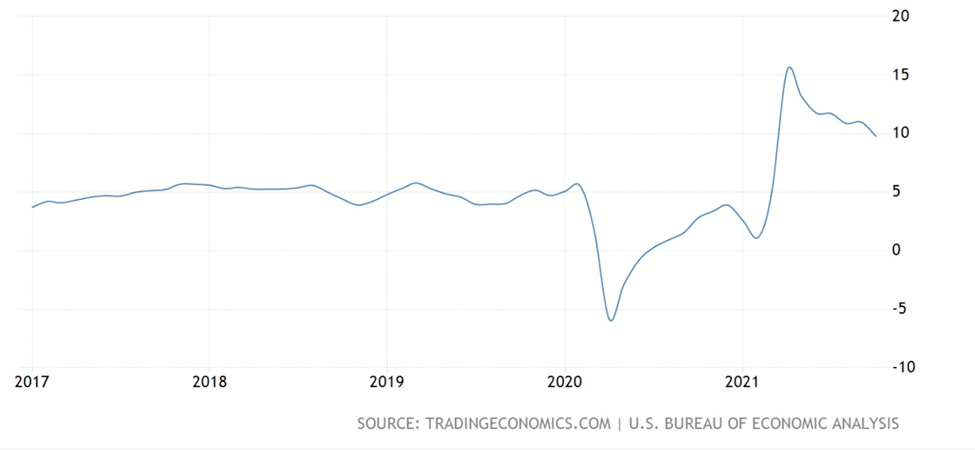
Employees have been quitting their jobs in droves, with many preferring to stay home and collect “stimmy checks”. Covid-19 has also restricted immigration. According to Axios, there are about 2 million fewer immigrants in the US because of covid immigration restrictions, about 1.5 million fewer mothers of school-aged children are working, compared to pre-pandemic times, and there were 3.3 million more retirees in October 2021 versus January 2020.
The dearth of workers has hiked wages and salaries, but significant and persistent inflation has done away with the gains in most cases. In October 2021 average hourly earnings increased by 0.4%, but inflation for the month increased 0.9%, meaning a -0.5% decrease in real average hourly earnings.
According to the Labor Department, wages swelled from April 2020 to April 2021, with average hourly earnings up 4.9% in October, but compared with inflation, real hourly wages actually declined more than 1.2% during the same period.
“For now, inflation is going to continue to run above very solid wage growth,” CNBC quoted Joseph LaVorgna, chief economist for the Americas at Natixis and former chief economist for the National Economic Council during the Trump administration.
A survey of 5,365 adults done for the New York Times, found only 17% of workers received wage increases that kept up with inflation.
While the Consumer Price Index (CPI) rose 6.8% in November, a nearly four-decade high, average hourly earnings increased just 4.8%. Other measures show pay gains lagging price increases, the newspaper states.
US wages have failed to keep up with the rate of inflation. The wage and salary earner is literally getting screwed every day because the value of the dollar is being devalued by a fractionally small amount. Over time, however, the diminished value is huge.
In the US there was an increase in inflation for every decade except the Depression. The dollar has lost 90% of its purchasing power since 1950.
It’s important to understand that the US Federal Reserve’s concept of inflation is different from both the official statistic and the reality in the economy. The Consumer Price Index (CPI) is currently 7%, which is the highest since 1982 — a 40-year high. This is the number most quoted in the financial press; it is the official inflation rate.
But the Fed when it talks about inflation, has since 2012 referred to the “Personal Consumption Expenditures” (PCE) price index. Core PCE inflation excludes food and fuel, supposedly because they’re too volatile, but the fact that the two most essential price categories are left out, means the Fed is deliberately underestimating true inflation.
Real “on the ground” inflation is much higher. CPI’s less known but more accurate cousin is the Producer Prices Index (PPI). Unlike CPI, which is crafted by bean counters, the PPI is based on information from actual producers of goods and services. The numbers don’t lie.
The latest PPI data point clocked in at 9.7% for 2021 — close to double-digit inflation.
It must also be pointed out that the government does not calculate inflation like it used to. John Williams’ Shadow Government Statistics published two charts, one showing inflation today if it was calculated the same way it was in 1990, the second showing inflation today using 1980’s methodology.
The latter reveals the actual inflation rate today is 15%, not 7%.
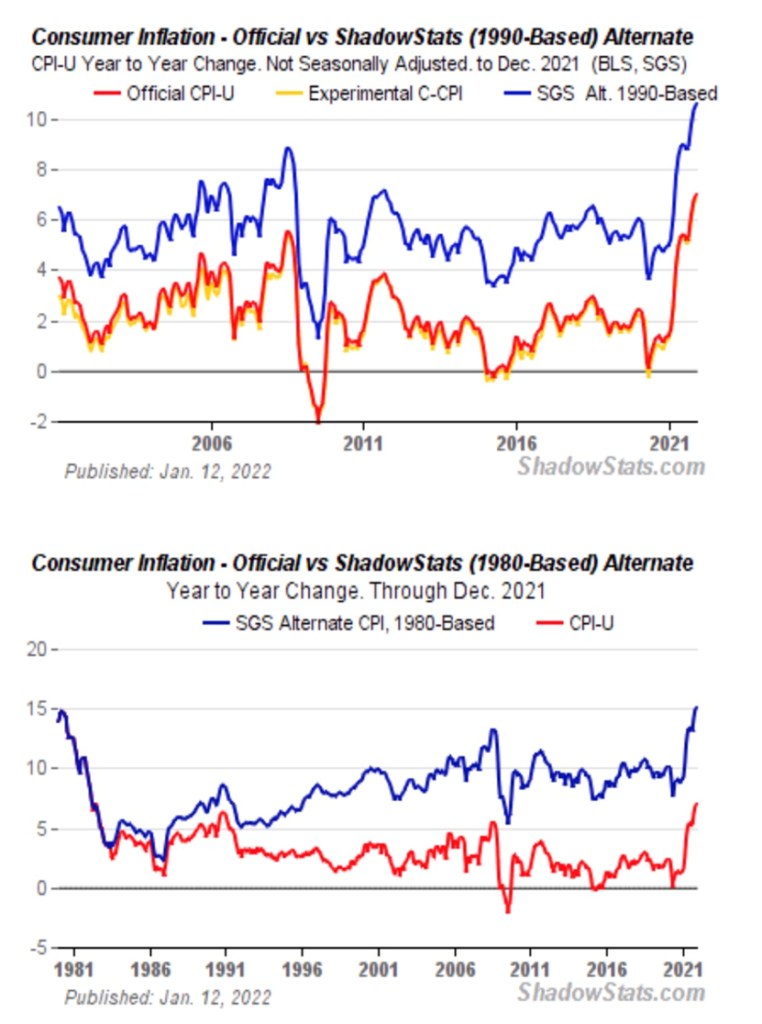
According to Williams, Over the decades, the BLS [Bureau of Labor Statistics] has altered the meaning of the CPI from being a measure of the cost of living needed to maintain a constant standard of living, to something that neither reflects the constant-standard-of-living concept nor measures adequately most of what consumers view as out-of-pocket expenditures.
For example of the current consumer price index (CPI), 24% represents the category “homeowners’ equivalent rent of residences.” Instead of reflecting a measure of home prices, as was the case before 1983, the BLS bases this figure on surveys that ask what homeowners think their home might rent for.
Williams says the aggregate impact of inflation reporting changes since 1980 have reduced the level of annual CPI by roughly seven percentage points. The effect has been a significant under-reporting of official inflation, so as to cut annual cost of living adjustment to Social Security, etc.
A comparison between using gold versus dollars to buy a basket of breakfast groceries — milk, eggs, bread and bacon, and the gas to go get them — is illustrative.
1970
Milk: $1.32 per gallon
Eggs: 60¢ per dozen
Bread: 70¢
Bacon: 85¢ – 95¢ per pound
Gasoline: 36¢ a gallon
December 2021 (US Bureau of Labor Statistics latest numbers)
Milk: $3.74 per gallon
Eggs: $1.78 per dozen
Bread: $1.53
Bacon: $7.21 per pound
Gasoline: $3.40 a gallon
Selling an ounce of gold in 2022 would give you about $1,813 — a 51X increase over the $35/oz gold in 1970. Obviously $1,813 buys a hell of a lot more breakfast groceries than $35 — you could probably feed an entire football team, including coaches and trainers, with everybody coming up for seconds.
The point is a grocery shopper using gold as a currency rather than dollars in 2022 would see a 51-fold increase in their purchasing power.
The shopper using dollars by contrast loses about 40% of their purchasing power because the prices of their grocery items have at least doubled or in the case of bacon increased by a factor of seven.
Which has been the better store of value, dollars, or gold? Obviously, it is gold — the only safe haven that protects the holder against rampant inflation caused by money-printing.
Loser bonds
There is another way that governments and the mainstream financial system keeps average Joes and Janes in check, and that is the purchase of government bonds, which in the United States, are known as Treasury bills (or notes).
Ever since the US dollar became the reserve currency in 1944, a decision made by the Bretton Woods delegation of 44 Allied countries, long-term US bonds, like the 30-year and the 10-year, have been held in high esteem by foreign governments, corporations and individuals.
When there is low confidence in the economy, people want safe investments, and US Treasuries are considered among the safest — the logic being that the US government would never stop paying interest to bondholders.
Demand for Treasuries bids up their prices and yields fall. Conversely, when confidence returns, investors dump their bonds, thinking they do not need to play it safe. This causes bond prices to sink and yields to climb.
Bondholders and the US government (through the Treasury) that issues them have a symbiotic relationship. Washington needs domestic and foreign entities to buy its debt, so that it can continue to run deficits, which keep getting added to the debt, now at $29 trillion. Treasury buyers simply need the government to be able to pay them back their principal plus interest when the bond matures.
Lately however this relationship has developed some cracks. In a recent article we found a leveling off of foreign purchases of US Treasury bonds and notes. Instead of foreigners buying T-bills, it is increasingly Americans, including consumers, banks and the biggest buyer of them all, the US Federal Reserve.
We have also identified an even more interesting trend. With 7% US inflation climbing faster and it being “stickier” than anticipated, the Fed has few policy options at its disposal. The horrendous yields on US Treasuries make them a poor investment, something foreign investors have already realized and US bond-buyers will surely cotton onto soon as well.
This practically guarantees the continuation of Fed bond buying (QE) despite the much-ballyhooed taper. As for raising rates, we have proven that the Fed can’t do it, at least not at the levels required to beat 4% inflation. We are talking about interest costs nearing a trillion dollars per year, when the deficit is accounted for.
Yet the Ponzi scheme continues: the government needs to spend big to get re-elected, but they don’t have the money, so they borrow it (issue Treasuries) or they print it (they could raise taxes, but that is political suicide). Treasuries are considered a safe investment, so the government doesn’t worry about keeping on issuing them — like soap, diapers and gasoline, they will also finding a willing buyer, even as bond prices rise and yields plummet.
This is well-illustrated in the chart below by Longtermtrends, where the black line is the nominal interest rate of a 1-year US Treasury bond, the red line is the inflation rate and the blue line is the real interest rate. The chart shows that, adjusted for inflation, the yields on US Treasuries have often been negative.
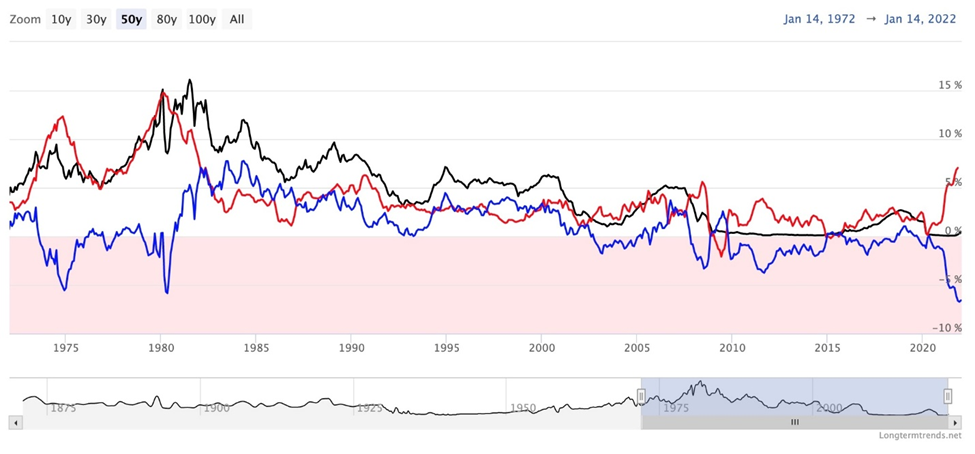
A couple of data points bear analyzing. Note inflation (in red) spiking in 1975 and 1980. In 1980, interest rates of 10% are surpassed by 15% inflation, resulting in a negative return on the 1-year, of -5%. In fact the real yield is negative for about half of the 46-year time-span between 1975 and 2021 (where the blue line is in the pink, 1975-80 and 2003-21)
Why would anyone buy a US government bond, when its “real” return, i.e., yield minus inflation, is negative?
Long-time bond watcher James Paulsen wanted to know, so he penned a note to clients entitled “Bonds are BAD!”. Forbes covered the topic in a Dec. 6, 2021 article.
Start with the assumption that many investors have learned the “60-40” rule, where bonds are considered a good way of offsetting the volatility of stocks (60% stocks, 40% bonds) while providing an income/ yield. The mix worked well for most of the past four decades, with the declining interest rates following the early 1980s peak, providing a tailwind for both asset classes. When stocks went down, bonds would invariably rally, as rates were dropped.
But when Paulsen took a longer view, going back as far as 1926, he noticed there was a sharp difference in the stock-bond return relationship when the benchmark 10-year Treasury yield was above 3% versus when it was lower.
The near-century of data found that when the 10-year yield was over 3%, bonds returned 4.6% and stocks returned 6.8%. Bonds also saw positive monthly real returns 57% of the time, which was just one percentage point less than stocks.
When the 10-year yielded less than 3%, as it does now, stocks enjoyed a 14% inflation-adjusted return while bonds gained 0%. Meanwhile stocks only dropped 35% of months, compared to 49% for bonds.
Barrons concludes, taking refuge in bonds whenever stocks have an inevitable correction may not offer safety.
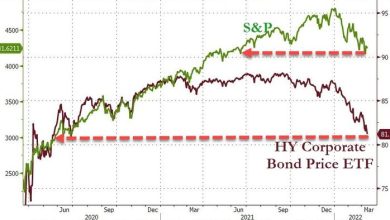
So why do investors do it? BlackRock offers some answers in a September, 2021 piece, ‘Understanding real interest rates’.
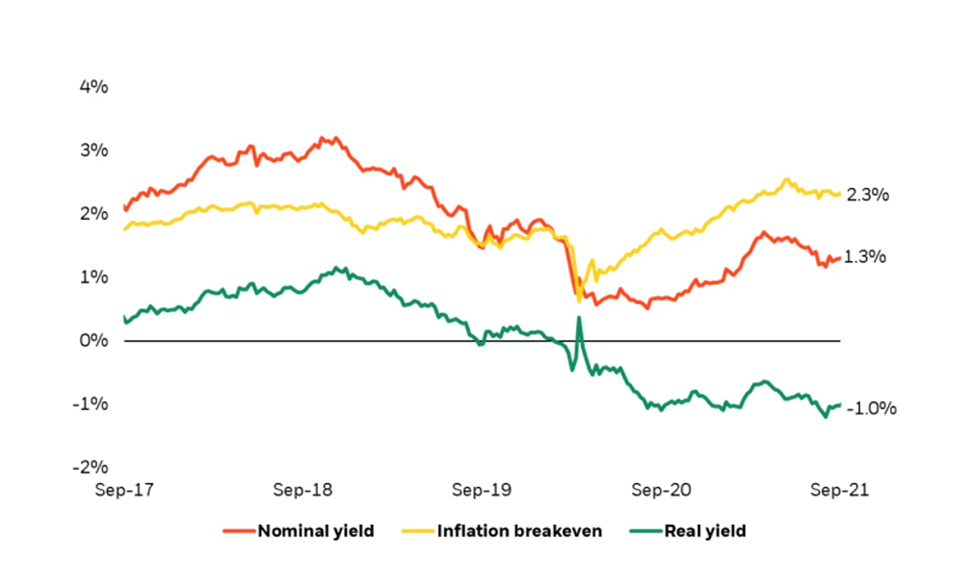
Noting that real yields have been pushing more and more negative, since September 2018 (see chart below), Blackrock identifies three types of investors who [continue] to gobble up these negative real-yielding assets. They are: foreign investors, who despite nominal US yields being so low, have developing-country yields that are even lower; institutional investors like pension funds who must buy Treasuries to fund longer-term liabilities and cash flows they must pay in future; and algorithmic-based investors that hedge portfolios by responding quickly to bond price changes. Lately they have shifted from “going short” (selling US Treasuries) to going long (buying US Treasuries). This boosts demand for Treasuries, and their prices, and pushes down their yields.
These investors all have one thing in commons, states BlackRock: none of them are buying Treasuries because they are cheaply priced or have a strong long-term return potential.
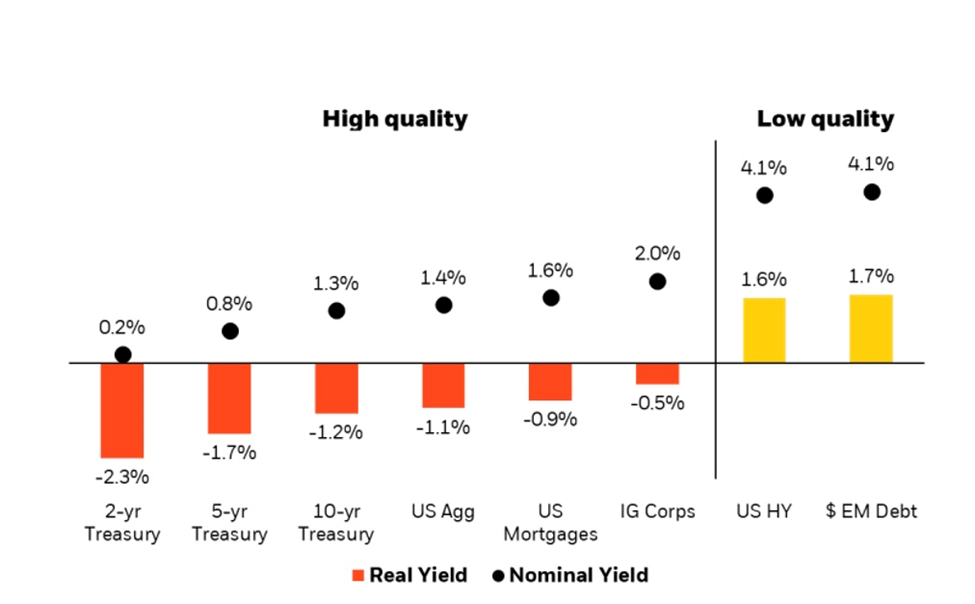
The world’s largest asset manager with US$10 trillion AUM, also observes that low US Treasury rates are resulting in pathetic yields everywhere else in fixed income markets — creating a major problem in the face of higher inflation.
With high-quality bonds like Treasuries, mortgages and investment-grade corporate debt resulting in strongly negative real annual yields, to gain any positive real yields, investors are having to go to much lower-quality bonds, including junk bonds (most of which are also negative).
The bottom line?
For investors who care about bond economics and the “real” rate of return, many have turned to finding higher nominal yields in riskier areas of the fixed income market. This strategy comes at the cost of sacrificing the safety of bond allocations and reduces diversification potential if equity markets sell off. To that end, the real problem of negative real yields looks like it is here to stay and makes rethinking the 60/40 portfolio framework more imperative than ever.
Real yields and gold
Of course, real interest rates correlate strongly to gold prices. The reason for this is simple, when real interest rates are below zero, cash and bonds fall out of favor because the real return is lower than inflation. Gold is the most proven investment to offer a return greater than inflation, by its rising price, or at least not a loss of purchasing power.
Historically, we can see the inverse relationship between negative real interest rates and gold, by charting the gold price and the 10-year Treasury’s yield after inflation.
In an article titled ‘The Golden Dilemma’, authors Claude Erb and Campbell found a near-perfect negative correlation of -0.82 (-1 being a perfect negative correlation) between real interest rates and gold prices between 1997 and 2012. Going back further in history, when real interest rates turned negative during the second half of the 1970s, gold moved as high as $1,900 an ounce, as real rates plummeted as low as -6%. When Paul Volcker, Fed Chair under President Carter and Reagan, hiked short-term nominal interest rates, real rates returned to positive, ending gold’s run. In fact, the gold price continued to drift downward, reaching a 30-year low under $400 an ounce in 2001. The gold bull market of 2010 to 2013 is easily seen in juxtaposition with negative real interest rates which bottomed out at around -4% during that same period.
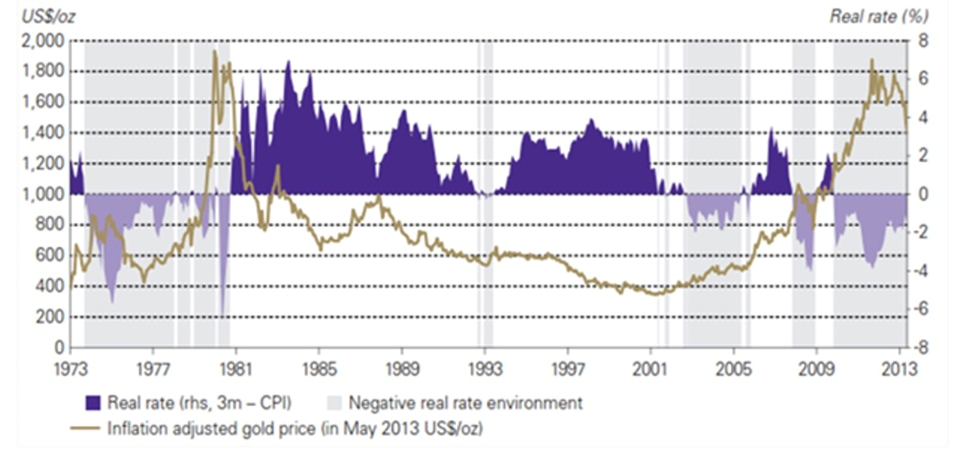
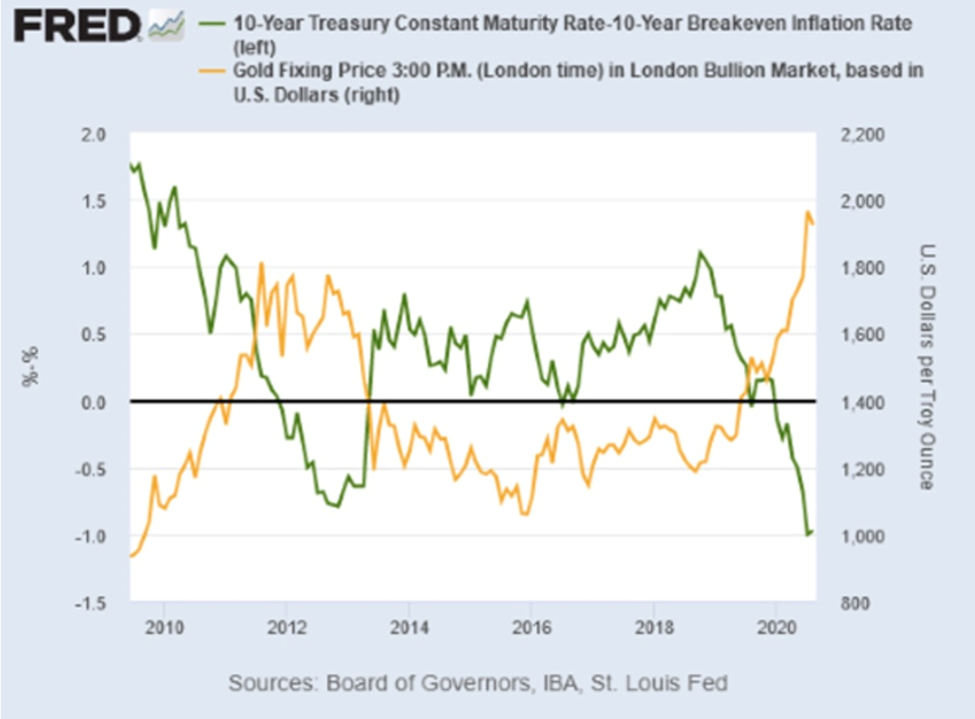
In the FRED chart below, notice that the gold price between 2013 and 2020 never gets above $1,400, corresponding to the period when the real yield on the 10-year is between about 0% and 1%. However, when real yields “go negative,” as they did around 2011-13, and in 2020, gold prices jumped.
2020’s 22% increase in the gold price was due to pandemic fears, combined with a low US dollar and plunging Treasury yields, causing real yields to go negative even though inflation stayed below 2%.
2020’s dramatic bond rally drove down yields across the world. On March 8, 2020, the US 10-year Treasury note reached an all-time low of -0.38%; two days earlier the German “bund” fell to a record -0.74%.
Investors piled into sovereign debt based on expectations of monetary stimulus like financial crisis-era easing programs that pushed down interest rates to zero and sparked a multi-year rally in stocks.
Gold and debt to GDP
Gold also tracks the debt to GDP ratio closely, an important metric economists use for comparing a country’s total debt to its gross domestic product (GDP).
The percentage arrived at by dividing the country’s total GDP by its total debt indicates the country’s ability to pay back its loans. The higher the percentage, the higher the risk of a country being unable to pay the interest on its debt, and therefore defaulting on its debt. (countries with high debt-to-GDP ratios typically have trouble paying off debts. Because they are a higher risk to paying loans back, creditors demand higher interest rates. If a country’s debt-to-GDP ratio becomes too extravagant, creditors may stop lending to it altogether)
Apart from telling us which countries are good and bad credit risks, the debt-to-GDP ratio can also help in predicting the price of gold. The chart below, by the Federal Reserve Bank of St. Louis, compares total US public debt as a percentage of GDP, to the London Bullion Market gold fixing price.
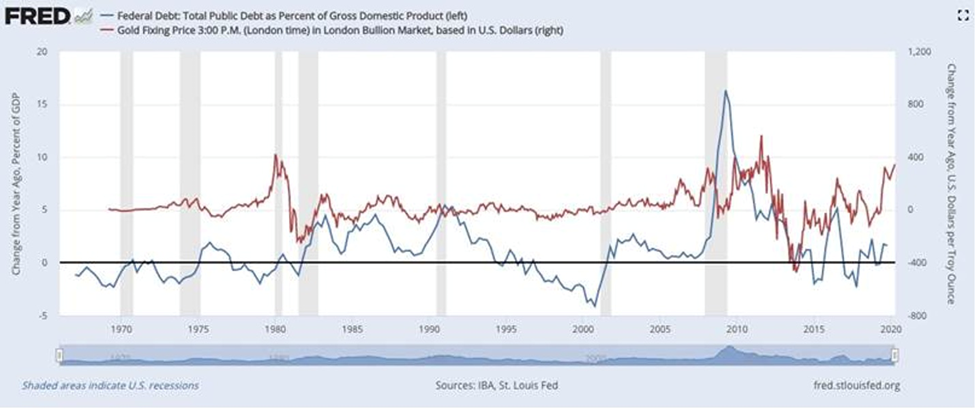
As the debt-to-GDP-ratio rises, either because of a drop in GDP due to a recession, or a jump in government borrowing that piles up debt, or both, the gold price reacts.
During the rounds of QE conducted by the US Federal Reserve, starting in 2008, the Fed increased the money supply by $4 trillion. But there was also a massive fiscal stimulus package launched to get the economy moving again. Bailing out the banks cost $250 billion and the American Recovery and Reinvestment Act added $242 billion to budget deficits in 2009 and $400 billion in 2010.
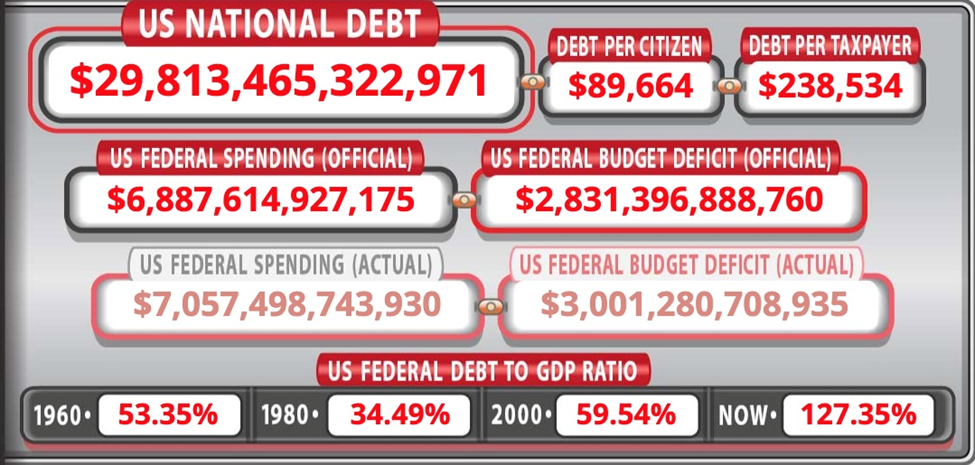
We see the debt-to-GDP ratio jump from 62% in 2007 to 83% in 2009, 90% in 2010, and it has kept climbing ever since; it is currently at 127.3%, according to usdebtclock.org.
Role of the Fed
This wouldn’t be possible without the US Federal Reserve.
The Fed operates as a central bank, controlling fiscal and monetary policy. Its three goals are to promote maximum employment, keep prices stable (ie. control inflation) and to moderate long-term interest rates. But the Fed is “independent” in that it is not a part of the US government. While the US President appoints its seven-member board of governors, including its chair (appointments must be approved by the Senate), he has no direct control over its policies – though he’d certainly like to.
Over the years this set-up has led to frequent conflicts between US Presidents and the Federal Reserve. A column on CNBC notes that while Presidents Clinton and Bush II avoided criticizing the Fed, they are the exceptions not the norm.
So how did the US come to have a central bank that is independent from the government, anyway? It all goes back to November 22, 1910, when a delegation of the nation’s leading financiers, led by Senator Nelson Aldrich, left New Jersey for a secret 10-day meeting on Jekyll Island, Georgia.
Among the attendees are some now-familiar American family banking names:
- Frank Vanderlip, president of the National City Bank of New York, associated with the Rockefellers
- Henry P. Davison, senior partner of J.P. Morgan Company, regarded as Morgan’s personal emissary
- Charles D. Norton, president of the Morgan-dominated First National Bank of New York
- Col. Edward House, who would later become President Woodrow Wilson’s closest adviser and founder of the Council on Foreign Relations
- Benjamin Strong, a lieutenant of J.P. Morgan
- Paul Warburg, a recent immigrant from Germany who had joined the banking house of Kuhn, Loeb and Company, New York directed the proceedings and wrote the primary features of what would be called the Aldrich Plan.
The Fed began with approximately 300 people, representatives of banks who became owners (stockholders purchased stock at $100 per share) of the Federal Reserve Banking System. 100% of its shareholders are private banks; the stock is not publicly traded and none of its stock is owned by the US government.
The Federal Reserve Bank (Fed) is a privately-owned company (Wikipedia describes the Fed as a “complex business-government partnership that rules the financial world”) that controls and profits immensely by printing money through the US Treasury and loaning money out to commercial banks.
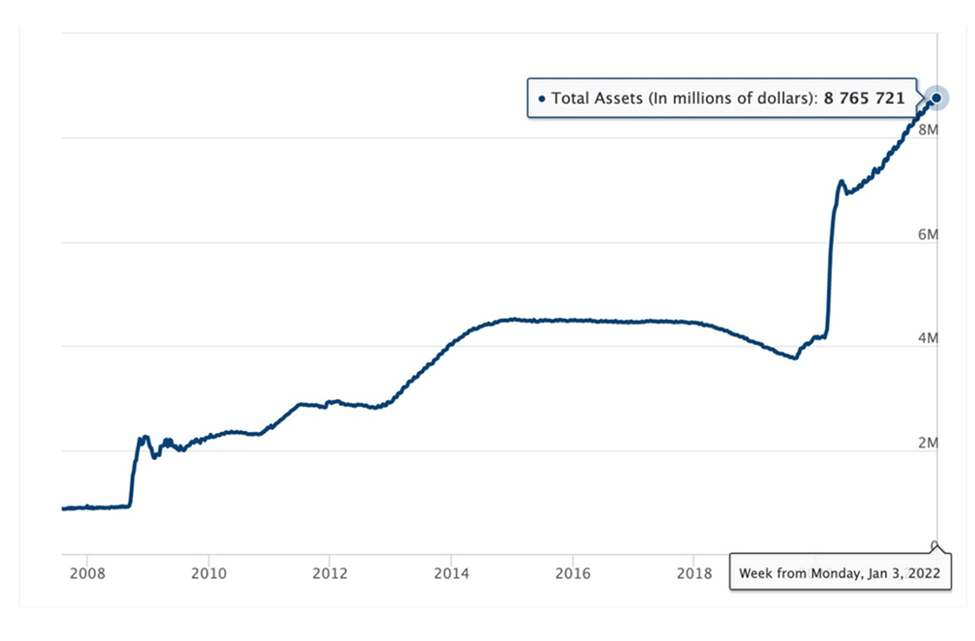
Between 2008 and 2015 the Fed bought trillions of dollars worth of T-bills and mortgage-backed securities, keeping interest rates near zero percent, but making the US debt balloon from $900 billion to $4.5 trillion. After a brief hiatus, QE was re-started, as a reaction to the coronavirus pandemic.
Since the fourth round of QE began in the spring of 2020, the Fed’s total assets have more than doubled, to $8.7 trillion.
The whole point of creating the Federal Reserve System was to give the new central bank (the Fed) control over the money supply – having been spooked by the crisis of 1907. Here a bit of history is useful, courtesy of former US Senator Ron Paul and Lewis Lehrman’s ‘The Case for Gold’ — written back in 1983.
In their seminal work of economic history, Paul and Lehrman go right back to the beginning of what they call “The Present Monetary Crisis” when in 1784, Thomas Jefferson said, “If we determine that a dollar shall be our unit, we must then say with precision what a dollar is.”
The founding fathers followed his advice and in 1792 defined one dollar as 371 grains of silver. From then until 1971, the dollar was defined by a weight of either silver or gold, but since 1971, when President Nixon abandoned the gold standard, the dollar remains undefined by a physical value. The greenback is really nothing more than a piece of paper printed with government ink and imbued with the subjective value that a $1 bill is in fact worth the 100 cents the government says it is worth.
In 1900 the governing Republicans officially announced the gold standard. All paper money was to be redeemable in gold, and silver continued as a subsidiary metal. The problem was that between 1897 and 1914, an increase in gold production pushed the gold supply up by 7.5%. However the amount of cash deposits during the same period overwhelmed the amount of gold in bank vaults — total bank deposits increased 317.5% to gold’s 7.5% rise. In 1907 the Treasury was called upon to bail out the banks that ran short on cash, resulting in an agreed need for some form of central banking.
Hence the 1910 meeting at Jekyll lsland, Georgia and the creation of the US Federal Reserve.
An instrument of inflation
Paul and Lehrman explain how by creating the US Federal Reserve System, the government invited persistent inflation:
By establishing the Federal Reserve System, the federal government changed the base of the banking pyramid to the Federal Reserve Banks. Only the Federal Reserve could now print cash, and all member banks could now multiply their deposits on top of Federal Reserve deposits. All national banks were required to join the Federal Reserve, and their gold and other lawful money reserves had to be transferred to the Federal Reserve. The Federal Reserve, in turn, could pyramid its deposits by three-to-one on top of gold. This centralization created an enormous potential for inflationary expansion of bank deposits. Not only that, reserve requirements for the nation’s banks were deliberately cut in half in the course of establishing the Federal Reserve System, thereby inviting the rapid doubling of the money supply. Average reserve requirements for all banks prior to the Federal Reserve Act is estimated to be 21 percent. In the original Act of 1913, these were cut to 11.6 percent and three years later to 9.8 percent. It is clear then that the Federal Reserve was designed from the very beginning to be an instrument for a uniform and coordinated inflation of bank money.
Indeed, total bank deposits were $14.0 billion at the beginning of the Federal Reserve System in January 1914; after six years, in January 1920, total bank deposits had reached $29.4 billion, an enormous increase of 110 percent or 18.3 percent per year. The creation of the Federal Reserve had made that expansion possible.
Yet it was nothing compared to what would come after 1971, when President Nixon announced that no more gold would be given in exchange for dollars. “There were now absolutely no checks on the availability of the United States to inflate,” states the Paul and Lehrman report.
In a clear reference to the inflationary 1980s, the authors conclude that There has never, in peacetime American history, been any sustained rate of inflation to match the inflation since 1941. The same, in fact, is true of wartime, which at least has never lasted more than a few years. And it is not an accident that the highest, most accelerated rate of inflation has taken place since 1971, when the United States went off the international aspects of the gold standard and went over completely to fiat paper.
And in the forward to the report:
[All] the effort and planning imaginable cannot make paper money work. There is no way paper can be “improved” as money. Whenever governments are granted power to purchase their own debt, they never fail to do so, eventually destroying the value of the currency. Political money always fails because free people eventually reject it. For short periods individual countries can tell their citizens to use paper, but only at the sacrifice of personal and economic liberty.
The Fed’s ability to print money on a whim, to “purchase their own debt” in the words of Ron Paul and Lewis Lehrman, is best exemplified by the quantitative easing programs that followed the 2008 financial crisis, in that case the popping of the US housing market bubble, elevated out of control via easy credit and toxic bank loans.
Fourteen years later the US debt sits at $29 trillion and counting. The World Bank has warned of the risks of a new global debt crisis – pointing to the latest of four waves of debt accumulation over the past 150 years.
The current wave which the Washington, DC-based group says started in 2010, is thought to be “the largest, fastest and most broad-based increase” in global borrowing since the 1970s, CNN reports.
In the first quarter of 2019, world debt hit $246.5 trillion, reversing a trend that started in the beginning of 2018, of reducing debt burdens, when global debt reached its highest on record, $248 trillion.
We’ve written extensively about the dangers of the mounting US debt load.
The country is accumulating about the same amount of debt as its annual economic output. Each year another trillion dollars gets added to the national debt.
The Congressional Budget Office (CBO) and the Committee for a Responsible Federal Budget (CRFB) — both reliable sources — project a deficit of $1.3T in 2022, and every year until 2031.
As an indication of how far removed we are from the gold standard era, when governments were unable to freely print money or borrow, because the dollar was fixed to gold (1 oz = $35) consider the fact that US debt is growing a lot faster than above-ground gold inventories. According to Gold Broker, over the past 10 years the federal debt has doubled but the above-ground stock of gold has only grown 17%.
Moreover, the total US debt to GDP ratio is at a record 370% (all debt including public, corporate and household debt).
Visual Capitalist created an interesting infographic that compared debt growth to gold and silver coin production during the Obama and Trump presidencies. It found that US gold coins minted dropped from $6.7 billion in Obama’s first term, to $2.9B in Trump’s term (to Oct. 26, 2020) and $3.7B in silver coins minted fell to $1.4B during the same time frame.
In Trump’s term, the value of US debt was almost $1,600 times higher than the value of minted silver and gold coins combined.
Conclusion
It’s not a stretch to envision a scenario whereby the world’s reserve currency, the US dollar, collapses under the weight of unmanageable debt, triggered say, by a mass offloading of US Treasuries by foreign countries, that own about $7.5 trillion of US debt (a selloff may also occur due to investors sick of getting such low yields for their US government bonds).
This would cause the dollar to crash, and interest rates would go through the roof, choking consumer and business borrowing. Import prices would skyrocket too, the result of a low dollar, hitting consumers in the pocket-book for everything not made in the USA. Business confidence would plummet, mass layoffs would occur, growth would stop, and the US would enter a recession.
Owning gold (and silver) continues to be the best defense against inflation, stagflation, and rampant currency debasement, during this period of unprecedented and irresponsible debt accumulation.
Also, when government can’t offer a positive real return, gold usually functions as the asset of last resort.
Richard (Rick) Mills
aheadoftheherd.com
subscribe to my free newsletter
Legal Notice / Disclaimer
Ahead of the Herd newsletter, aheadoftheherd.com, hereafter known as AOTH.
Please read the entire Disclaimer carefully before you use this website or read the newsletter. If you do not agree to all the AOTH/Richard Mills Disclaimer, do not access/read this website/newsletter/article, or any of its pages. By reading/using this AOTH/Richard Mills website/newsletter/article, and whether you actually read this Disclaimer, you are deemed to have accepted it.
Any AOTH/Richard Mills document is not, and should not be, construed as an offer to sell or the solicitation of an offer to purchase or subscribe for any investment.
AOTH/Richard Mills has based this document on information obtained from sources he believes to be reliable, but which has not been independently verified.
AOTH/Richard Mills makes no guarantee, representation or warranty and accepts no responsibility or liability as to its accuracy or completeness.
Expressions of opinion are those of AOTH/Richard Mills only and are subject to change without notice.
AOTH/Richard Mills assumes no warranty, liability or guarantee for the current relevance, correctness or completeness of any information provided within this Report and will not be held liable for the consequence of reliance upon any opinion or statement contained herein or any omission.
Furthermore, AOTH/Richard Mills assumes no liability for any direct or indirect loss or damage for lost profit, which you may incur as a result of the use and existence of the information provided within this AOTH/Richard Mills Report.
You agree that by reading AOTH/Richard Mills articles, you are acting at your OWN RISK. In no event should AOTH/Richard Mills liable for any direct or indirect trading losses caused by any information contained in AOTH/Richard Mills articles. Information in AOTH/Richard Mills articles is not an offer to sell or a solicitation of an offer to buy any security. AOTH/Richard Mills is not suggesting the transacting of any financial instruments.
Our publications are not a recommendation to buy or sell a security – no information posted on this site is to be considered investment advice or a recommendation to do anything involving finance or money aside from performing your own due diligence and consulting with your personal registered broker/financial advisor.
AOTH/Richard Mills recommends that before investing in any securities, you consult with a professional financial planner or advisor, and that you should conduct a complete and independent investigation before investing in any security after prudent consideration of all pertinent risks. Ahead of the Herd is not a registered broker, dealer, analyst, or advisor. We hold no investment licenses and may not sell, offer to sell, or offer to buy any security.
Source link