US Dollar, EUR/USD, GBP/USD, USD/CAD, USD/JPY Talking Points:
- The US Dollar has spent the day holding support at a big spot following last week’s breakdown. That breakdown quickly went into an oversold state and the bounce we’re seeing this week may be a simple corrective move.
- Next week’s FOMC meeting will be widely-watched for clues on forward-looking policy. At this point, markets have geared up for a much more-hawkish Fed this year. But – will the bank deliver?
- The analysis contained in article relies on price action and chart formations. To learn more about price action or chart patterns, check out our DailyFX Education section.
The US Dollar breakdown last week saw prices in DXY fall all the way down to the 94.74 level. This was the swing high in September of 2020 which set the yearly high well into 2021 trade, eventually giving way in early-November as markets started to gear up for a more-hawkish Fed, helped along by continued growth in inflation.
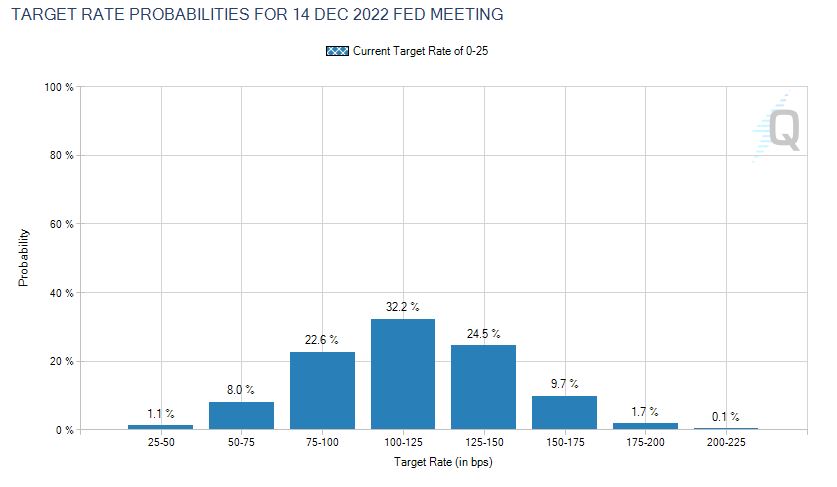
The motive behind last week’s breakdown was also inflation-related, as the move showed shortly on the heels of another 40-year high in that data point. The difference between this instance and the release in early-November that prodded a bullish breakout: Market expectations for rate policy. In December and early-January markets started to gear up for a hawkish pivot at the Federal Reserve and while the Fed merely opened the door to possible rate hikes last-September, then forecasting a possible 2-3 hikes at the December meeting – markets are now expecting as many as seven rate hikes this year, albeit at a mere 1.8% probability.
As of this writing the median expectation is for four hikes by the end of the year, with a whopping 68.2% probability of at least four hikes. To say that expectations have shifted would be an understatement, especially considering some of the weakness that’s been seen in non-inflation economic data out of the US of recent.
US Rate Hike Probabilities to December, 2022
US Dollar
From a longer-term perspective, there’s still a case to be made for bearish structure after the breakdown at descending triangle support. But – the levels from that prior formation continue to have some pull, with prior support at 94.52 coming back in as short-term support, and the Fibonacci level at 95.86 currently functioning as resistance.
For buyers to re-take control here, a break back-above the 96-handle will start to re-open the door. Until then, the onus is on bulls to hold the lows.
US Dollar Daily Price Chart
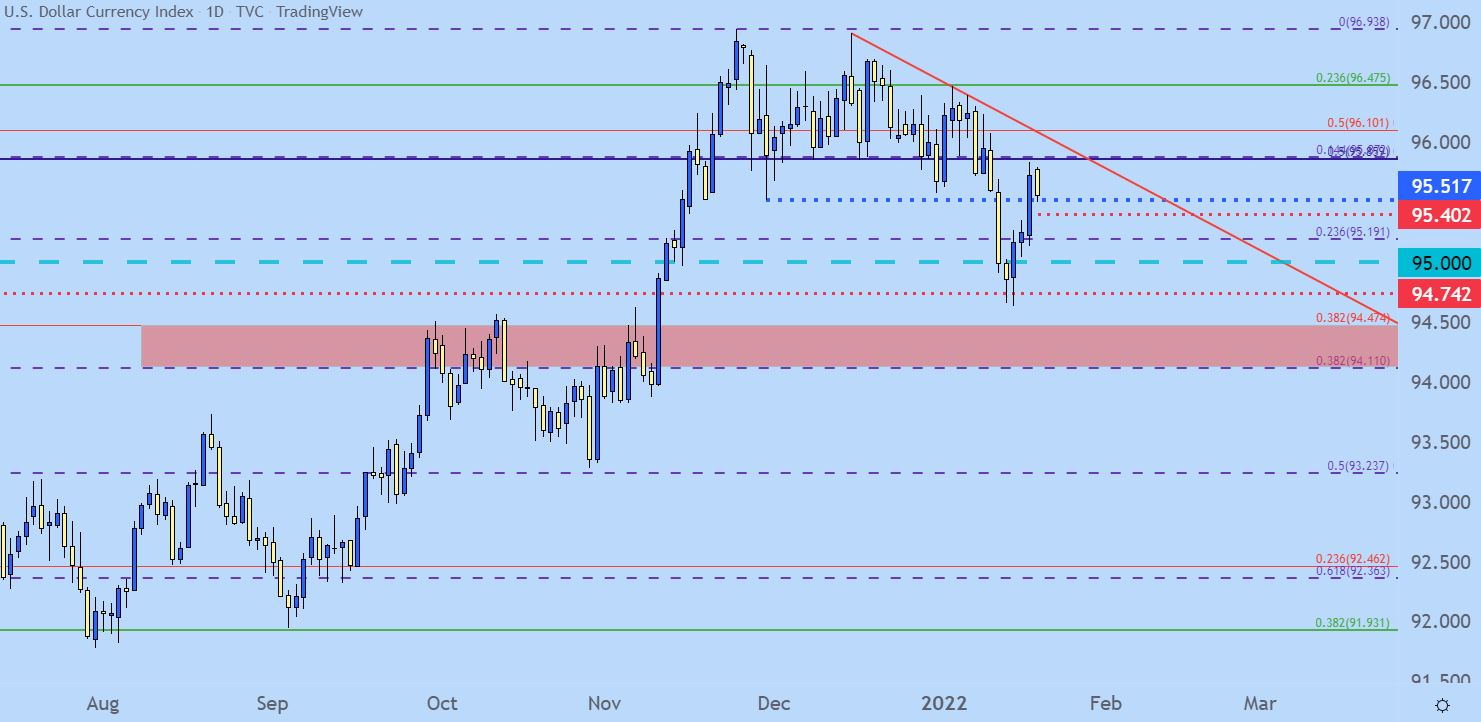
Chart prepared by James Stanley; USD, DXY on Tradingview
US Dollar Short-Term: Bull Flag
This is a really short-term observation but it plays into the 95.52 support mentioned above. That price had helped to set the floor for the descending triangle formation last week and bears made quick work of that on the heels of the CPI print.
But – it’s back in-play, helping to set support in a short-term bull flag formation. As of this writing, that level has held the lows for the past five hours. Below that is a quick spot of potential support around 95.40, after which the 95.20 level comes into play. Above current price action – the 95.86 Fibonacci level looms large after which 96.10 comes into play. Breaking above that breaches the bearish trendline that marked the descending triangle and that would be a form of nullification of the bearish move that can start to re-open the door for bullish USD strategies.
US Dollar Hourly Price Chart
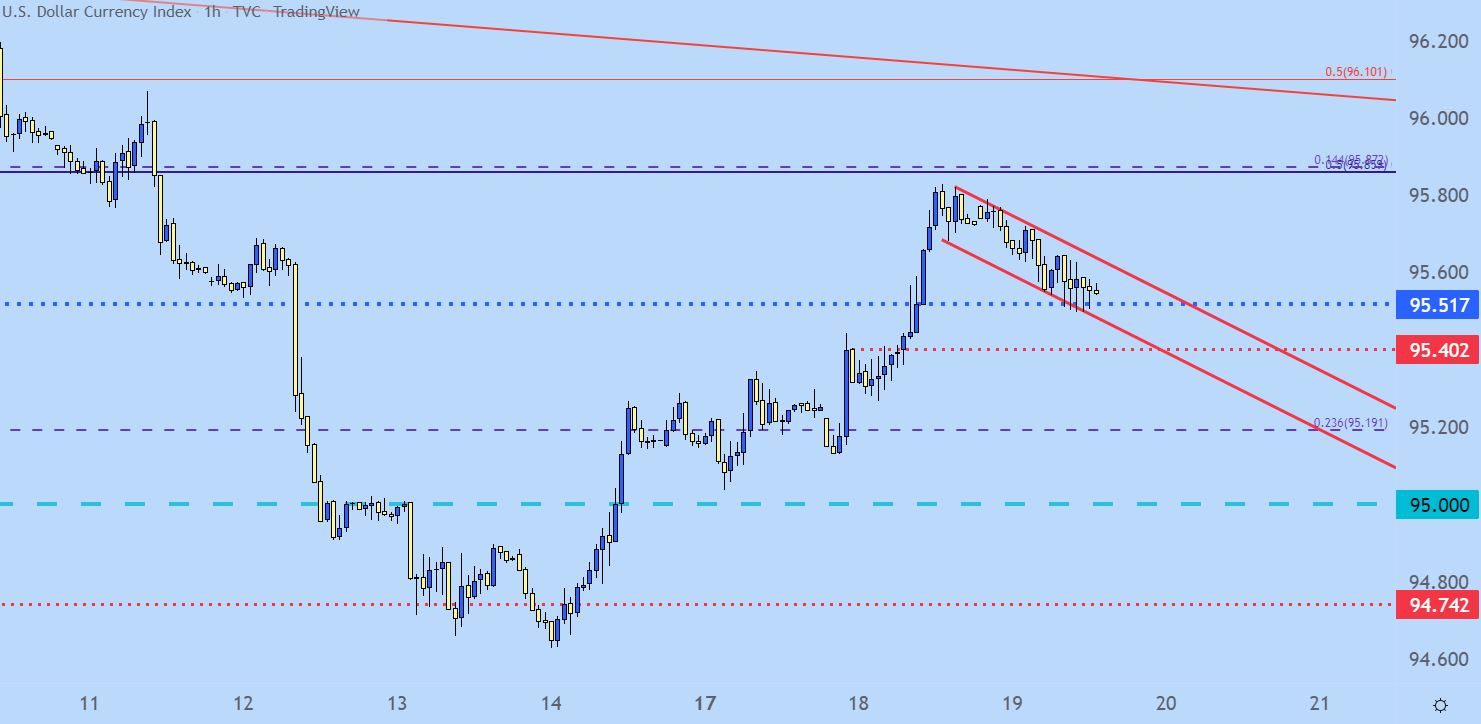
Chart prepared by James Stanley; USD, DXY on Tradingview
EUR/USD
Going along with that setup in the US Dollar last week was the mirror image in EUR/USD, as the pair had built-in an ascending triangle formation that’ll often be approached with the aim of bullish breakouts.
That breakout hit and prices immediately ran to the next zone of resistance, spanning from 1.1448-1.1500. And, as looked at in the aftermath, sellers took their swing, helping to push prices back down towards the 1.1300 handle.
This can be a difficult scenario to sell at the moment, but another test around the 1.1374 level, provided that resistance shows at or around that level, could re-open the door for sellers.
Alternative, on the downside of recent price action, a break of support at 1.1272 re-opens the door for a test of the big zone, spanning from the same 1.1187-1.1212 warned of in late-November that continues to hold the yearly low.
EUR/USD Four-Hour Price Chart
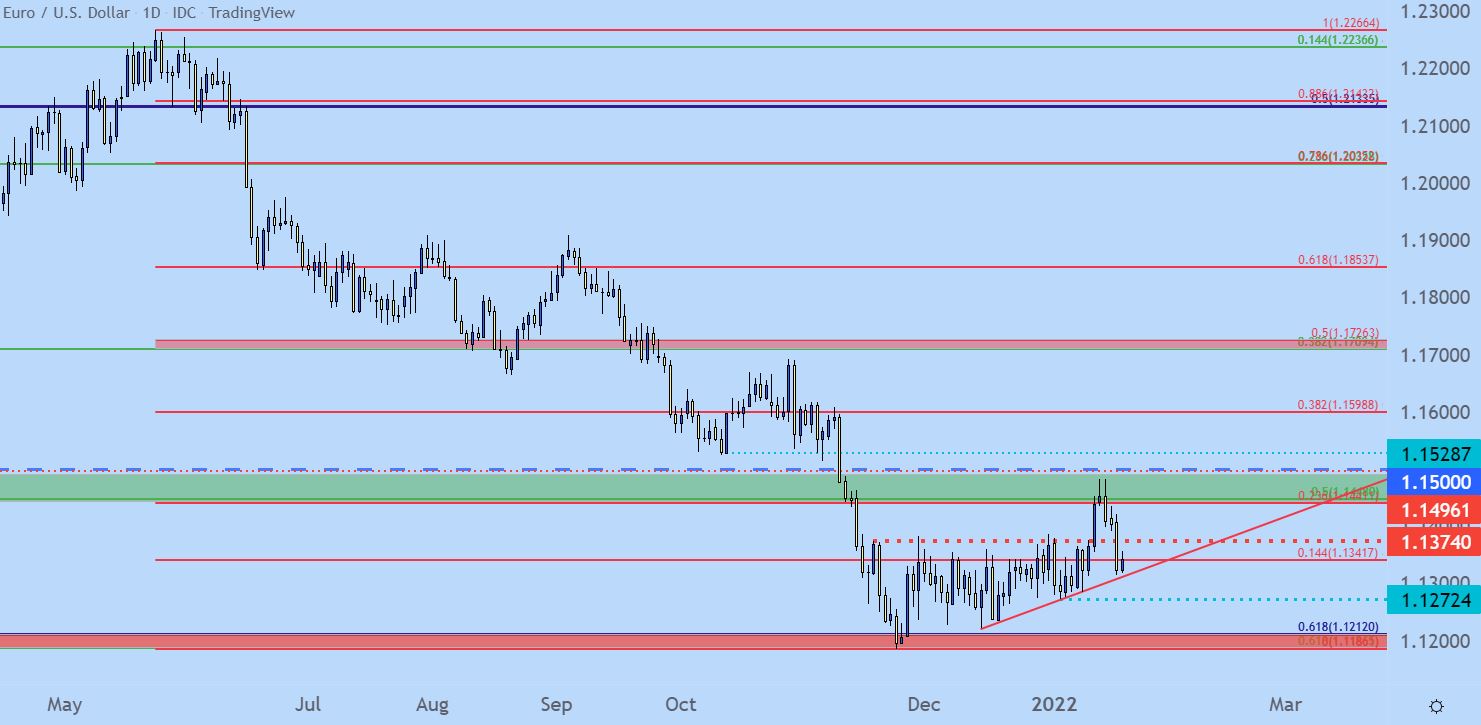
Chart prepared by James Stanley; EURUSD on Tradingview
GBP/USD: Support Hold at Bull Flag Resistance
On the short-side of the US Dollar, GBP/USD remains of interest. Last week’s bearish break in the USD helped GBP/USD to ascend to fresh two-month-highs, resolving a major spot of confluent resistance along the way.
That resistance remains pertinent, as it’s come in as support this morning. The 23.6% Fibonacci retracement of the 2020-2021 major move resides at 1.3581, which is confluent with the resistance side of the bull flag formation that was broken last week. This can keep the door open for topside scenarios.
GBP/USD Daily Price Chart
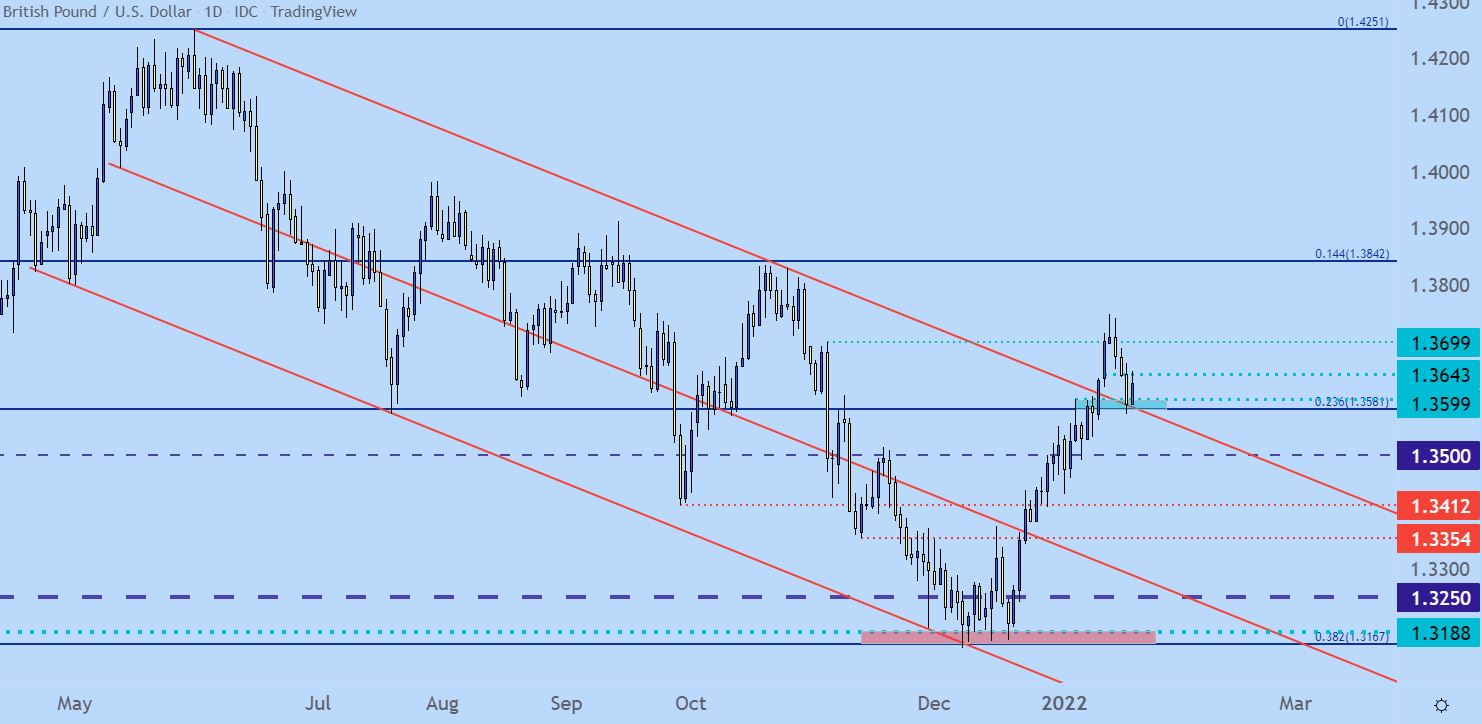
Chart prepared by James Stanley; GBPUSD on Tradingview
USD/CAD Bounce from Lows After Canadian CPI
This morning brought the release of CPI out of Canada for the month of December and, while elevated, this printed right at the expectation which helped CAD to pull back after a recent string of gains.
Higher oil prices have undoubtably helped along the way, and the pair put in an aggressive sell-off last week on the back of that USD move. But, at this point there may be a growing case for a pullback considering how oversold the pair became. RSI divergence continues to show on the four-hour chart as price battles the 1.2500 psychological level.
There’s a major zone sitting overhead, an area that was support for the first couple of weeks of the New Year after playing a large role in 2021 price action. This runs from 1.2622-1.2672, and this could serve as topside resistance targets, which may re-open the door for bearish strategies should it come into play in short order.
USD/CAD Four-Hour Price Chart
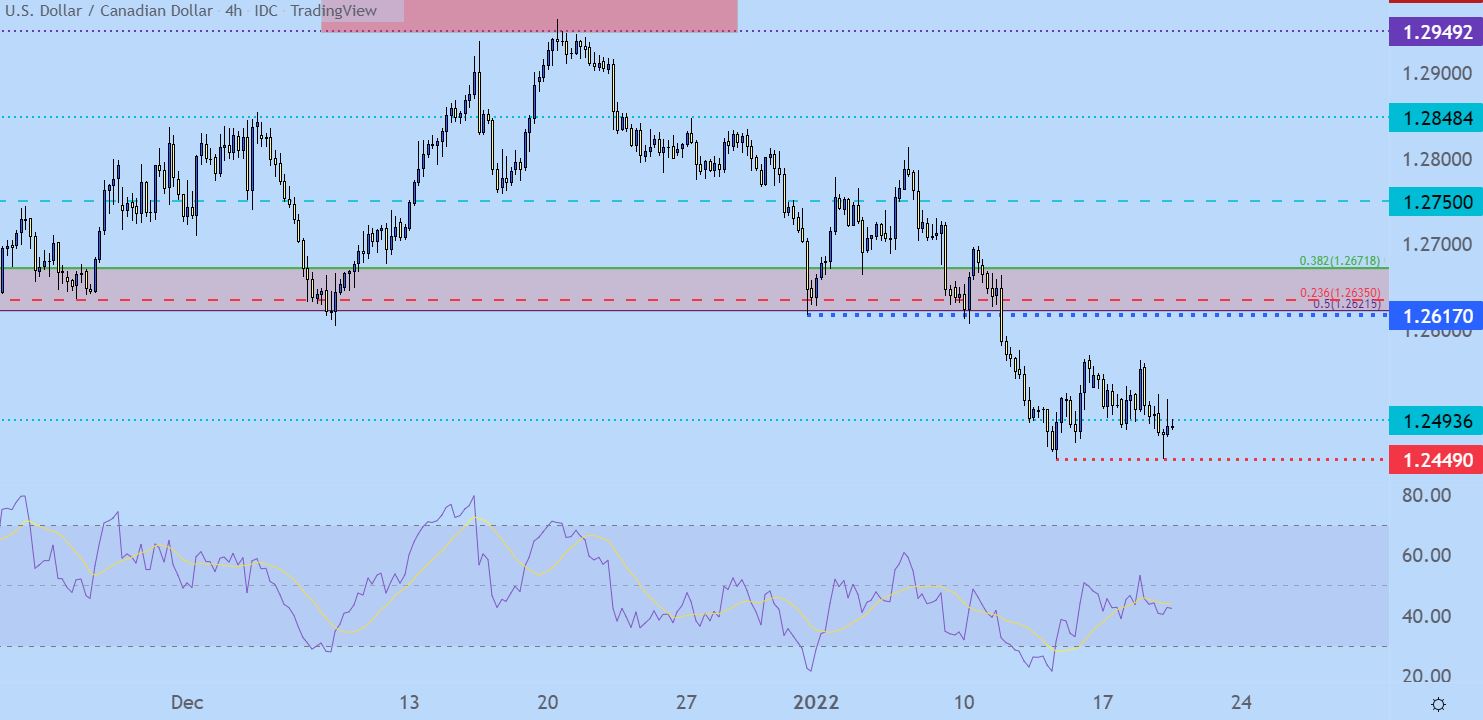
Chart prepared by James Stanley; USDCAD on Tradingview
USD/JPY
Rates continue to run and late last week some speculation began to show up that the Bank of Japan might be similarly looking to shift into a more-hawkish position. That led into this week’s BoJ, at which the bank did adjust inflation forecasts but seemingly tried to rule out the prospect of near-term hikes. From a near-term look, there’s not much of a discernible trend to work with, as last week’s sell-off quickly snapped back and we’re sitting in the approximate mid-point of that range.
Taking a step back, however, does highlight a scenario of possible interest. I had highlighted a rising wedge formation in the pair last week. Such rising wedge formations are often followed with the aim of bearish breakouts, which is what began to show last week.
The corresponding pullback so far this week ran into resistance at the psychological level, and the daily bar is currently working on an evening star formation – which is usually approached with the aim of bearish reversals.
This can keep the focus on bearish scenarios in USD/JPY until that 115 level is traded through.
USD/JPY Daily Price Chart
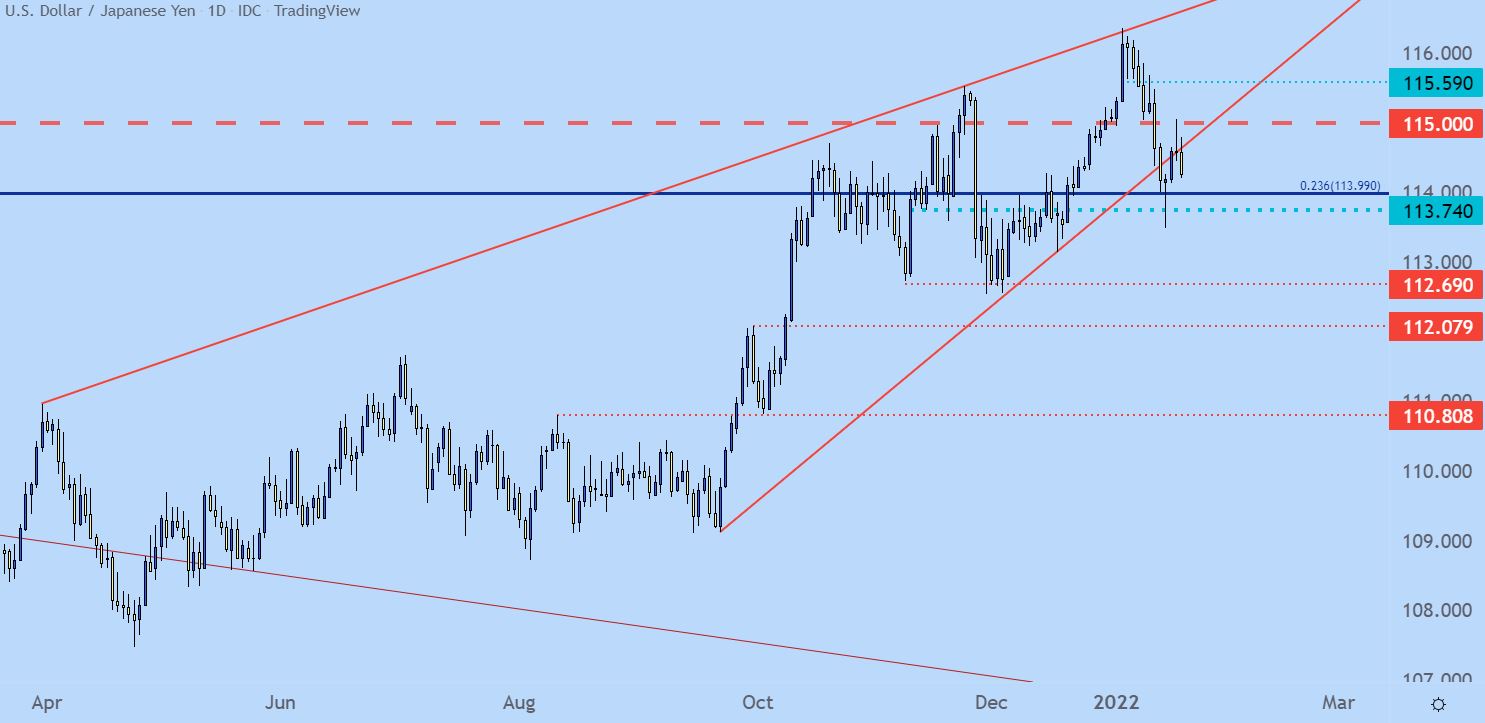
Chart prepared by James Stanley; USDJPY on Tradingview
— Written by James Stanley, Senior Strategist for DailyFX.com
Contact and follow James on Twitter: @JStanleyFX
Buka akaun dagangan patuh syariah anda di Weltrade.
Source link