
US Dollar, Treasury Yields, Fed, USD/JPY, ASX 200, NIKKEI 225, CSI 300 – Talking Points
- US Dollar gains traction as the market eyes the Fed’s hiking timeline
- APAC equities were mixed, with China specific news weighing the CSI 300
- USD/JPY broke key resistance.Will the US Dollar index (DXY) do the same?
The US Dollar continued higher in Asia today after kicking off the new year with a strong rally from the open in New York.
It was underpinned by US Treasury yields, with the benchmark 10-year bond leaping from 1.5% to trade above 1.63%. Expectations of further hikes from the Federal Reserve fuelled the surge in interest rates across the curve.
While risk sentiment was positive, the growth and commodity linked currencies of AUD, CAD, NOK and NZD all got hit in the North American session but have managed to recover some ground today.
The yield sensitive USD/JPY made a 4-year high, breaking above the November peak of 115.52. Gold and silver were pummelled in the US Dollar melee, but crude oil was steady for the most part, trading above USD 76 a barrel.
Australia’s ASX 200 and Japan’s Nikkei 225 went higher today, following on from a positive start to the year from Wall Street overnight. Both bourses were up over 1.8% during the day.
Going in the other direction, Hong Kong and Chinese mainland indices were lower as the Peoples Bank of China (PBOC) didn’t add as much liquidity as expected.
Additionally, the renewable sector was rattled by a Chinese governmentannouncement that they will be removing the subsidy for new energy vehicles after 2023.
The benchmark CSI 300 was down over 1.3% at one stage but managed to claw back some of the losses in afternoon trade.
In the US later today, the ISM manufacturing survey is due for release as well as the Canadian manufacturing PMI.
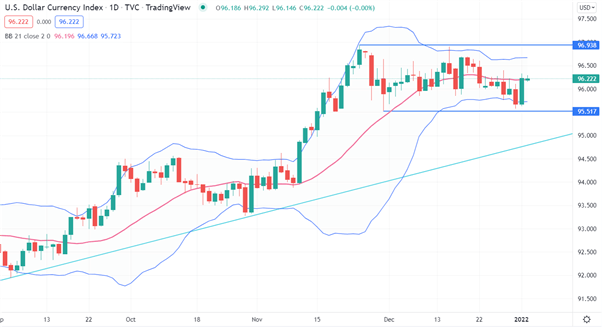
US Dollar index (DXY) Technical Analysis
The US Dollar index (DXY) rejected a move toward the recent low of 95.517 and this level may continue to provide support.
An ascending trendline that currently intersects just below 95.00 might also provide support, as well as the pivot point at 94.561 or previous lows at 93.278 and 91.947.
The 0.58% rally in the US session has seen it bump against the 21-day simple moving average (SMA) and a decisive break above it could see near term bullish momentum evolve.
Potential resistance may lie at the recent highs of 96.906 and 96.938.
Despite the significant move, volatility remains subdued, as shown by the relative narrowness of the 21-day SMA based Bollinger Band.
— Written by Daniel McCarthy, Strategist for DailyFX.com
To contact Daniel, use the comments section below or @DanMcCathyFX on Twitter
Buka akaun dagangan patuh syariah anda di Weltrade.
Source link