The pair will likely keep falling as bears target the 50% retracement level at 1.3500.
Bearish View
- Sell the GBP/USD and set a take-profit at 1.3500.
- Add a stop-loss at 1.3650.
- Timeline: 1-2 days.
Bullish View
- Set a buy-stop at 1.3600 and a take-profit at 1.3680.
- Add a stop-loss at 1.3540.
The GBP/USD has been under intense pressure in the past few days. It has declined in the past three consecutive days. It is trading at 1.3580, which is about 1.25% below the highest level last week. The current price is the lowest level since December 11.
UK Economic Data
The Office of National Statistics (ONS) published the latest jobs numbers on Tuesday. The data revealed that the unemployment rate declined from 4.2% in October to 4.1% in November. This decline was better than the median estimate of 4.2%.
Additional data revealed that the number of claimant count declined to over 43.3k in December. The country’s claimant count has been in a downward trend in the past few months.
Focus now shifts to the upcoming UK consumer price index (CPI) data that will come out in the morning session. Economists polled by Reuters expect the data to reveal that the headline CPI dropped from 0.7% in November to 0.3% in December.
On a year-on-year basis, the CPI is expected to have risen from 5.1% to 5.2%, which is significantly above the Bank of England (BOE) target of 2.0%.
Meanwhile, economists expect the numbers to show that the core CPI declined from 0.5% to 0.2%. On an annualized basis, analysts expect the data to reveal that the data fell from 4.0% to 3.9%.
If analysts are correct, these numbers will send a signal that the country’s inflation has topped. However, with oil and natural gas prices surging, there is a likelihood that prices will remain at elevated levels.
The GBP/USD pair also declined after the US bond yields surged. The 10-year bond yield rose a two-year high of 1.85% while the 30-year yield rose to 2.17%.
GBP/USD Forecast
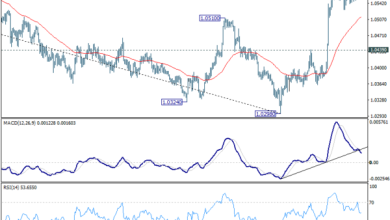
On the four-hour chart, the GBP/USD pair reached a top at 1.3745 last week. Since then, the price has managed to make a bearish trend and is trading at 1.3580. The pair has even crossed the 25-day and 50-day exponential moving averages.
It has also moved to the lower side of the Bollinger Bands while the Relative Strength Index (RSI) has been in a downward trend. The pair also dropped to the 61.8% Fibonacci retracement level. Therefore, the pair will likely keep falling as bears target the 50% retracement level at 1.3500.

Source link