The coin will likely remain in this range for a while as investors wait for a catalyst.
Bullish View
- Buy Shiba Inu and set a take-profit at $0.00003.
- Add a stop-loss at $0.000025.
- Timeline: 1-3 days.
Bearish View
- Set a sell-stop at $0.000025 and a take-profit at $0.000020.
- Add a stop-loss at $0.000030.
The Shiba Inu price has moved sideways this week. The SHIB/USD pair is trading at $0.000027, where it has been in the past few days. This price is about 15% below the highest point last week.

Shiba Inu Waits for a Catalyst
Shiba Inu is one of the most popular cryptocurrencies in the world. It dominates mentions in social media platforms like Reddit and Twitter. Also, it is the most searched coin in web platforms like CoinMarketCap and CoinGecko.
However, despite the popularity, the coin has struggled in the past few months. Its price has dropped by almost 70% from its all-time high, bringing its market cap to over $15 billion. This makes it one of the most popular coins in the world.
The sluggish performance has led to a significantly low volume traded. For example, according to Coinbase, Shiba Inu worth about $533 million was traded in the past 24 hours. That was a 33% decline from the previous period.
Some analysts cite this performance to the fact that SHIB is not yet available in Robinhood Markets. Thousands of the company’s customers have asked the company to add it. However, earlier this week, the company’s CEO said that they were waiting for more regulatory clarity before adding it to the marketplace.
Another reason why the Shiba Inu price has retreated recently is that there have been no major catalyst. For example, it was rarely mentioned in the recent North America Bitcoin Conference.
Investors are also deeply concerned about the Federal Reserve. The bank has said that it will start hiking interest rates later this year. Therefore, investors are concerned that most cryptocurrencies will lag the overall market at a time when the Fed is tightening. This also explains why the Nasdaq 100 index has moved to a correction zone.
SHIB/USD Forecast
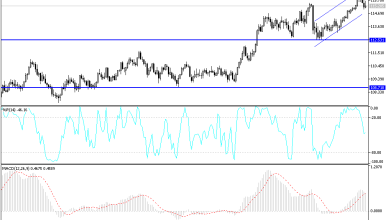
The four-hour chart shows that the SHIB/USD pair has been in a strong bearish trend in the past few months. It has formed a descending channel pattern. On the daily chart, this channel has a close resemblance to a falling wedge pattern. The SHIB price is along the upper side of this pattern. It is also along the 25-day moving average.
Therefore, the coin will likely remain in this range for a while as investors wait for a catalyst. A move above the upper side of the channel will be a bullish signal. The other scenario is where the coin drops and retests the lower side of the channel.

Source link