
Data Source: Board of Governors of the Federal Reserve System (Fed), Chart by Mish
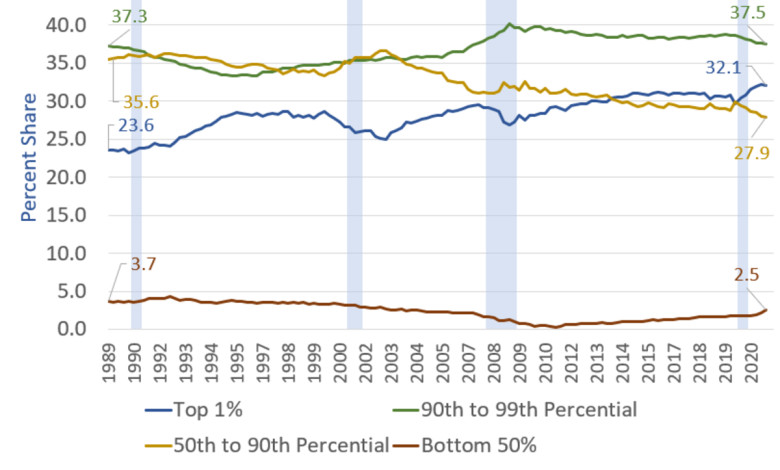
This data series compiled by the Fed started in the third quarter of 1989. The most recent data is from the third quarter of 2021.
If you have not seen charts of this series before, the numbers may seem shocking.
1989 Q3 vs 2021 Q3 Percentages
- Top 1% Then 23.6%, Now 32.1%
- 90th to 99th Percentile Then 37.3%, Now 37.5%
- 50th to 90th Percentile Then 35.6%, Now 27.9%
- Bottom 50% Then 3.7%, Now 2.5%
Gains or Losses Since 1989
- Top 1%: +8.5 Percentage Points
- 90th to 99th Percentile: +0.2 Percentage Points
- 50th to 90th Percentile: -7.7 Percentage Points
- Bottom 50%: -1.2 Percentage Points
Key Points
- The bottom never had much to lose but they managed to lose a bit anyway.
- The top keep padding their wealth but remain the most impacted by recessions.
- The middle class is shrinking.
Credit and Blame
Many people will blame the wealthy. But the actual culprit is the Fed.
The bottom 50% sure don’t gain from bubbles.
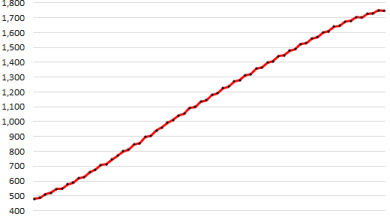
Those with assets are the beneficiaries. And when the Fed steps on the gas, look at the far right of the chart to see what happens.
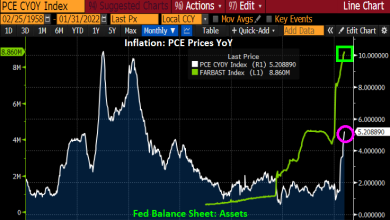
Beneficiary of Inflation
Inflation benefits those with first access to money and that’s the banks and the already wealthy.
The poor who spend every penny and them some on food and shelter get hammered by inflation.
Meanwhile, the middle class keeps shrinking.
CPI Jumps Most in 40 Years
The Fed tried for a decade to increase inflation. The Fed even wanted to “make up” for lack of previous inflation.
But the CPI rose another 0.6% in January, at a year-over-year clip of 7.5%. The CPI is at the highest pace in 40 years.
For discussion, please see CPI Jumps Most Since February 1982, Up at Least 0.5% 9 Out of Eleven Months
The Fed finally succeeded and then some at producing inflation. Now doesn’t know what to do about it.
But should the banks get in trouble again, the Fed will be right there again to bail them out just as it did in 2000 in the dotcom bust and again in the 2007-2009 housing crash.
This post originated at MishTalk.Com.
Thanks for Tuning In!
Please Subscribe to MishTalk Email Alerts.
Subscribers get an email alert of each post as they happen. Read the ones you like and you can unsubscribe at any time.
If you have subscribed and do not get email alerts, please check your spam folder.
Mish
Source link