

Price inflation has been even worse than advertised.
Of course, you know that because you’ve lived it. But it is nice when the data crunchers swerve a little closer to reality.
The Bureau of Economic Analysis did just that, revising its Personal Consumption Expenditure (PCE) data higher for the entirety of this inflation cycle.
The PCE is used in the bureau’s GDP calculations. It’s also the Federal Reserve’s favorite inflation measure. This is likely because its formula understates price inflation even more than the Consumer Price Index (CPI).
I always emphasize that inflation is worse than the government data suggest. The CPI uses a formula that understates the actual rise in prices. Based on the formula used in the 1970s, CPI is closer to double the official numbers.
The PCE also understates price inflation, and to a larger degree than the CPI.
Now, government number crunchers have quietly gone back and revised past PCE data, telling us that price inflation was worse than the numbers initially reflected.
This revision thing seems to be happening a lot lately.
Government agencies release a bunch of data. The mainstream press and politicians cheer about how great it is. A few months later, the government number crunchers quietly revise it downward. Of course, revisions don’t make headlines. So, people are left believing things are way better than they are.
We see this happen month after month with the non-farm payroll report. They keep screaming about how many jobs the economy is creating. But did you know they have revised the numbers downward for every month this year?
Now they’ve done the same with the PCE data.
A cynical person might think the government is gaslighting us.
Here are a few examples of the recent PCE revisions.
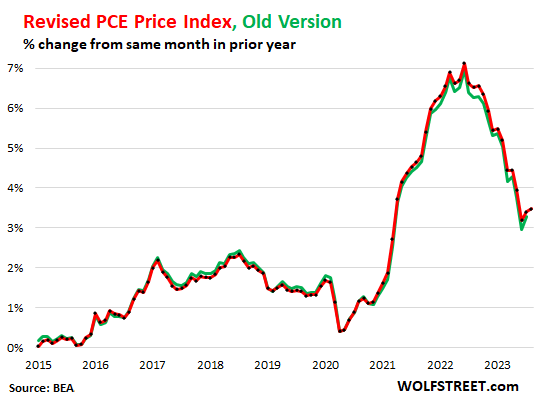
Most recently, July’s PCE price index was bumped up from 3.3% to 3.4%. The June PCE price index increased from 3.0% to 3.2%.
The Peak PCE price index in June 2022 was revised to 7.12% from 6.98%. (Notice how much lower these numbers are than the 9%-plus we got from the CPI formula. This is why the Fed likes it.)
This chart courtesy of WolfStreet shows the adjustments over time.
The Bureau of Economic Analysis made similar revisions to core PCE (excluding food and energy prices). In July, it was revised up to 4.3% from 4.2%. The peak core PCE was initially reported as topping out at 5.4% in February 2022. It was revised up to 5.6%.
The Core services PCE Price Index (excluding energy services) was revised substantially higher for the years back through 2020. WolfStreet says this is a crucial metric because it shows where underlying inflation has gotten entrenched. It originally peaked at 5.54% in February 2023. It was revised up to 5.82%. That’s a hefty upward revision!
You may look at these revisions and think, ‘Well, that’s not too significant.’ And maybe they aren’t in the big scheme of things. But it should still give you pause. It should make you even more skeptical of these government numbers. You can’t help by notice that all of the initial data works in favor of official narratives that things aren’t so bad. And all of the revisions reveal that things were worse than advertised.
And of course, the reality is always worse than advertised when it comes to government numbers.

Get Peter Schiff’s most important gold headlines once per week – click here – for a free subscription to his exclusive weekly email updates.
Interested in learning how to buy gold and buy silver?
Call 1-888-GOLD-160 and speak with a Precious Metals Specialist today!
Buka akaun dagangan patuh syariah anda di Weltrade.
Source link