
It’s always good to have regular validation about decisions we choose to make. Take the decision to buy gold, for example. At the moment central bankers and economists just can’t help themselves but make statements or hold press conferences or publish papers that effectively say to gold investors ‘KEEP GOING!’. Whether it is Andrew Bailey at the Bank of England on Tuesday this week, or now Ben Bernanke and Olivier Blanchard in a 49 page report – they are all at it.
A regular economist will know tomorrow why things she or he predicted yesterday didn’t happen. Central bank economists will know sometime next year! This week we discuss a paper by two well known central bank economists on What caused post-pandemic inflation?
What Caused the U.S. Pandemic-Era Inflation?
Former Chair of the U.S. Federal Reserve Ben Bernanke and former Chief Economist of the IMF Olivier Blanchard, say they know the answer.
In a paper published this week titled What Caused the U.S. Pandemic-Era Inflation? the two economists boil it down to:
We find that, contrary to early concerns that inflation would be spurred by overheated labor markets, most of the inflation surge that began in 2021 was the result of shocks to prices given wages, including sharp increases in commodity prices and sectoral shortages.
However, although tight labor markets have thus far not been the primary driver of inflation, the effects of overheated labor markets on nominal wage growth and inflation are more persistent than the effects of product-market shocks. Controlling inflation will thus ultimately require achieving a better balance between labor demand and labor supply.
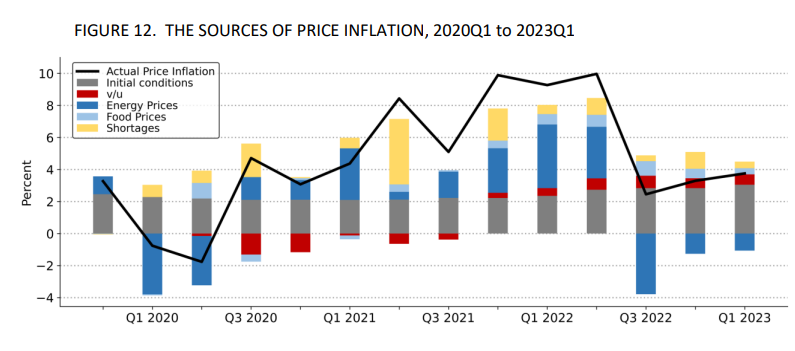
The chart below from the Bernanke and Blanchard publication shows which factors were dominant in increasing inflation.
To determine the contribution of each factor Bernanke and Blanchard built a model analyzing inflation as a function of various variables, such as the supply demand in the labor market (job vacancies to unemployed workers; red bars), commodity price increases (blue bars), and supply chain disruptions (which they derived from Google searches for shortages, yellow bars).
The grey bars (initial conditions) represent the estimate of what inflation would have been if the same conditions existed after the pandemic that existed before the pandemic.
In other words, it was the supply shortages (computer chips, diapers, gas, cars, truck drivers, etc.) and the rise in commodity prices (wheat, corn, and meat prices all rose double digits) that caused the inflation, but it is the short supply of labour pushing wages higher that is keeping inflation persistently high. The way to get inflation growth lower; the historical way to achieve better balance between labour demand and labour supply has been to decrease the demand for labour through recession.
The reason given for the overheated labour markets is the massive amount of fiscal stimulus. The U.S. alone added US$5 trillion in fiscal stimulus: US$2.2 trillion from the CARES Act in March 2020 with an additional US$2.8 trillion in March 2021 from the covid relief (US$900 billion) and the American Rescue Plan (US$1.9 trillion). And it wasn’t only the U.S. adding massive amounts of fiscal stimulus. Global fiscal stimulus totals in 2020-21 are upward of US$20 trillion.
It is true that some of the $20 trillion offset the loss due to the covid lockdowns, however as economies reopened stimulus continued to flow.
Most governments don’t have an ‘extra’ $20 trillion to give out in stimulus, so they borrow it, and it was largely central banks that bought this debt – through quantitative easing programs. Central banks first cut interest rates to zero to make borrowing cheaper, they then fired up the money printing presses to purchase the debt!
This increases the monetary base for the economy – which through lending banks create the money supply.
This in turn increased the money supply rapidly, the U.S. M2 money supply (M2 is a measure of the money supply that includes all currency in people’s pockets, chequing, savings, and short-term time deposit accounts) rose by more than 40% from the beginning of 2020 to its peak in March 2022. Again, not only the U.S. but in many countries. The UK M2 money supply rose more than 30% for example.
This created the perfect environment for inflation to flourish – too much money chasing too few goods.
Through late 2021 it was supply shortages exacerbated by increased demand from stimulus spending and the rise in commodity prices (namely energy prices) that drove inflation higher. Once stimulus was cut or eliminated inflation should have also come down.
Bernanke and Blanchard say that the reason this did not happen is that by the time stimulus ended strong demand and the massiveness of the fiscal stimulus (aided by central banks) meant the labour market was overheated – which lifted wage expectations, this was compounded by workers leaving the labour force and employers having to find new workers after the pandemic due to layoffs during the pandemic.
The conclusion of the paper is that for inflation to decline that the labour market has to cool off. The author’s estimation would mean that the U.S. unemployment rate would need to increase to 4.3% from the current 3.4% and/or hiring returns to pre-pandemic norms (less job openings).
The question that remains to be answered is whether the labour market can be cooled without a recession – we think it is unlikely, especially given the emerging banking problems, commercial real estate issues, and defunct Congress that can’t come to an agreement on raising the debt ceiling for spending they already agreed to! Our last word goes to a headline from Market Watch this week from a JPMorgan analyst: Investors should put more money in gold and cash as rally in stocks won’t last!
Our CEO Stephen Flood recently spoke to the financial literacy podcast Money Vision U. In part one of the interview Stephen and host Stuart Berryhill discuss the macroeconomic reasons to own gold and why physical gold is a must for your financial portfolio. Whether you’re new to gold investment or always looking to introduce people to the concept of protecting your savings with gold, then this is a great listen.
From The Trading Desk
Market Update:
As the market waits for the most anticipated US recession in history but with good reason too.
We have had a record pace of interest rate hikes, stubbornly high inflation, an inverted yield curve, and add to the mix the banking crisis over the last couple of months.
The New York Fed recession probability indicator suggests there is a 68.2% chance of a recession sometime within the next 12 months, the highest reading in four decades.
Last week we got to see the impact stubbornly high inflation is having on Americans as they use credit card debt to offset their shrinking purchasing power.
Credit card debt is close to $1 Trillion an increase of 17% from last year, with some turning to credit cards to help pay their mortgages!
We have the next Fed meeting which takes place on June 14th but the CPI data release on the 13th of June will be the one to watch, with some commentators expecting a large drop.
Will a much lower CPI print lead to a hold on rate increases and lower rates by year-end that the market is pricing in?
Stock Update
Silver Britannia’s– We have a limited number of Silver Britannia’s from the Royal Mint, with the lowest premium in the market at spot plus 40% for EU storage/delivery and for UK storage/delivery.
Please call our trading desk. Stock is limited at this reduced premium.
Gold 1oz Bars and Coins – GoldCore have excellent stock and availability on all Gold Coins and bars. Please contact our trading desk with any questions you may have.
GOLD PRICES ( AM/ PM LBMA FIX– USD, GBP & EUR )
| USD $ AM |
USD $ PM |
GBP £ AM |
GBP £ PM |
EUR € AM |
EUR € PM |
|
|---|---|---|---|---|---|---|
| 23-05-2023 | 1959.65 | 1969.20 | 1581.05 | 1585.99 | 1815.81 | 1826.24 |
| 22-05-2023 | 1981.20 | 1970.30 | 1591.70 | 1585.30 | 1831.22 | 1822.92 |
| 19-05-2023 | 1965.55 | 1961.60 | 1582.86 | 1577.52 | 1821.48 | 1817.42 |
| 18-05-2023 | 1976.95 | 1960.30 | 1589.86 | 1577.85 | 1828.09 | 1818.37 |
| 17-05-2023 | 1985.75 | 1974.40 | 1597.73 | 1586.04 | 1834.04 | 1825.93 |
| 16-05-2023 | 2009.90 | 2007.45 | 1602.49 | 1604.15 | 1843.88 | 1846.05 |
| 15-05-2023 | 2015.30 | 2019.90 | 1614.46 | 1613.29 | 1855.49 | 1856.49 |
| 12-05-2023 | 2006.65 | 2019.90 | 1601.31 | 1614.10 | 1839.90 | 1854.27 |
| 11-05-2023 | 2025.75 | 2015.95 | 1609.66 | 1611.55 | 1854.17 | 1849.03 |
| 10-05-2023 | 2029.60 | 2037.15 | 1607.65 | 1610.57 | 1852.82 | 1852.99 |
Buy gold coins and bars and store them in the safest vaults in Switzerland, London or Singapore with GoldCore.
Learn why Switzerland remains a safe-haven jurisdiction for owning precious metals. Access Our Most Popular Guide, the Essential Guide to Storing Gold in Switzerland here
Receive Our Award Winning Market Updates In Your Inbox – Sign Up Here
Source link


