

This analysis focuses on gold and silver within the Comex/CME futures exchange. See the article What is the Comex? for more detail. The charts and tables below specifically analyze the physical stock/inventory data at the Comex to show the physical movement of metal into and out of Comex vaults.
Registered = Warrant assigned and can be used for Comex delivery, Eligible = No warrant attached – owner has not made it available for delivery.
Gold
After two months of increasing inventories, the outflows have resumed. So far in June, 300k ounces of gold have left Comex vaults.

Figure: 1 Recent Monthly Stock Change
The daily activity can be seen below. As the June contract was approaching, metal was leaving Registered (metal available for delivery) and moving into Eligible. This is the opposite of what usually occurs before delivery begins. More recently, that metal started to flow out of Eligible with about 400k ounces leaving in the last few days before a small increase.

Figure: 2 Recent Monthly Stock Change
Pledged gold ended up seeing a pretty large uptick on June 6. This was the largest single-day up-move since April 2022.

Figure: 3 Gold Pledged Holdings
Silver
Silver has also seen outflows continue after a brief respite in May. The bleed-out in Registered has continued unabated during that time. Registered supplies are now at the lowest level since 2016 (more on this below).

Figure: 4 Recent Monthly Stock Change
The daily activity in silver has been a bit more volatile than gold. While Eligible continues to move up and down, the Registered activity is mostly sporadic outflows with a few inflows here and there.

Figure: 5 Recent Monthly Stock Change
The table below summarizes the movement activity over several time periods to better demonstrate the magnitude of the current move.
Gold
-
- The change in Eligible and Registered have almost completely negated each other over the last month
-
- 700k out of Registered with 690k into Eligible
-
- The one-year change has been nearly identical in Registered (-5.6M) and Eligible (-5.4M)
- The change in Eligible and Registered have almost completely negated each other over the last month
Silver
-
- Registered silver saw a big move out over the last month, dropping 2.6M and bringing total Registered to 27M ounces
- Eligible silver increased 2.5M ounces over the month but saw a drop in the latest week of almost 2M ounces
- Registered silver has fallen by 81% over the last 3 years (115M ounces)!
Palladium/Platinum
Palladium and platinum are much smaller markets but that may be where the market breaks first.
- Both metals have seen small net outflows over the last month. Platinum is approaching a delivery month that could see activity increase.

Figure: 6 Stock Change Summary
The next table shows the activity by bank/holder. It details the numbers above to see the movement specific to vaults.
Gold
- There was more activity across the banks than the aggregate number suggests
- Malaca has added along with Asahi
- JP Morgan and Brinks were the losers, down 226k and 176k respectively
Silver
- Similar to gold, the activity was up and down across the vaults for the month
- Asahi, the new vault, saw a 1.7M ounce inflow over the month
- JP was the only other bank that added a meaningful amount
- The outflows were spread across CNT, Delaware, Manfra, and HSBC pretty evenly at nearly 1M ounces each
- Only Delaware and Asahi have been net adders over the last year

Figure: 7 Stock Change Detail
Historical Perspective
The recent activity in gold can be put into context by the chart below. Banks did clearly restock last month, but it did little to move the needle or change the trend. The inflows have stopped which means the inflows in May are likely just a slowdown of the general downward trend of inventory.
The Registered as a % of Total line shows that the ratio has returned to the level in March, before the big spike up. It now sits at 52%, which is higher than the average for the past few months, but not meaningfully so.

Figure: 8 Historical Eligible and Registered
Silver is in a different boat as Registered supplies continue to get depleted. The ratio now sits at 10% which is the lowest on record.
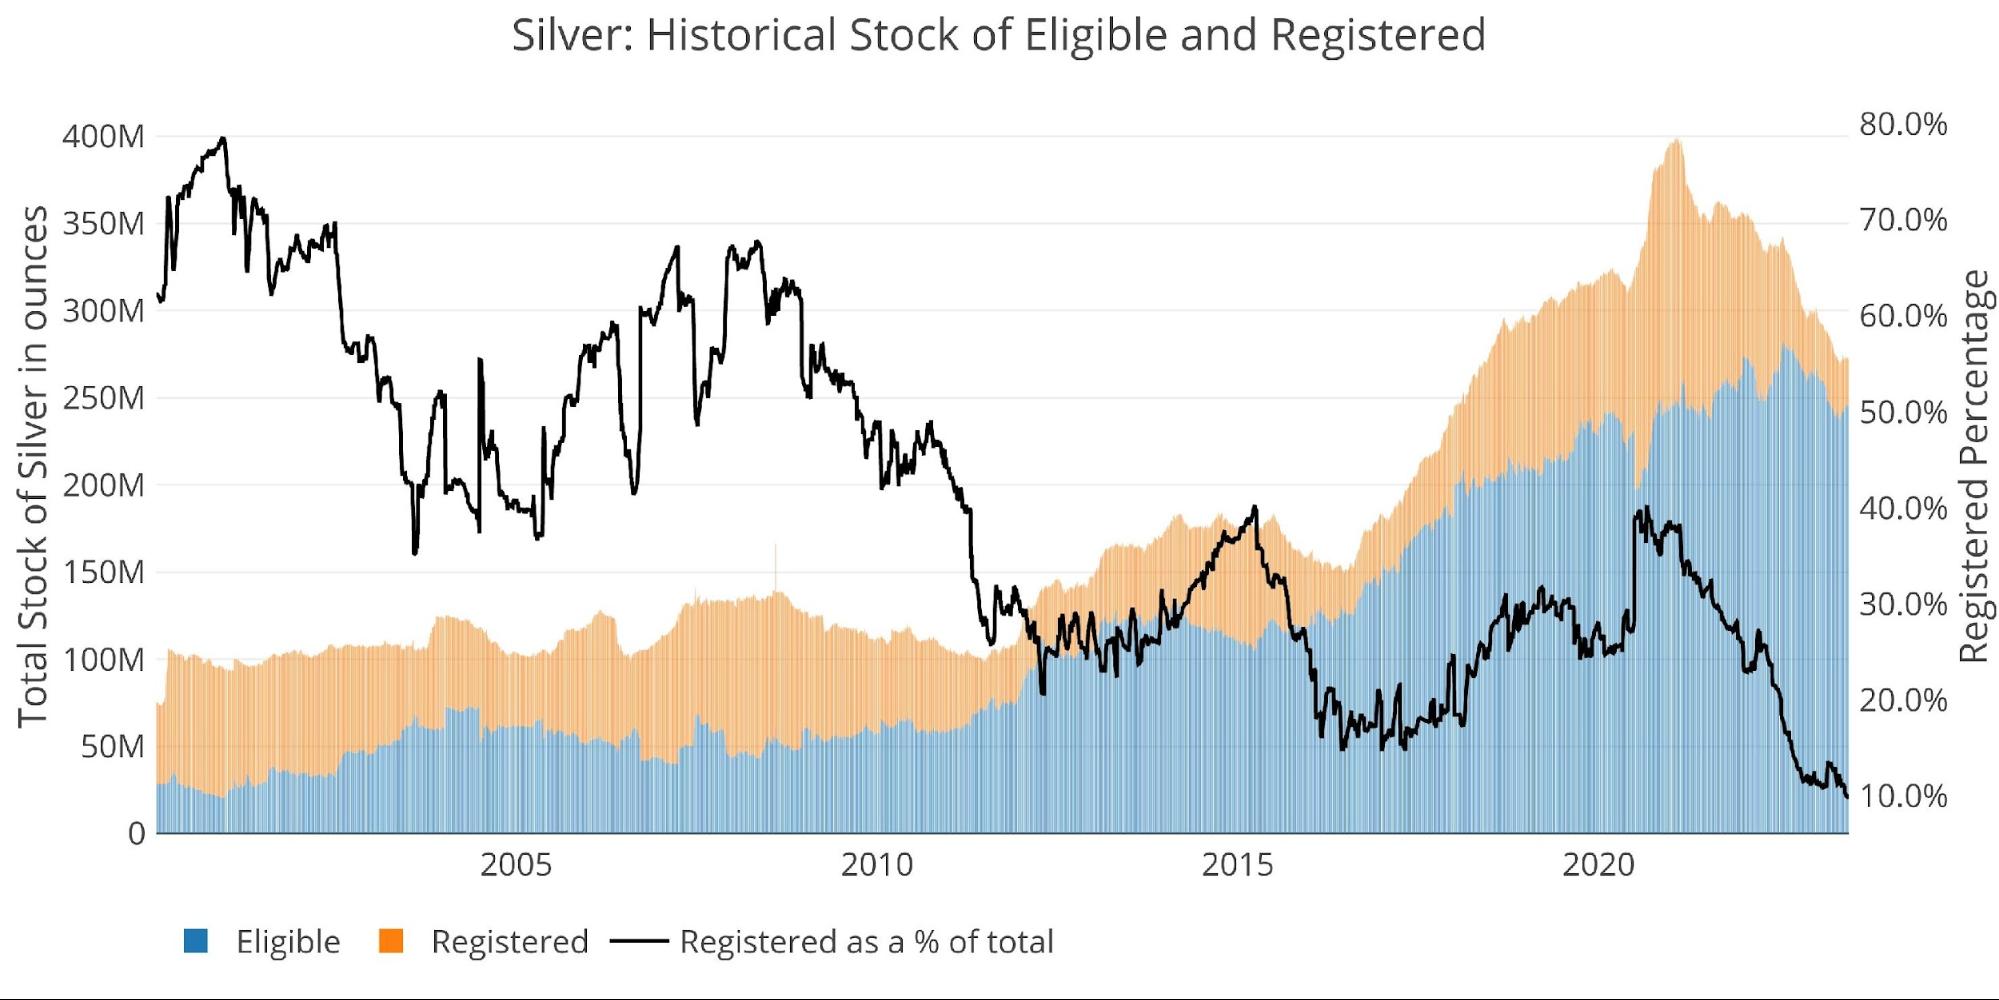
Figure: 9 Historical Eligible and Registered
Below shows just the Registered component. The drawdown over the last few years is very clear in this chart. There was then a pause from November to February before a slight uptick. That uptick has now more than reversed, bringing the total Registered supply to 27.1M ounces.

Figure: 10 Historical Registered
The LBMA has been steadier in recent months after seeing similar outflows last year.

Figure: 11 LBMA Holdings of Silver
Available supply for potential demand
Before the recent sell-off in gold, open interest reached 536k contracts on May 15th. This means there were 4.3 paper contracts for each ounce of Registered gold at the Comex. The drop in Open Interest to 431k has brought the ratio down to 3.6. This is still fairly high relative to recent history and could go much higher if the speculative traders started diving back into gold, driving up open interest.

Figure: 12 Open Interest/Stock Ratio
Coverage in Registered silver is far worse than gold and has reached a new high for the move. There are now 28 paper ounces for each physical ounce of silver available for delivery at the Comex. This means if 3.5% of paper contracts stand for delivery, the Comex will not have enough silver to meet demand.

Figure: 13 Open Interest/Stock Ratio
Wrapping Up
The banks restocked in May, but that momentum has already faded. The outflows of metal have resumed bringing Registered silver to new lows and depleting the overall gold supply.
Whoever is draining the Comex is not trying to make a scene. They are slowly but surely scooping up physical metal without causing a scene or pushing up prices. As the drainage in supplies continues, the price will be forced to respond. Silver Registered supplies are down over 80% in three years. At the current pace, all supplies will be exhausted by the end of the year or the beginning of next at the latest.
When the recession sets in, there could be a flight into safety with people naturally wanting physical. This will be like a game of musical chairs where there are 30 people per chair. It won’t be pretty.
Data Source: https://www.cmegroup.com/
Data Updated: Daily around 3 PM Eastern
Last Updated: Jun 20, 2023
Gold and Silver interactive charts and graphs can always be found on the Exploring Finance dashboard: https://exploringfinance.shinyapps.io/goldsilver/

Call 1-888-GOLD-160 and speak with a Precious Metals Specialist today!
Buka akaun dagangan patuh syariah anda di Weltrade.
Source link