The BLS reported that 256k jobs were added in April with major revisions down in previous months. The Household Survey reported only 139k jobs in April, the lowest amount since November last year.
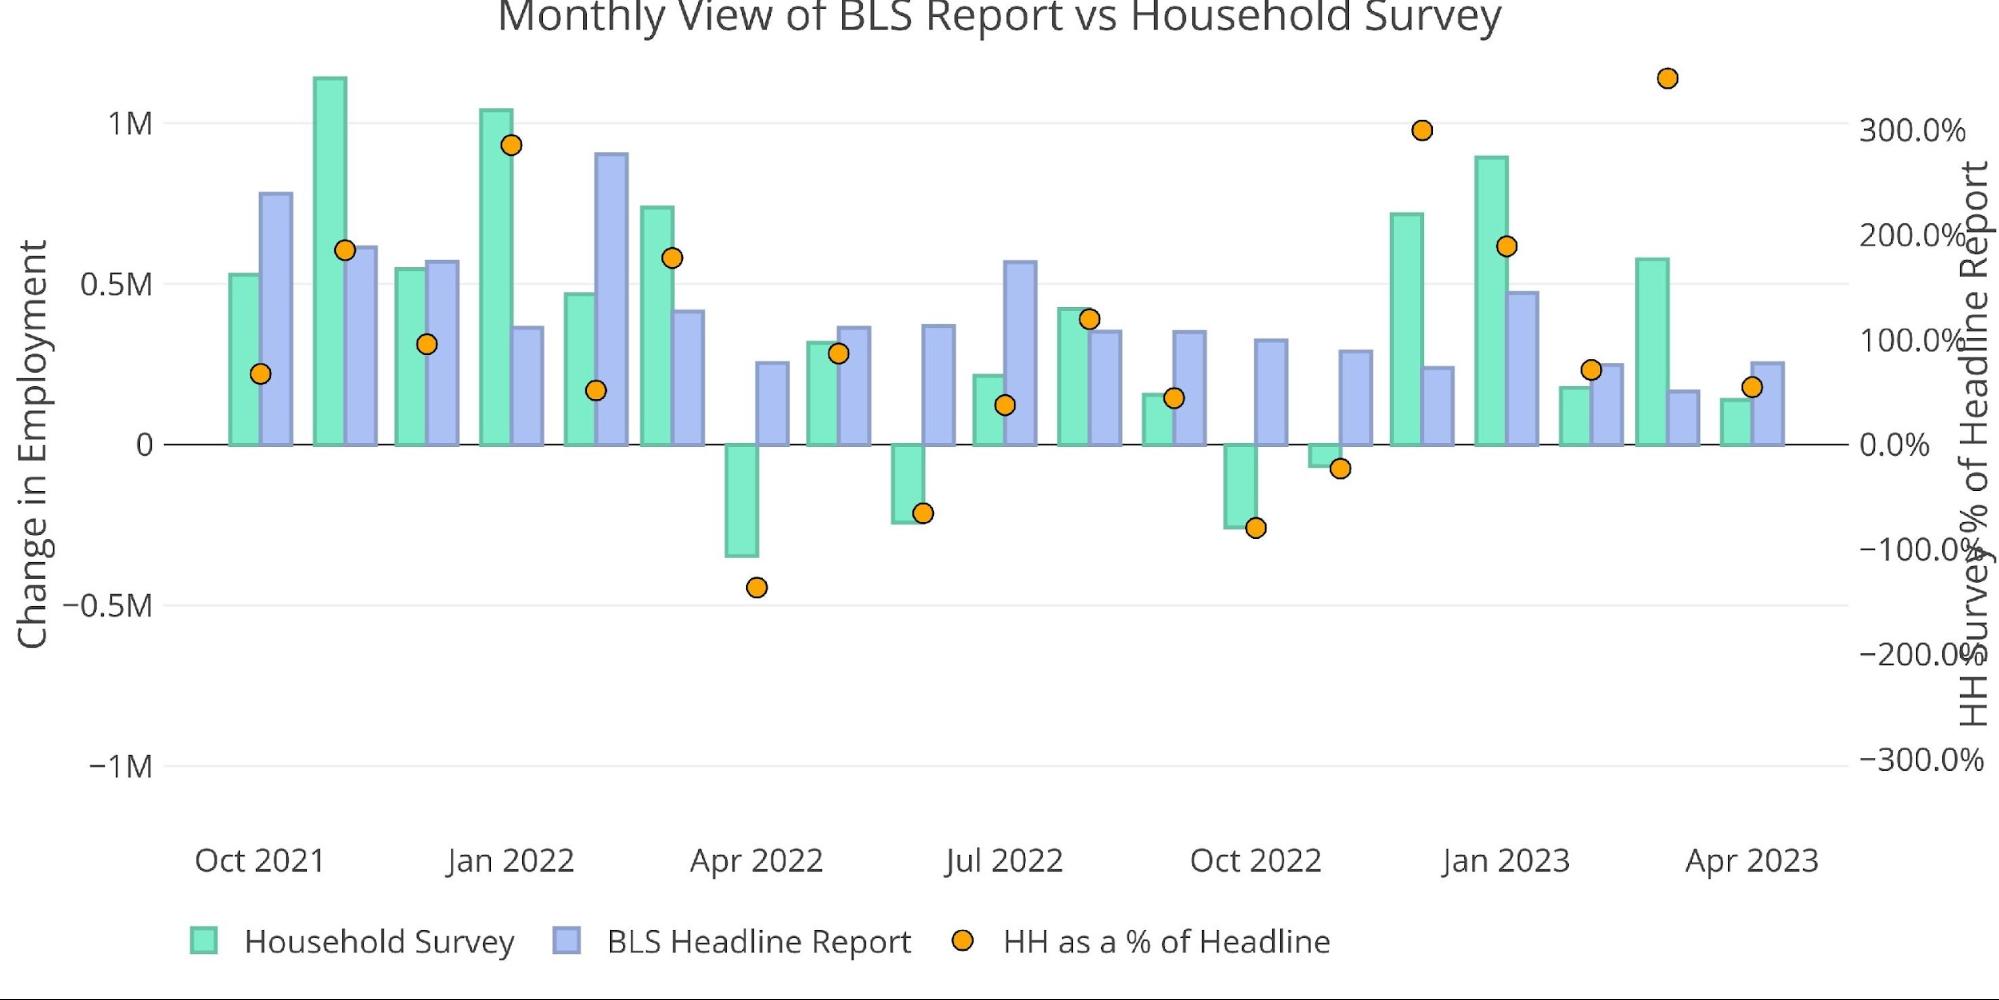
Figure: 1 Primary Report vs Household Survey – Monthly
Despite the smaller figure in April, the Household Survey is actually exceeding the Headline Report by the largest margin ever YTD. As of April, total jobs as reported by the Household Survey is 57% greater than the Headline Report. The next largest year was in 2018, when the Household Survey was greater by 27.5%.
The BLS also publishes the data behind their Birth/Death assumptions. These are the jobs that the BLS assumes based on companies starting or closing. While the data is not seasonally adjusted, it directly impacts the Headline Report. The chart below shows the impact of Birth/Death jobs on the total raw number for the last several months.
April had Birth/Deaths responsible for 42.4% of total jobs. This is the highest relative figure going back to July 2020 when Birth/Deaths represented -95%% of total jobs, mostly reversing a negative number. Ironically, it was also July 2020 when the economy was in a deep recession and most likely not opening new businesses. The current environment is probably similar. With business cutting back on spending and financial conditions tightening rapidly, it seems unlikely the economy is seeing a surge in new business fueling a booming job market.
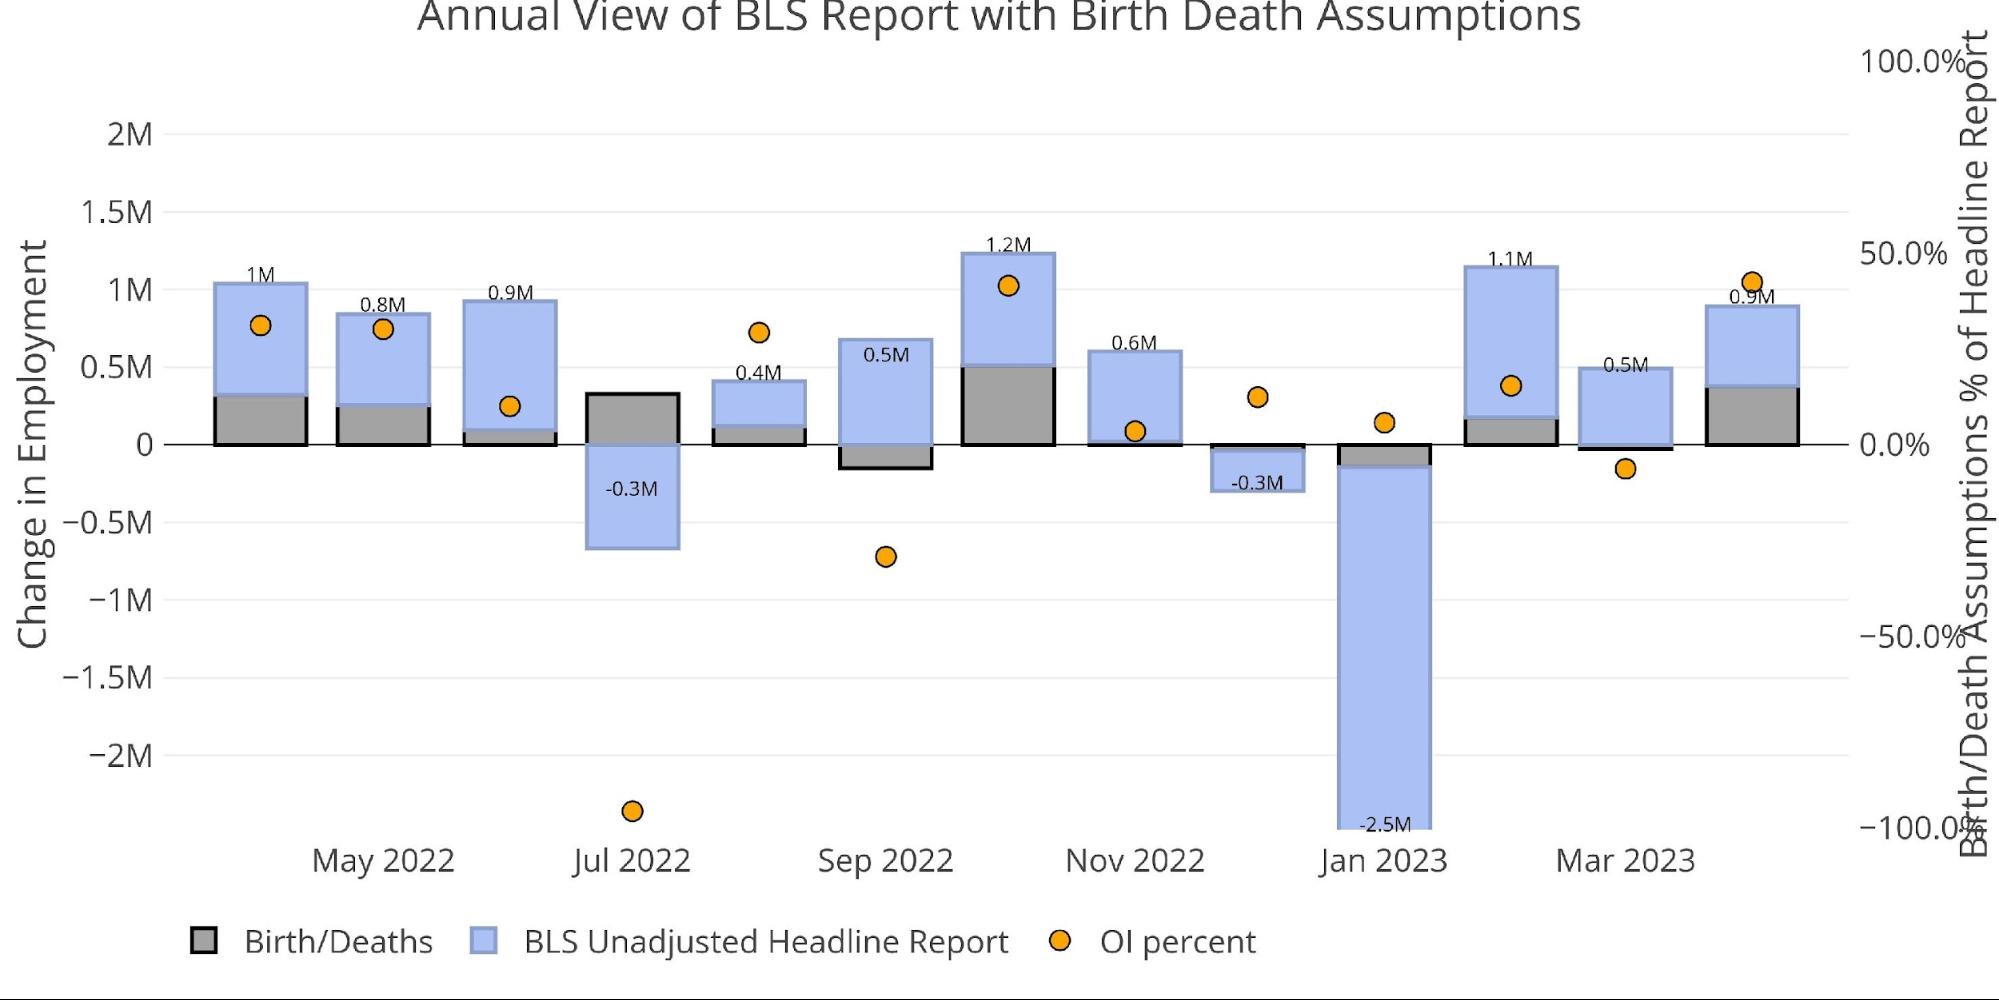
Figure: 3 Primary Unadjusted Report With Birth Death Assumptions – Monthly
YTD the economy has lost 388k jobs, but the Birth/Death assumptions have created 381k jobs. Essentially the Birth/Death model has negated all the job losses for the year so far.
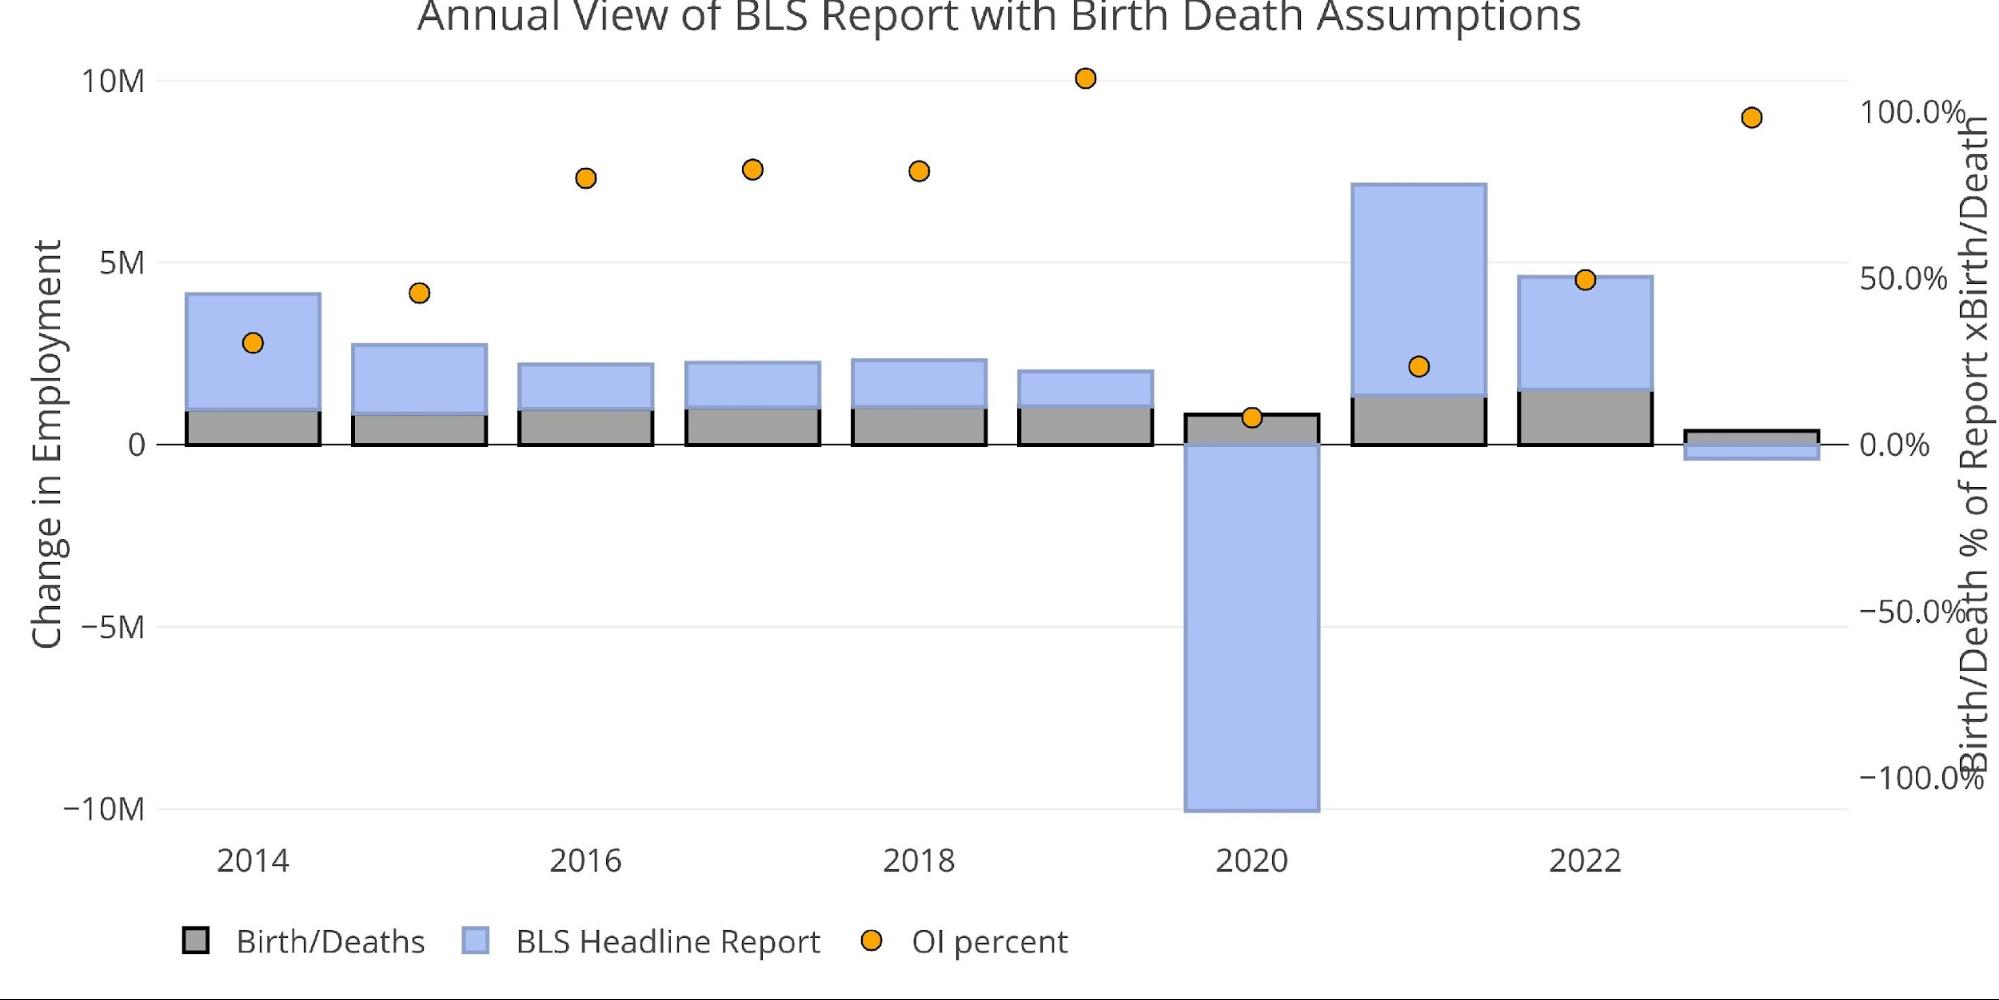
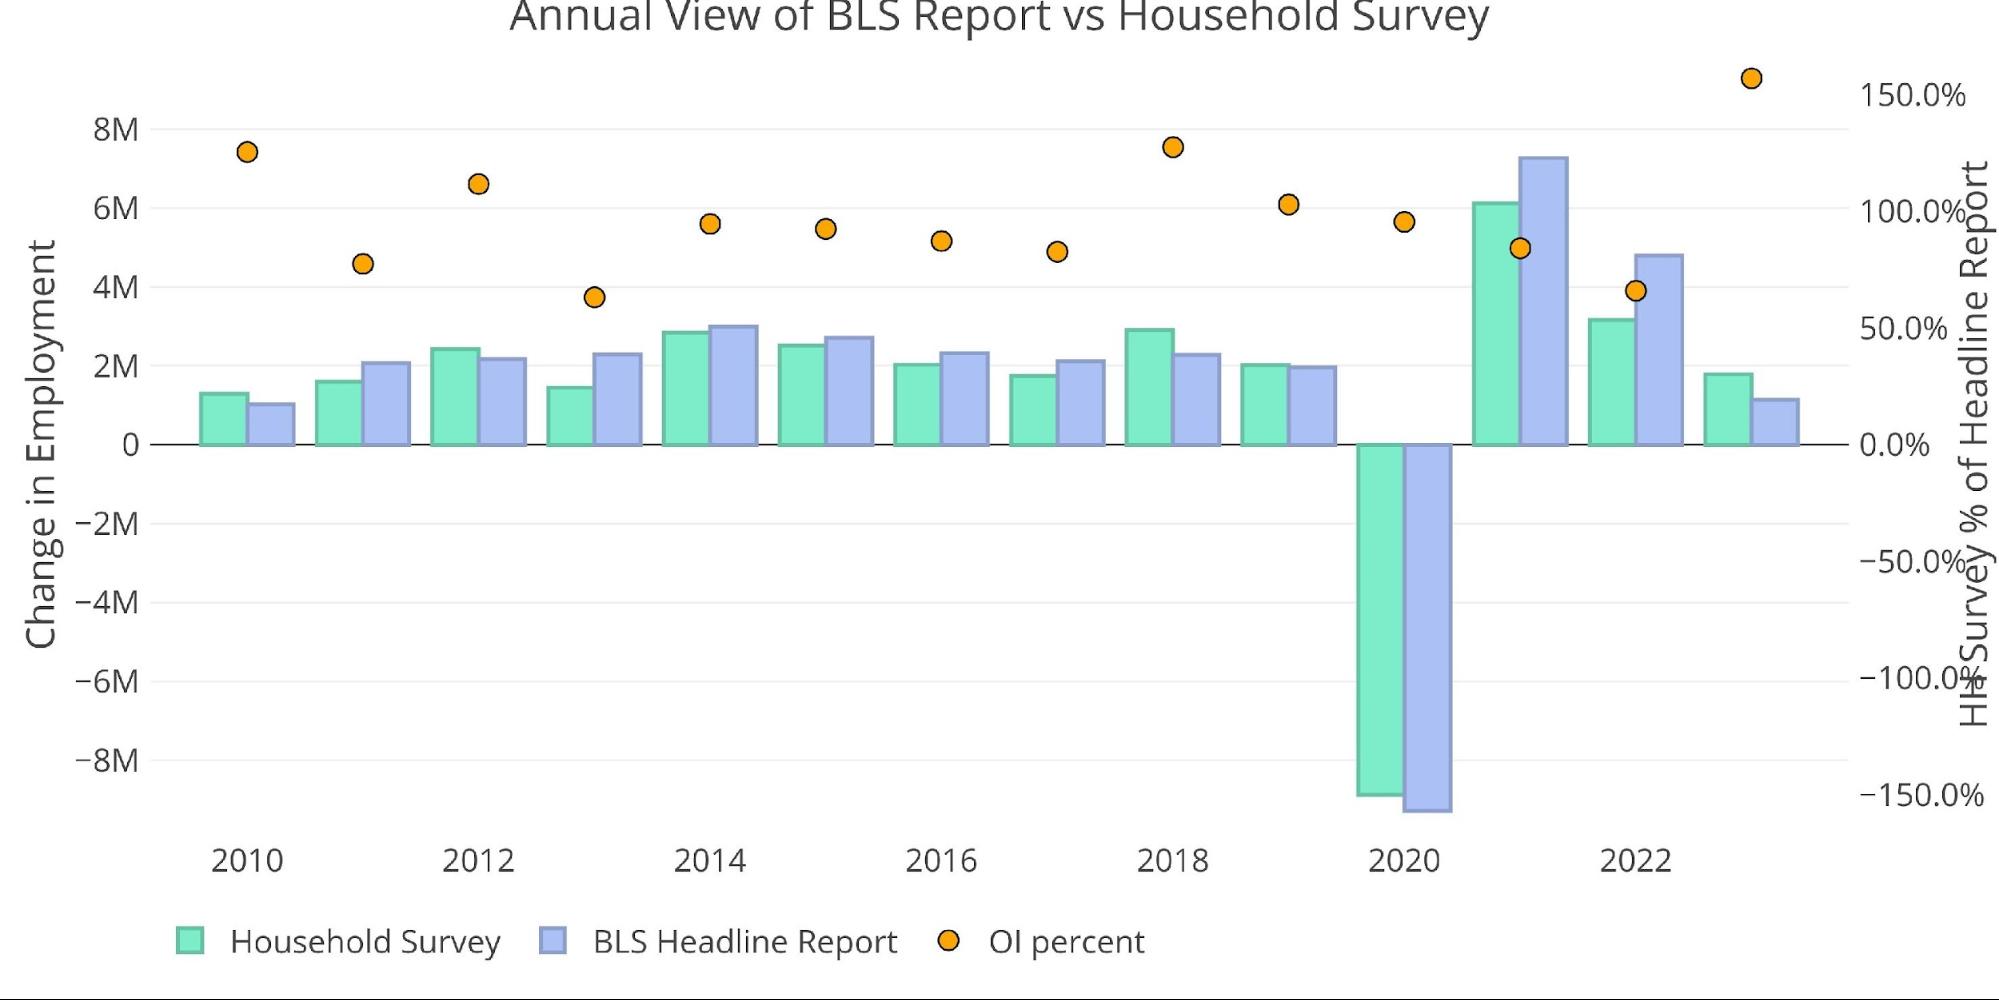
Figure: 4 Primary Unadjusted Report With Birth Death Assumptions – Annual
Digging Into the Report
The 253k jobs surprised to the upside and brought the unemployment rate down to 3.4%.
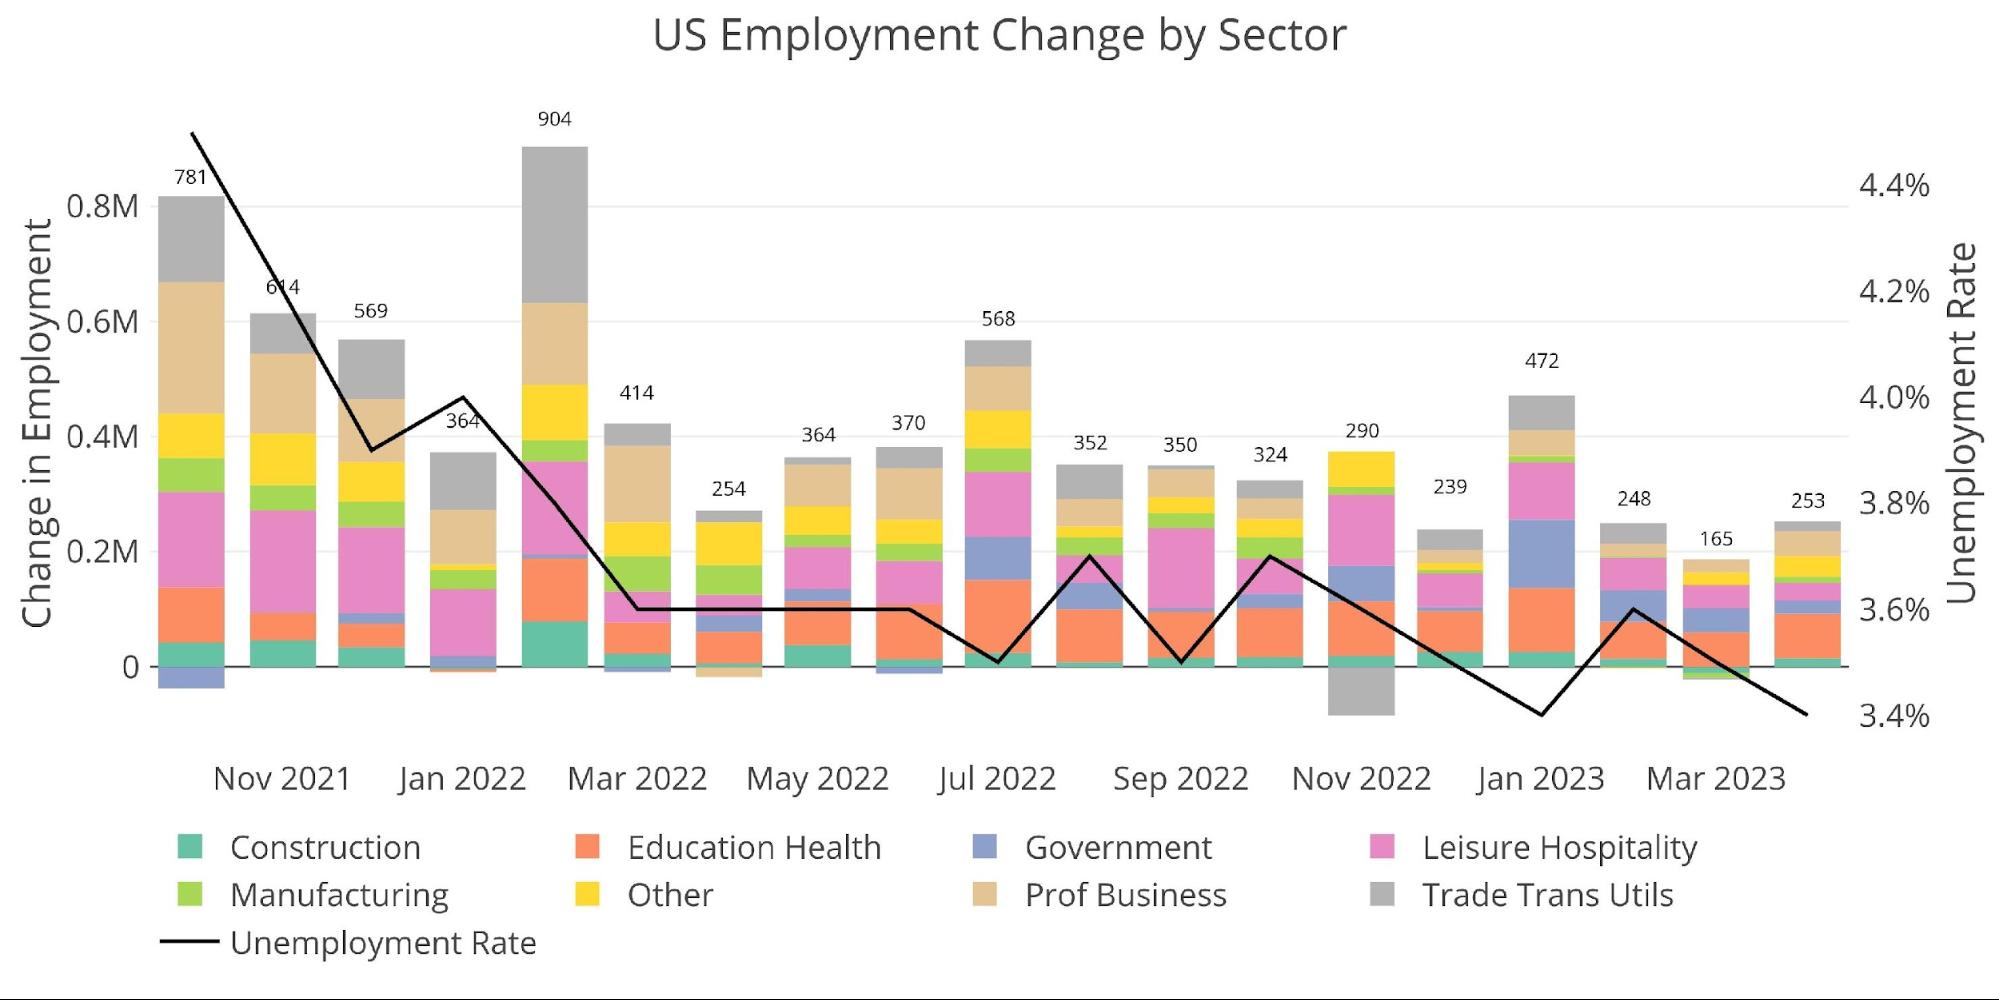
Figure: 5 Change by sector
One component driving the report higher was an increase in the number of people who have two full-time jobs. This increased by 30k in April, responsible for more than 10% of the new jobs added.
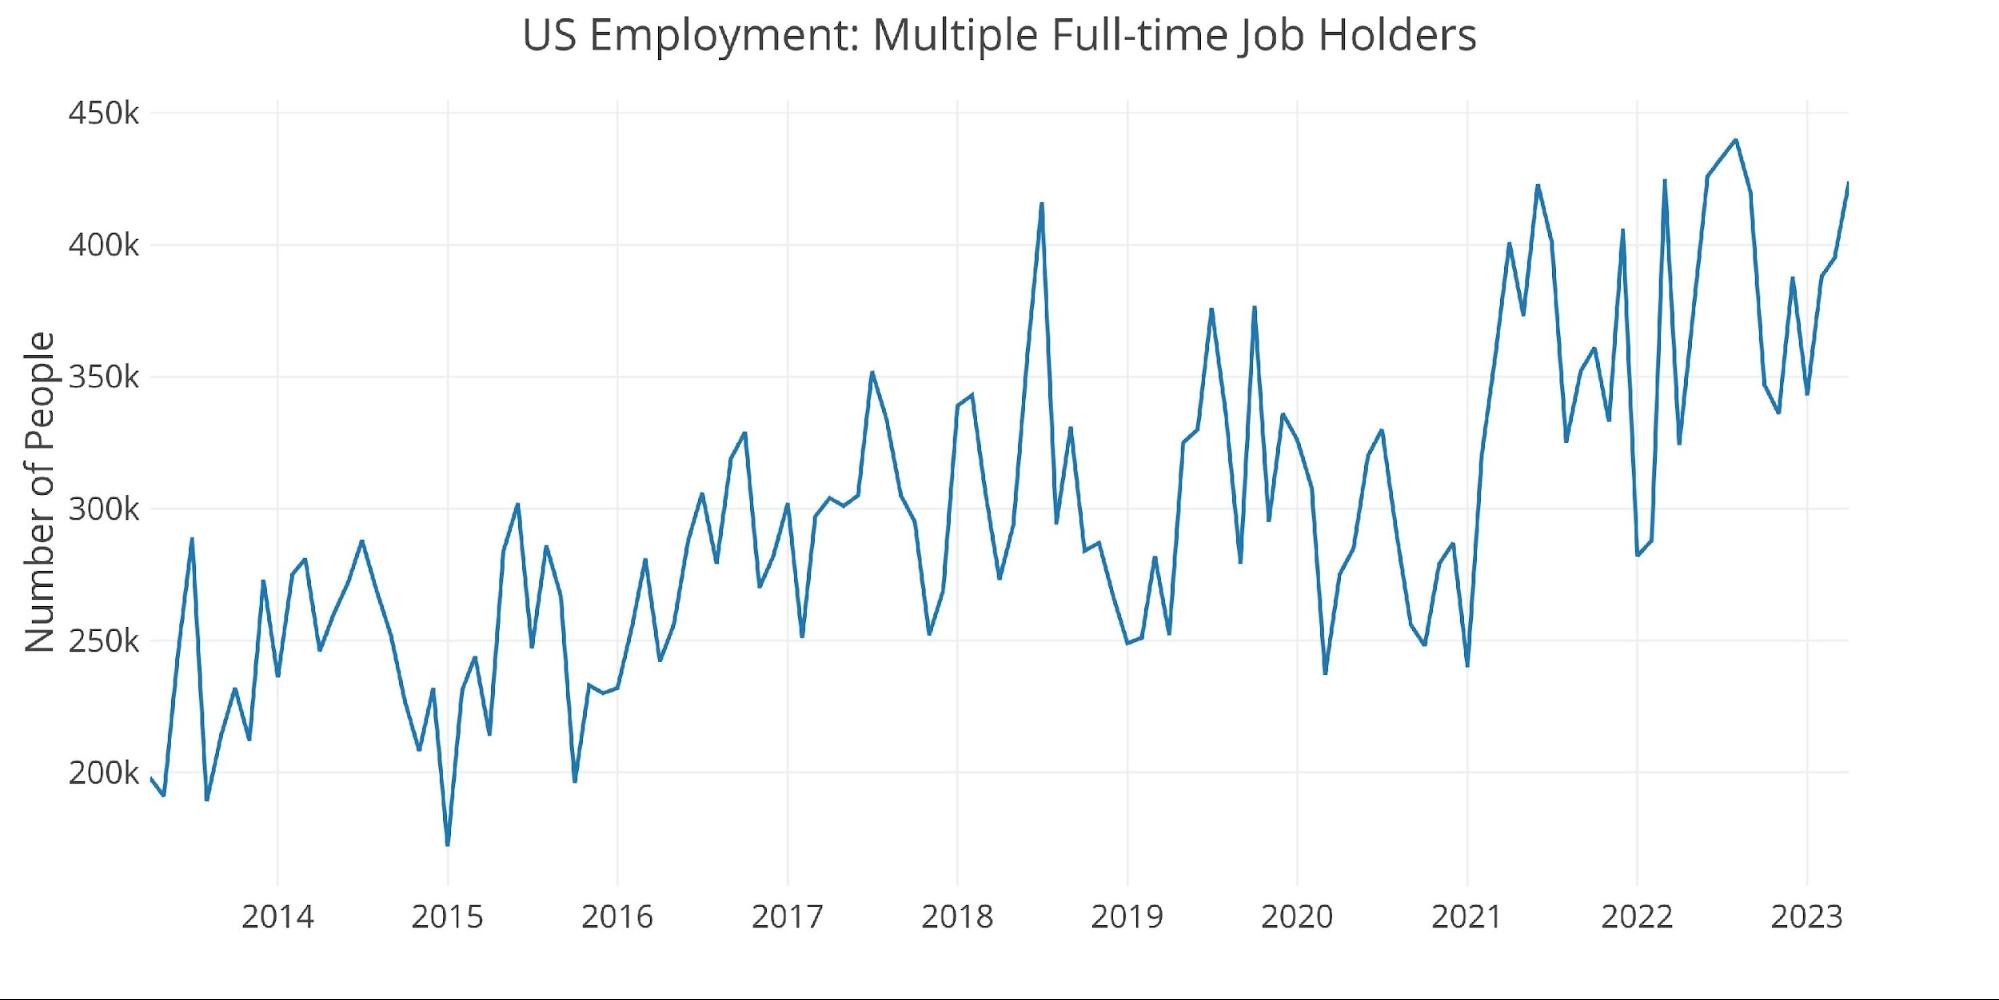
Figure: 6 Multiple Full-Time Employees
Another data point to consider is the adjustment made to the raw numbers. April is typically a strong month that gets revised down by the BLS seasonal adjustments. Interestingly, this year saw the smallest downward adjustment for any April going back to at least 2010. This means that the BLS model adjustments further helped pad the April figure.
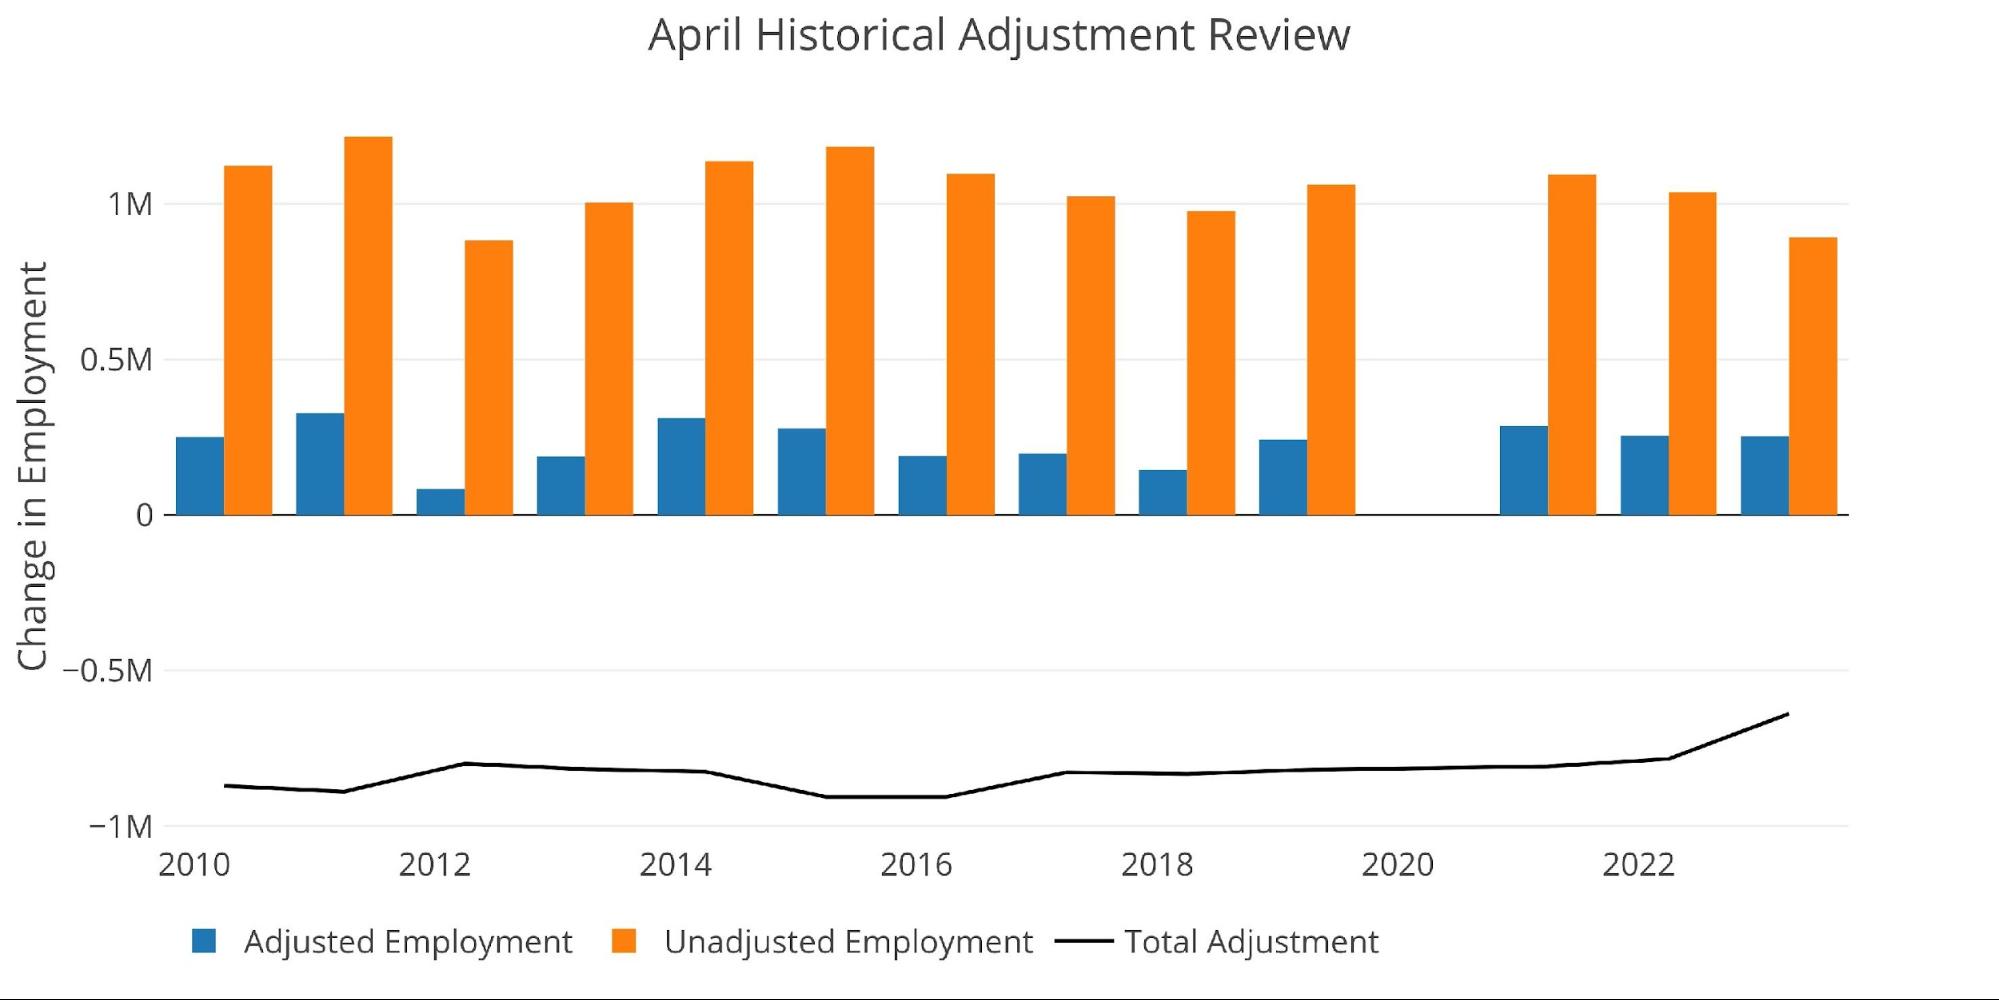
Figure: 7 YoY Adjusted vs Non-Adjusted
Breaking Down the Adjusted Numbers
Despite the unexpectedly strong report, 6 of the 8 employment categories are below the 12-month trend. Only Professional Business and Other saw gains that are greater than the historical trend.
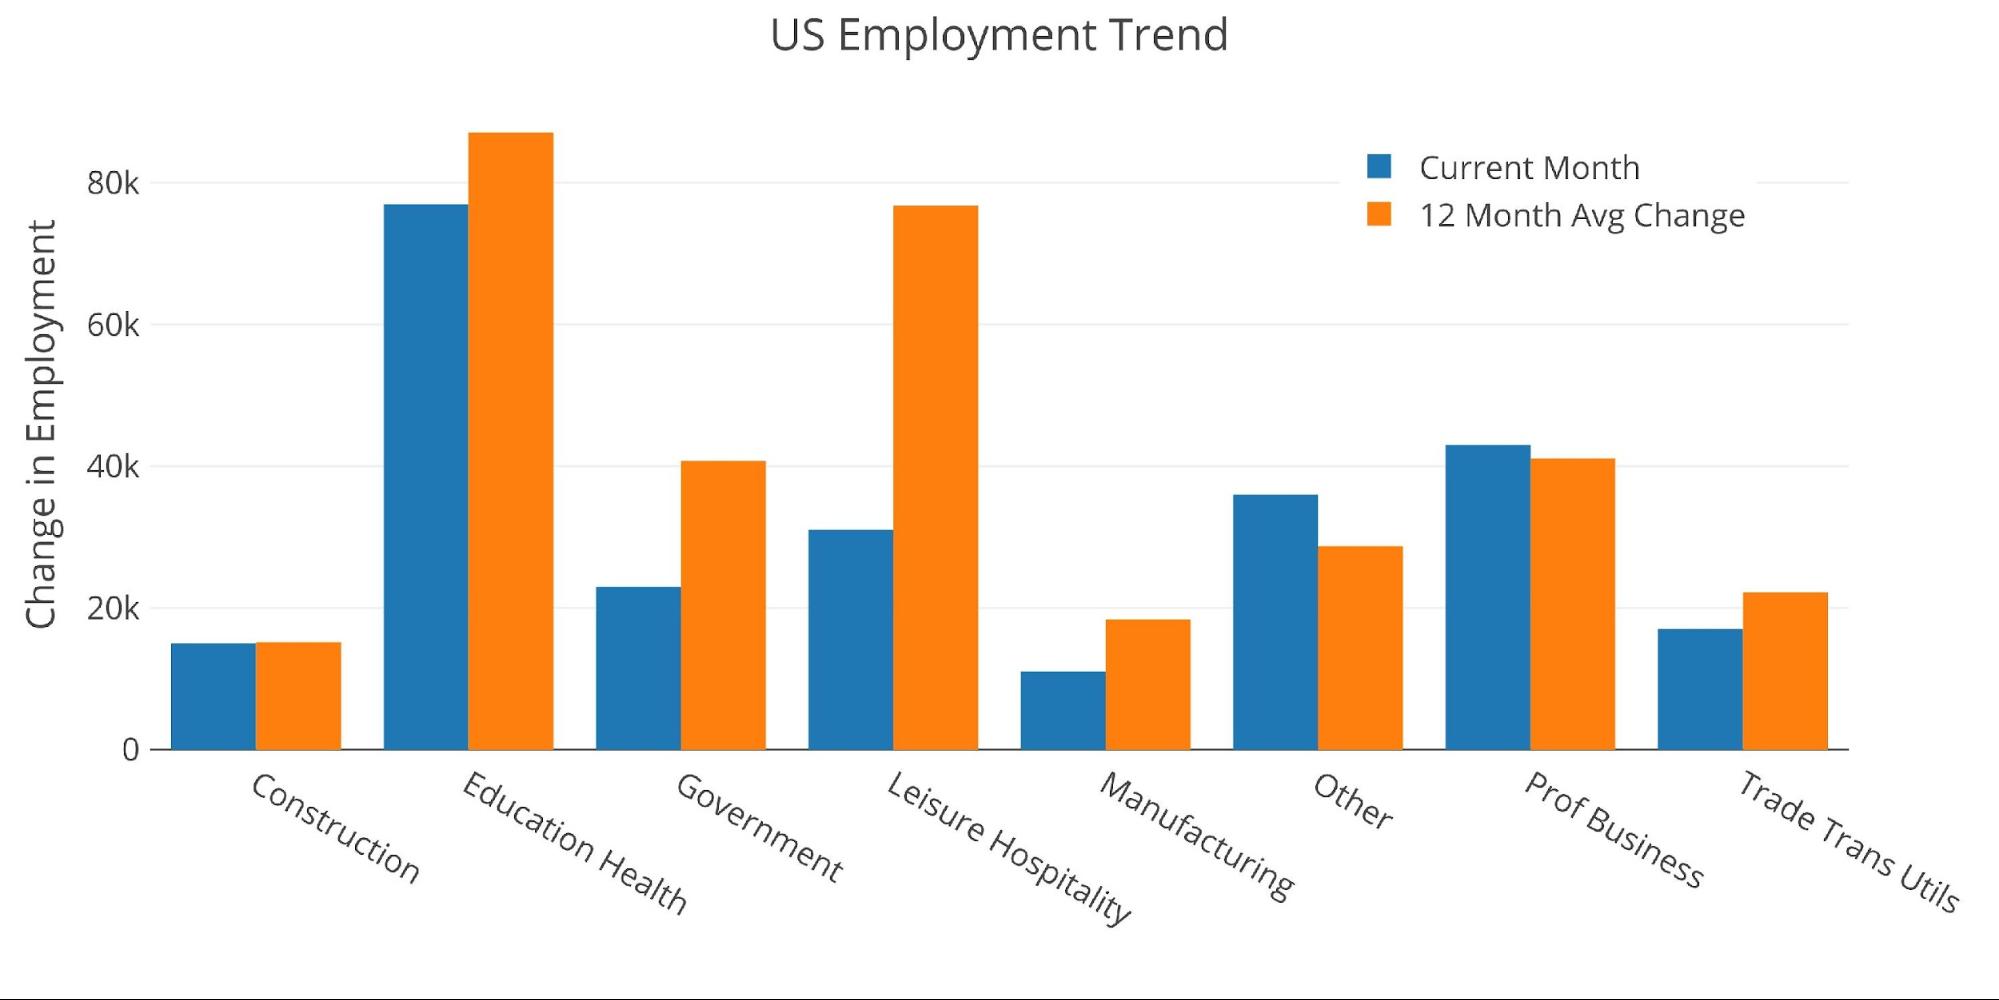
Figure: 8 Current vs TTM
The table below shows a detailed breakdown of the numbers.
Key takeaways:
-
- Every category was positive for the month
- 8 of the 10 private sector categories were greater than the 3-month trend
- All levels of government fell below the 3-month trend this month
Another surprise is the increase in tech workers, despite thousands of layoffs by the tech sector at large. Somehow the government is still able to find jobs created within the information category.
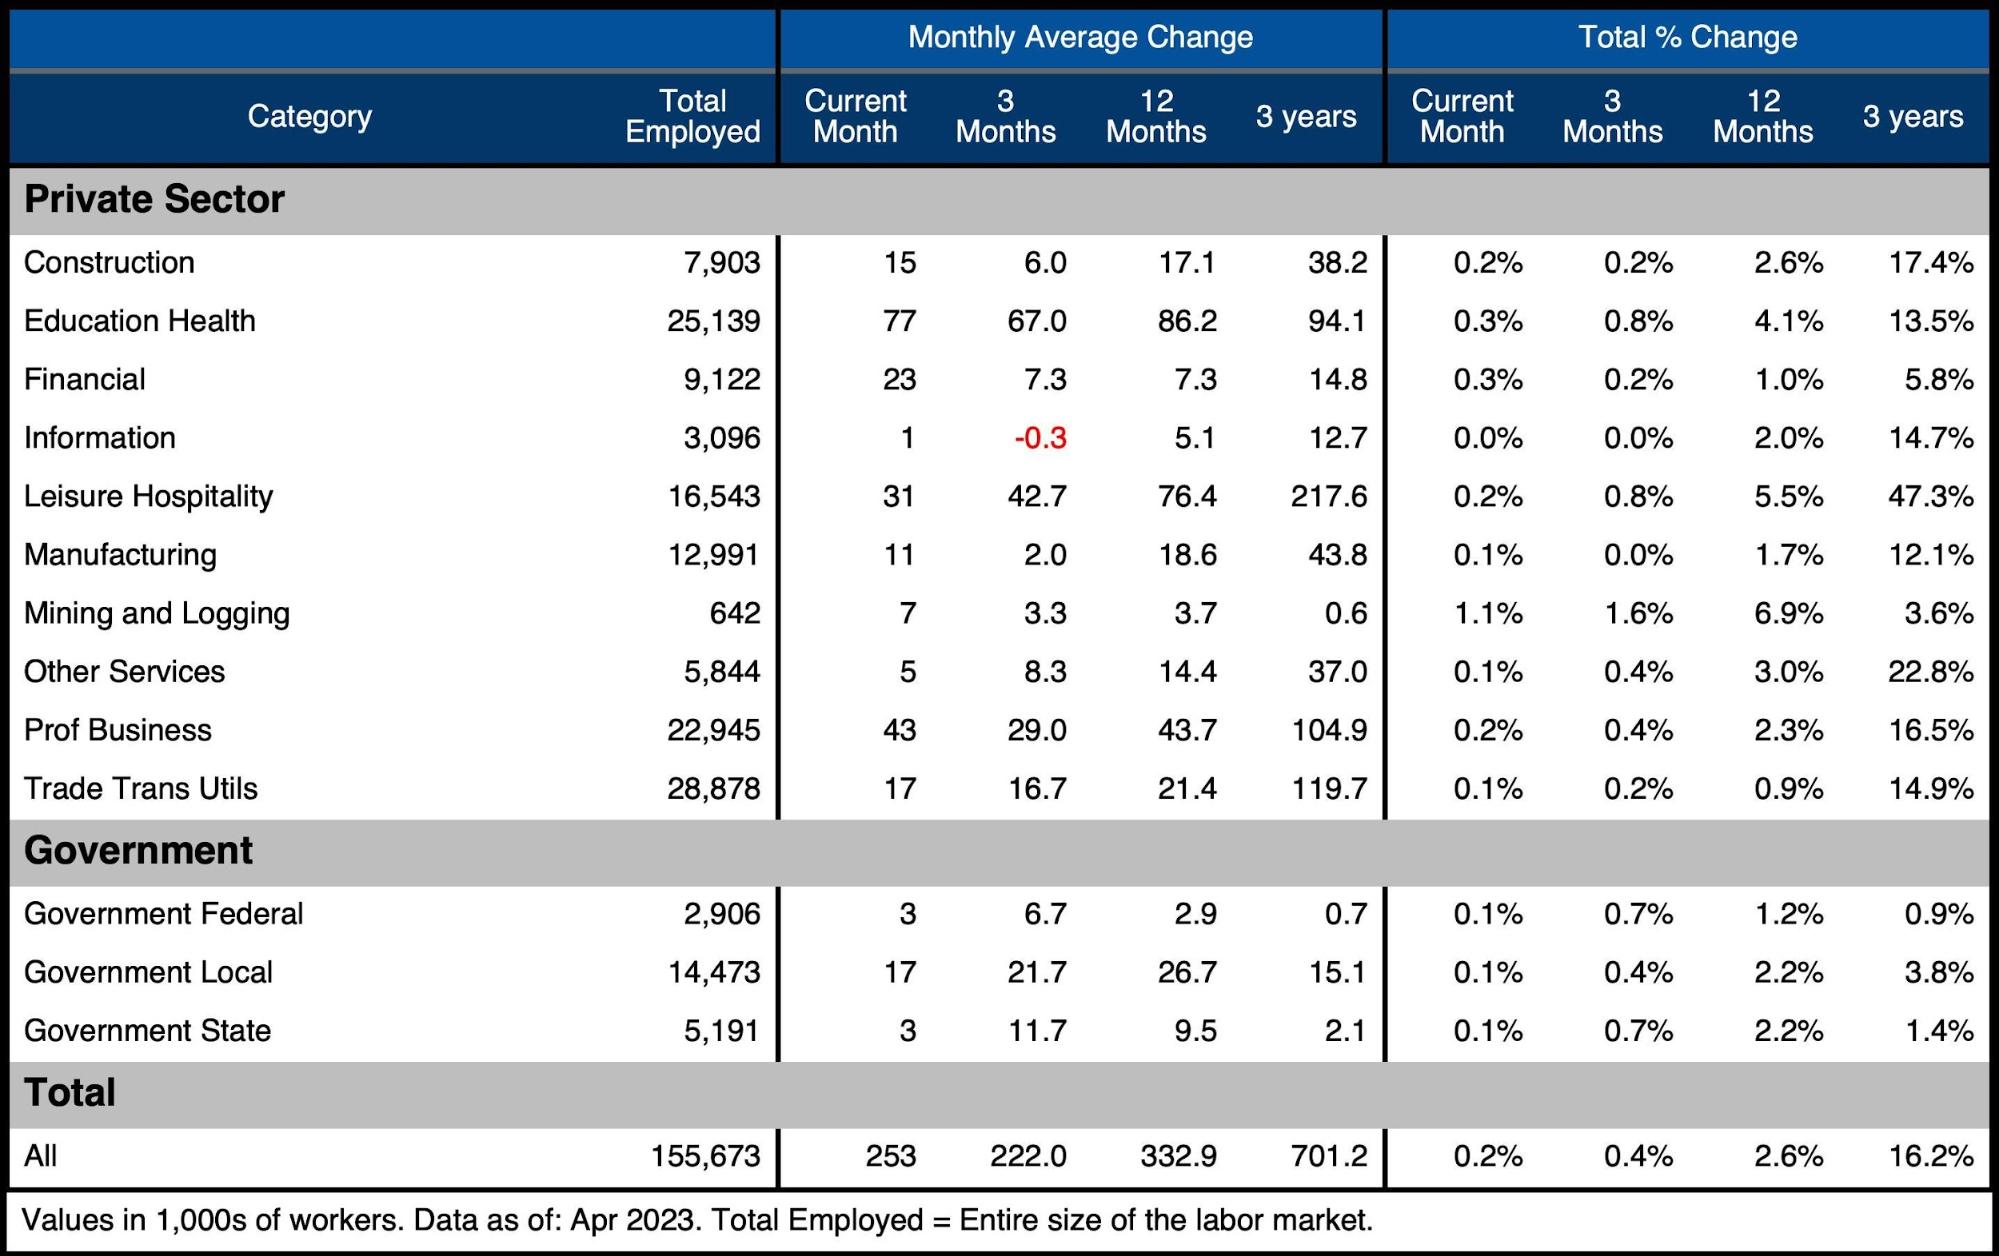
Figure: 9 Labor Market Detail
Revisions
The biggest red flag of this report is the prior month’s revisions. From January to March, the total jobs were overestimated by 179k jobs. Considering most reports are in the 200k range, the revisions down over the last three months basically negated an entire average month of hiring. How can the BLS be getting the data so wrong?
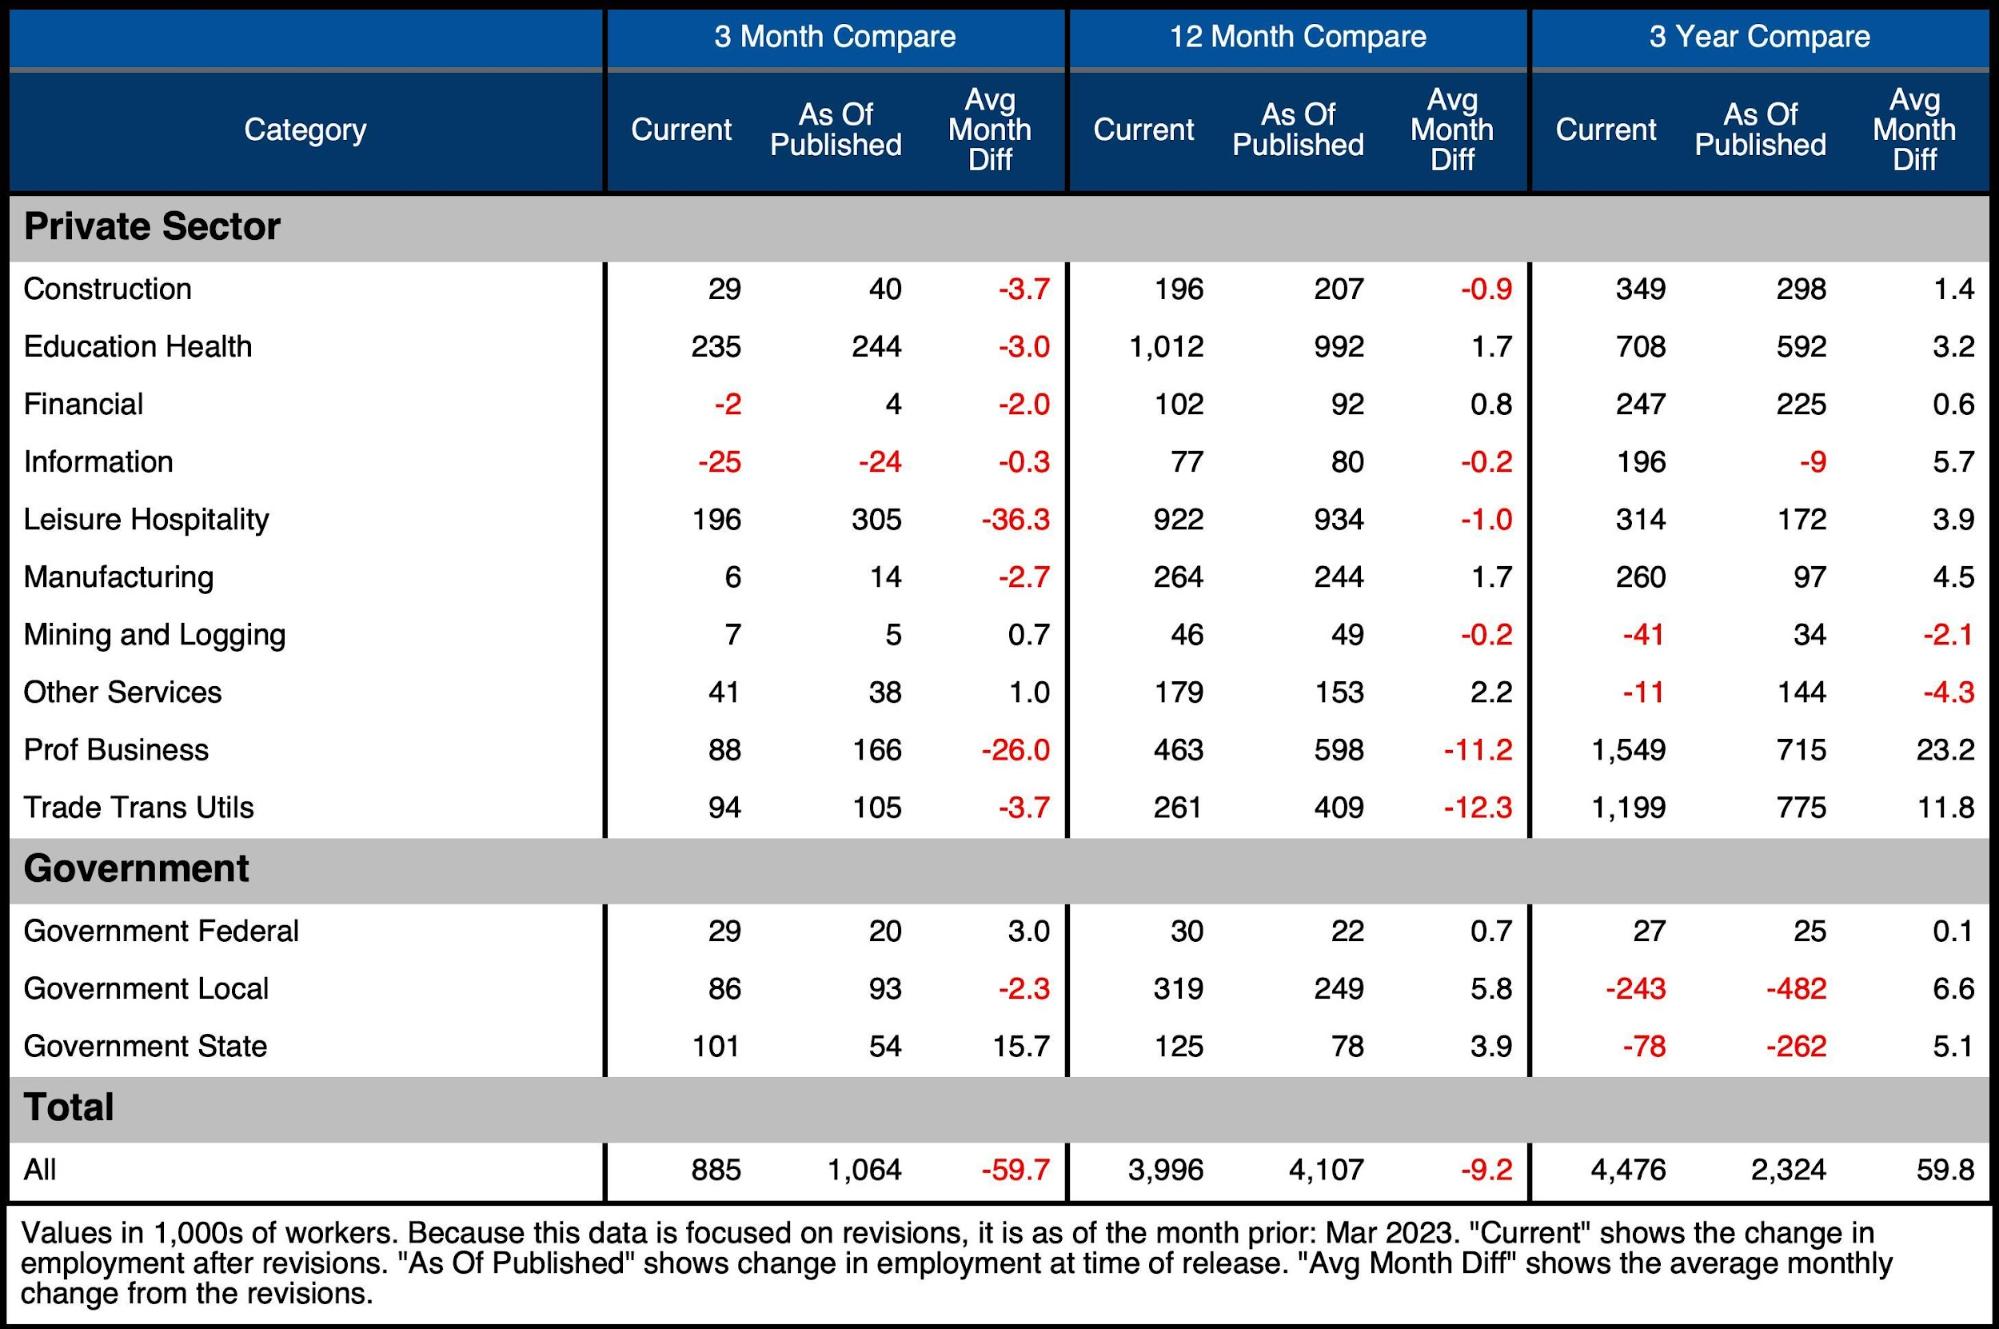
Figure: 10 Revisions
Historical Perspective
The chart below shows data going back to 1955. As shown, the economy is currently “enjoying” its lowest unemployment rate on record. This is quite hard to believe given the current economic environment and job losses that have been announced and implemented.
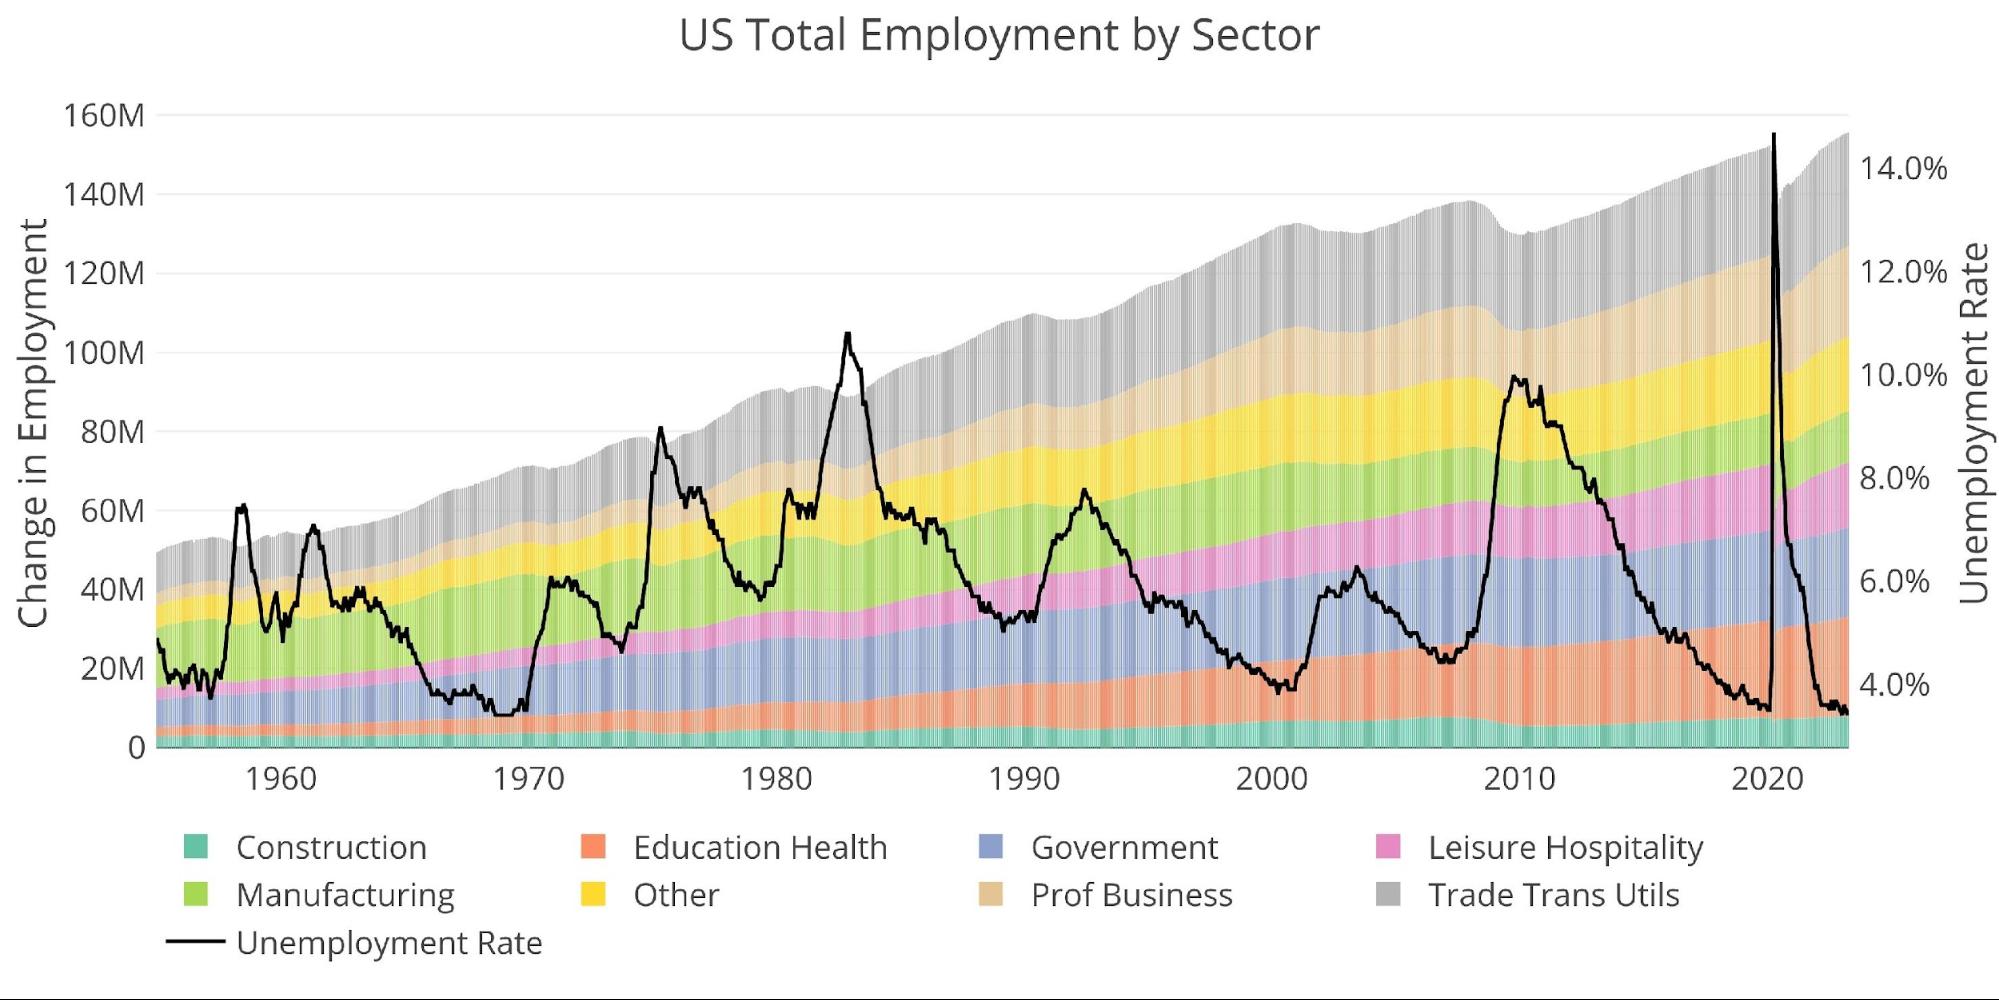
Figure: 11 Historical Labor Market
The labor force participation rate has reached a post-pandemic high of 62.6% but sits below the 63.3% in Feb 2020 and well below the 66% from before the Financial Crisis.

Figure: 12 Labor Market Distribution
Wrapping Up
The BLS continues to issue jobs reports that defy reality and expectations. In fact, this jobs report broke a record as having been the 13th consecutive job report where the market underestimated the numbers. Typically, market expectations alternate between above and below the report, but for 13 months in a row, market expectations have been below the official report.
Furthermore, the banking sector is clearly still under strain and more companies continue to announce layoffs. This jobs report does not jive with the broader economic picture.
Four factors turned this mediocre report into a good report:
-
- The Birth/Death assumptions were very large in favor of new jobs
- The Number of people working two full-time jobs increased by 29k
- The seasonal adjustment down was very small for April historically
- The historical revisions dropped almost 180k jobs out of the last 3 reports
These four factors suggest the BLS numbers are not accurately reflecting the labor market and things are much weaker than they appear. The Fed is pointing to the job numbers for full justification of their tight monetary policy. Perhaps if the data were more accurate, they would feel less confident about the labor market and economy. It might also wake them up to the fact they have already driven the economy over a cliff.
Since the Fed wants to keep its head in the sand, it will plow away until more things break. At that point, the pivot will be much harder than anyone anticipates. That is also the point at which precious metals will blast off. Given how close gold is to new all-time highs, there are certainly people who see this coming.
Data Source: https://fred.stlouisfed.org/series/PAYEMS and also series CIVPART
Data Updated: Monthly on first Friday of the month
Last Updated: Apr 2023
Interactive charts and graphs can always be found on the Exploring Finance dashboard: https://exploringfinance.shinyapps.io/USDebt/

Call 1-888-GOLD-160 and speak with a Precious Metals Specialist today!
Buka akaun dagangan patuh syariah anda di Weltrade.
Source link