
The Federal Government ran a surplus last month as it typically does in April due to the tax deadline. The surplus was $176B which was 43% lower than the surplus last April. As the chart below shows, this was driven entirely by collapsing revenues as expenses actually fell as well.
Expenses fell 16.8% YoY from -$555B to -$462B. This pales in comparison to the 26% collapse in revenue from $863B to $638B. Thus, spending fell by $95B, but revenue fell an incredible $225B!
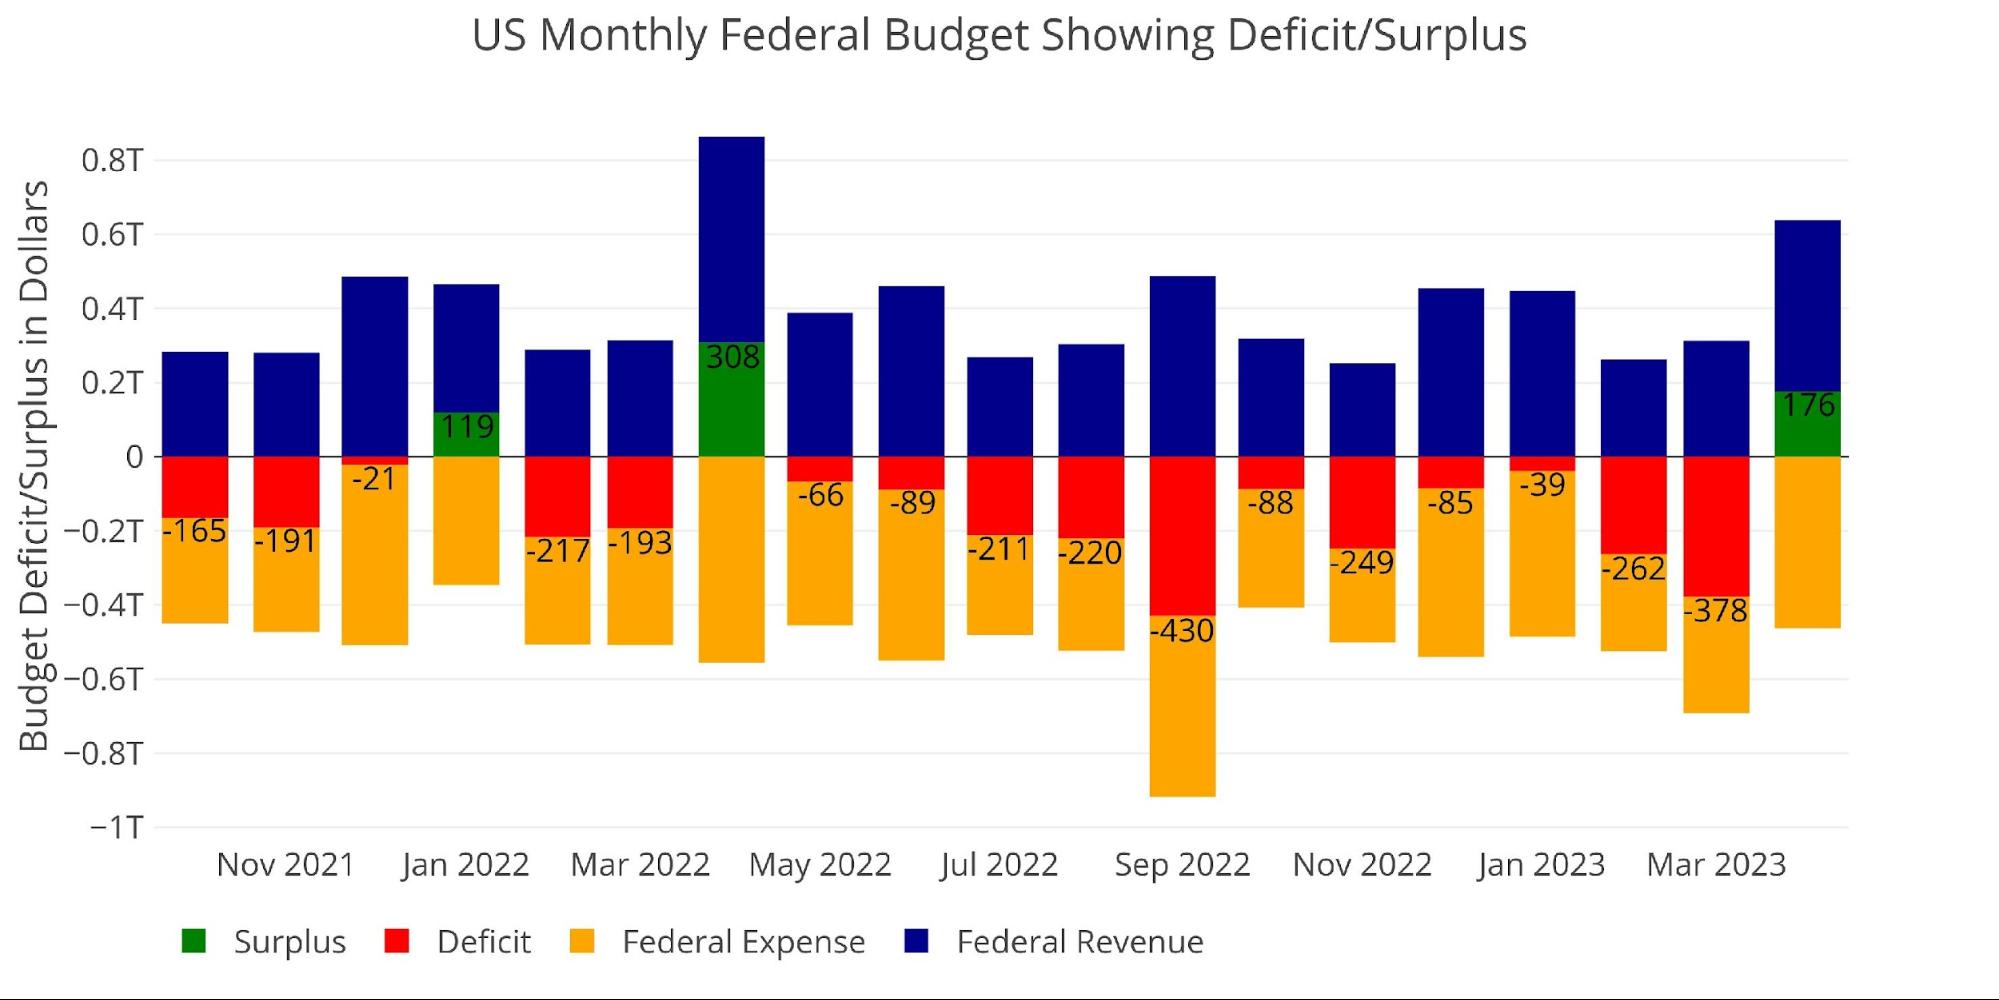
Figure: 1 Monthly Federal Budget
The chart below shows the month of April historically. The current April surplus is actually less than 2017 and 2018 when revenues were far lower.
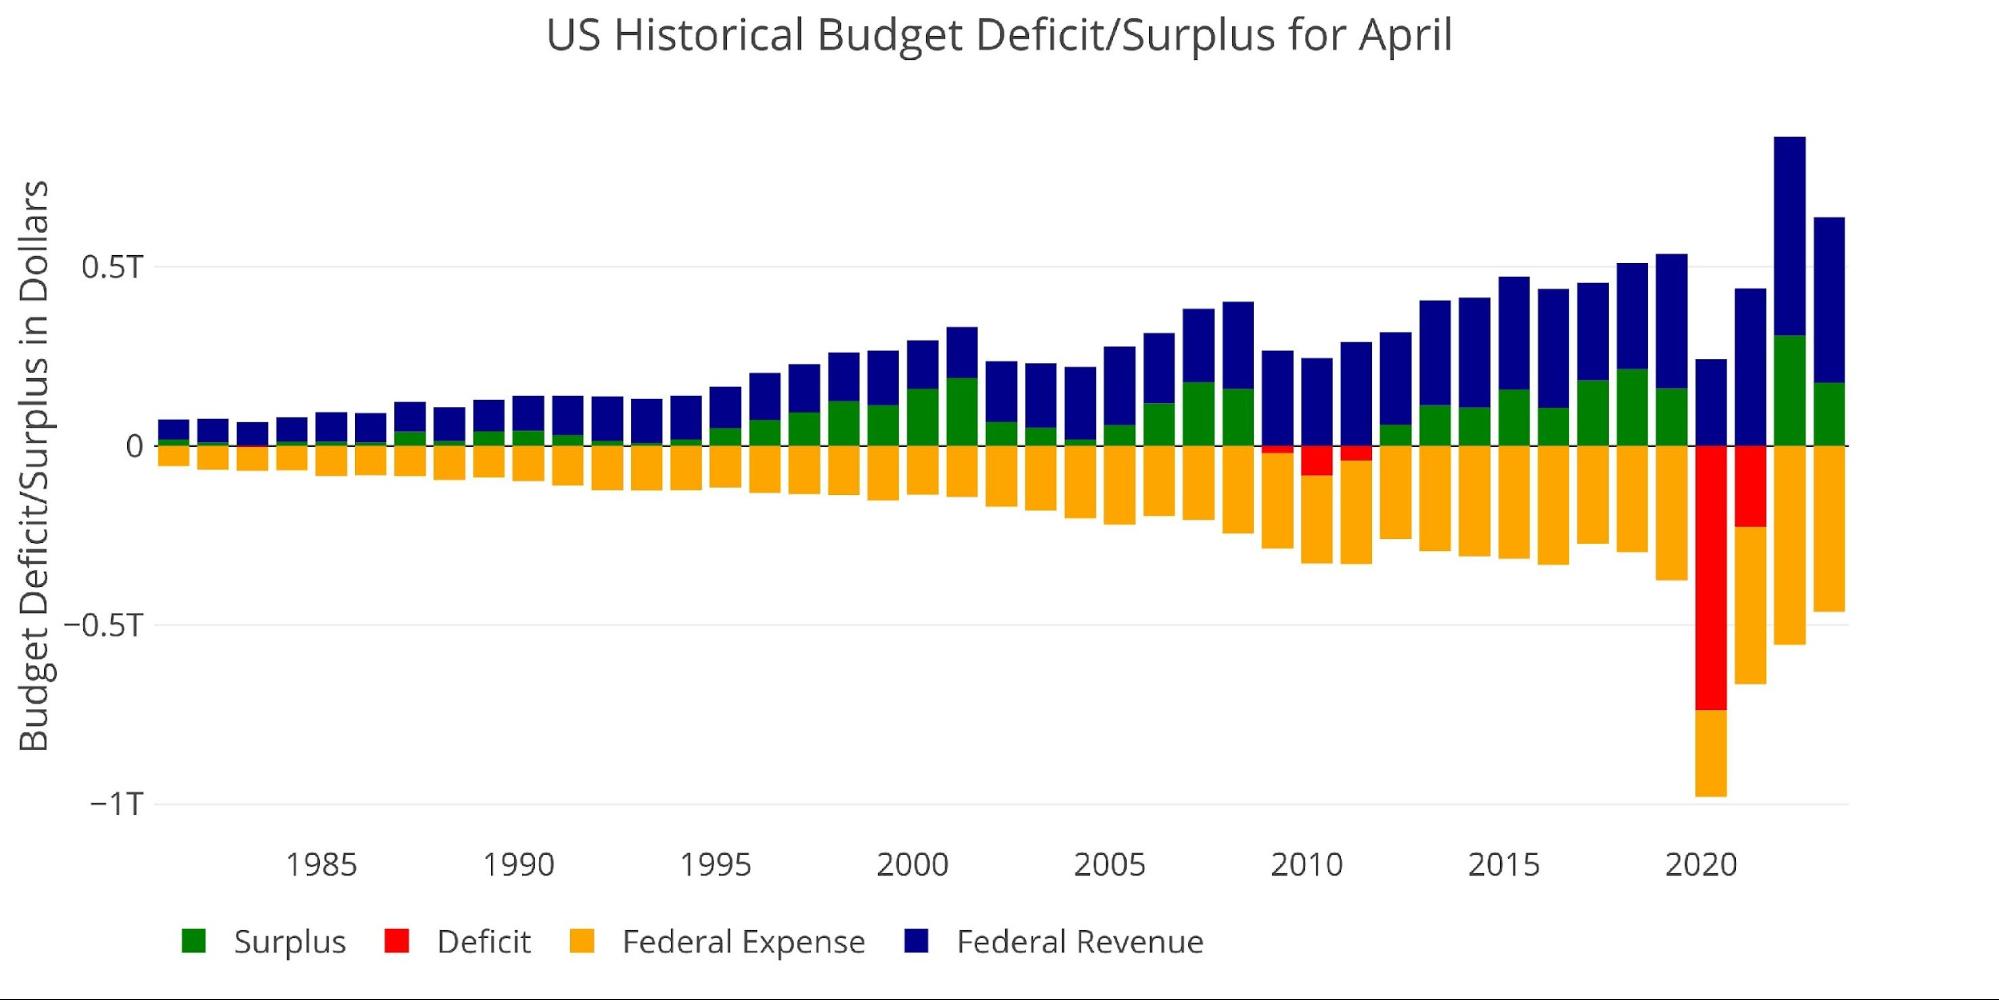
Figure: 2 Historical Deficit/Surplus for April
Looking over the ten years before Covid, the April surplus averaged $124B which is smaller than the latest month. While a bigger surplus is typically a positive, it needs to be put in context against much larger spending. For example, compared to 2019, the surplus has only increased 10% while total spending has increased 23%.
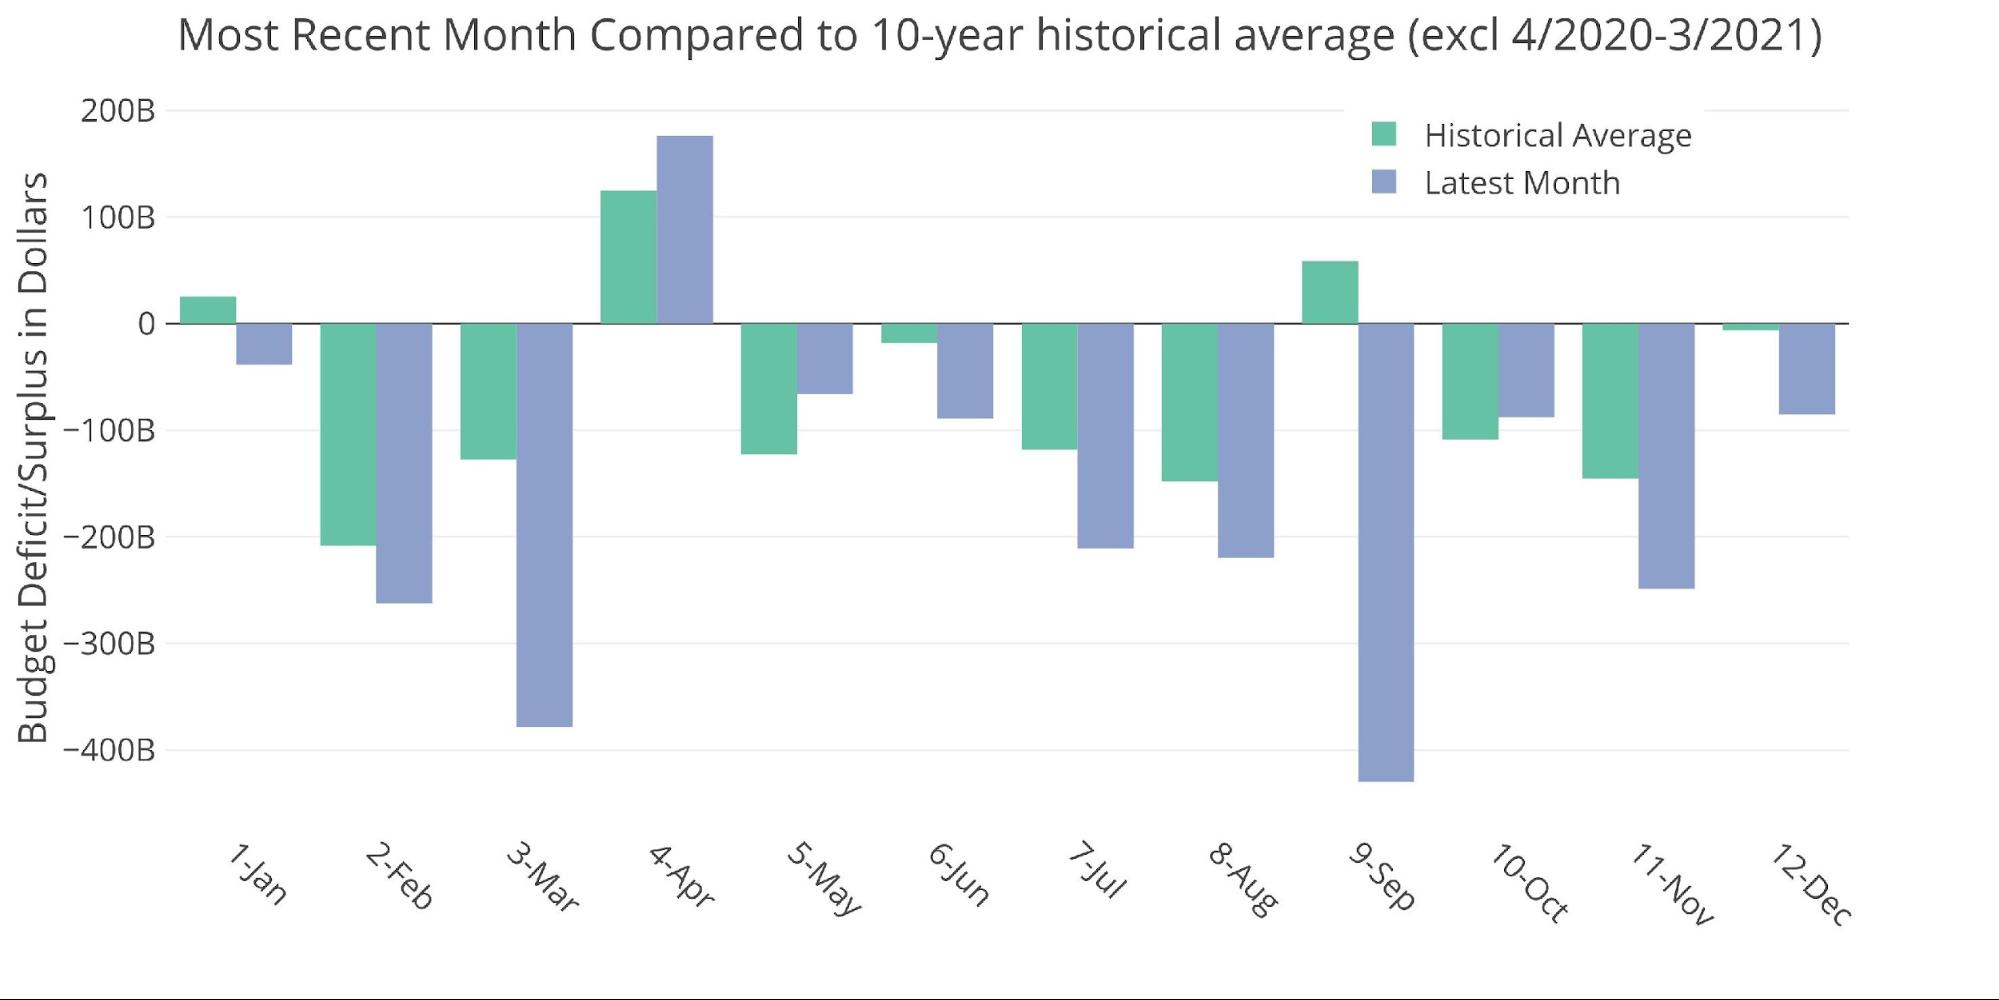
Figure: 3 Current vs Historical
The Sankey diagram below shows the distribution of spending and revenue. The surplus represented almost 28% of total revenues.

Figure: 4 Monthly Federal Budget Sankey
Looking at the TTM shows that the deficit represented 30% of total revenues or $1.9T!
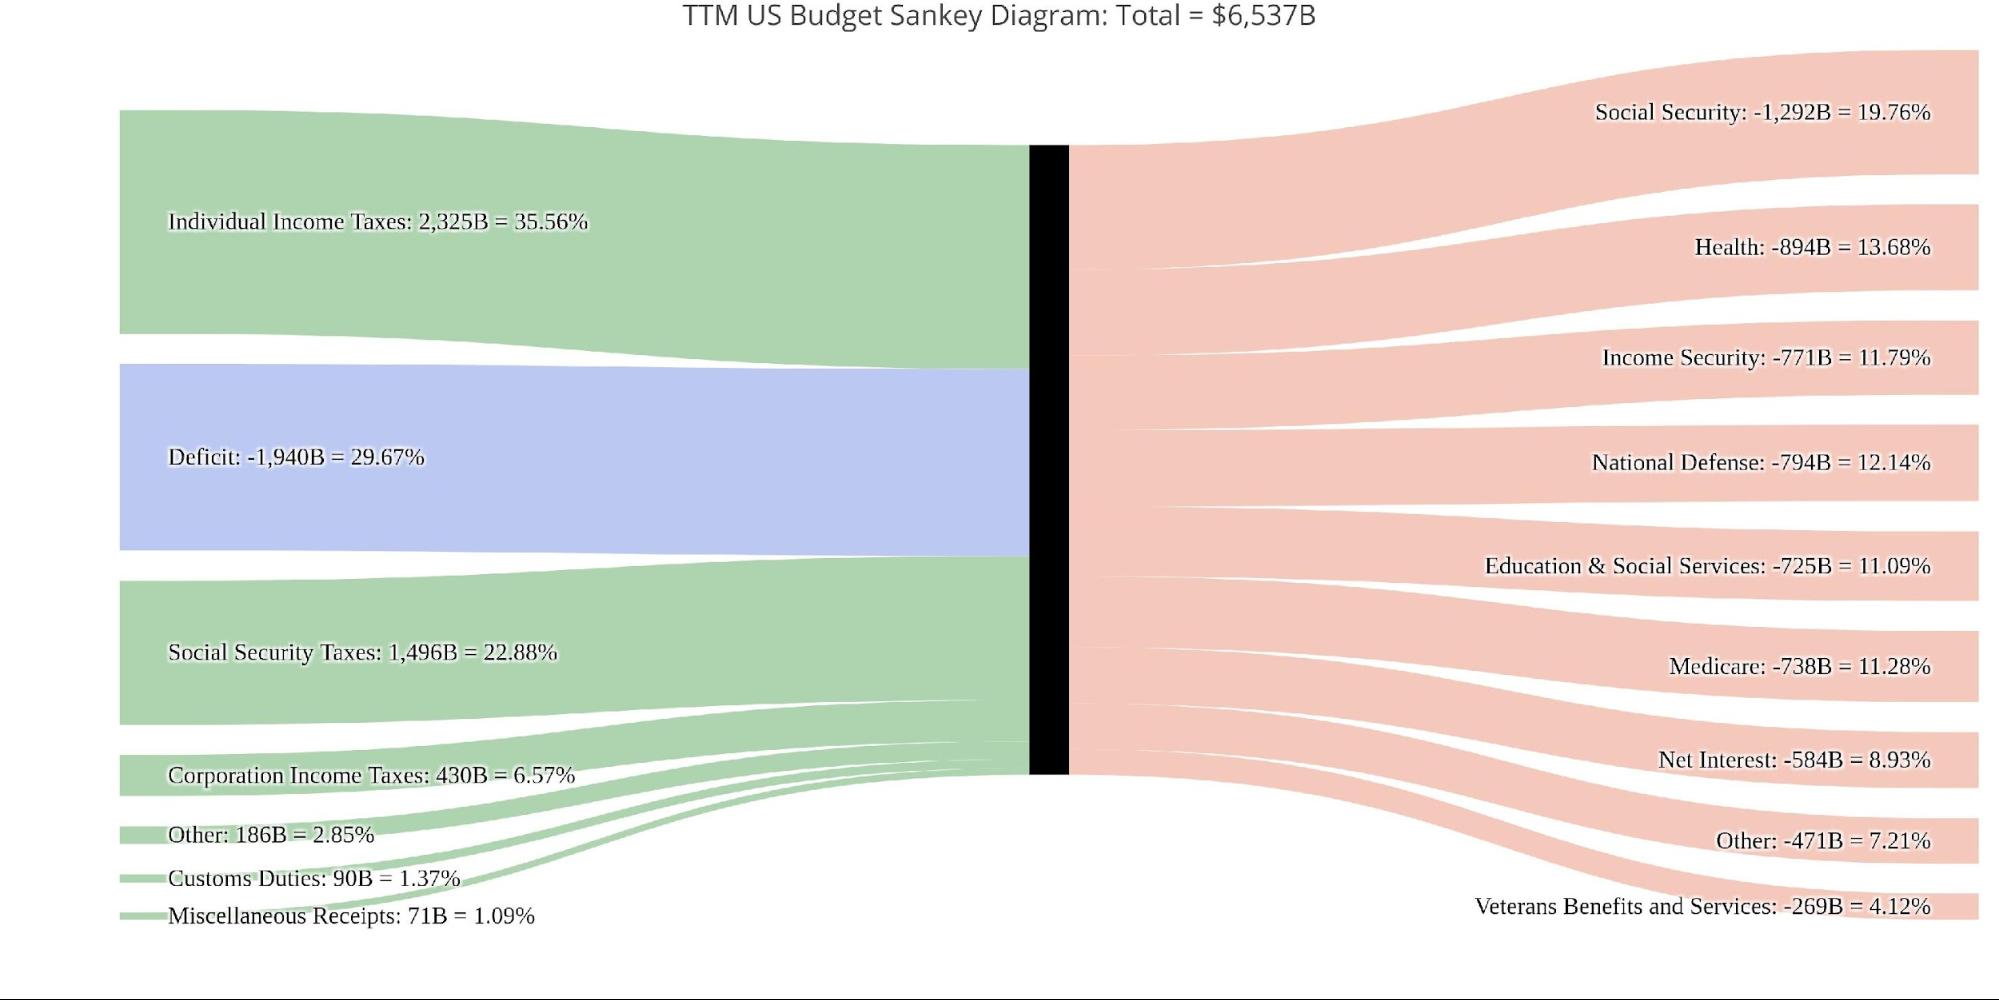
Figure: 5 TTM Federal Budget Sankey
While the YoY fall in revenue is certainly something to focus on, it should be noted that April was still a massive month compared to the other months of the year. This is because the tax deadline is in April which is when the Treasury sees a surge in revenues.
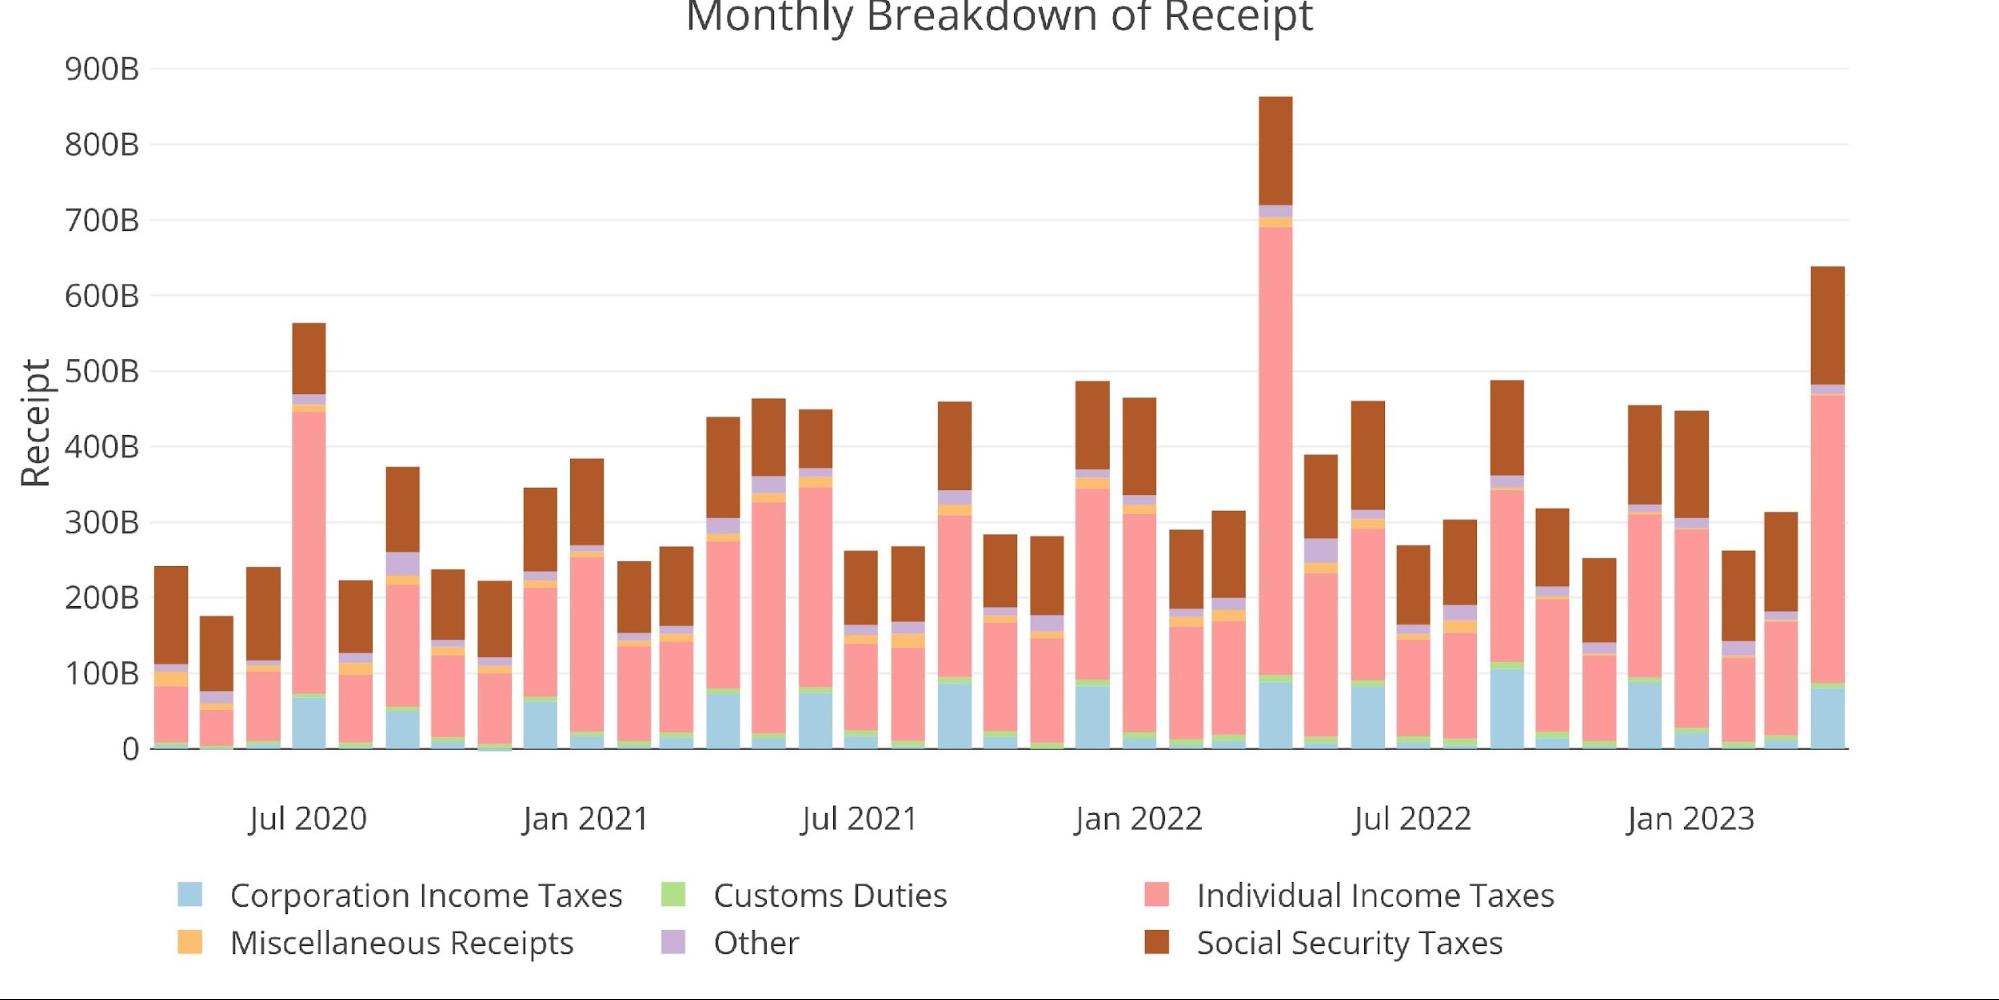
Figure: 6 Monthly Receipts
Expenses fell in April to the lowest level since October 2022. Similar to the one-month surge in revenues, this is likely a one-month phenomenon. The government does not typically reduce expenditures.
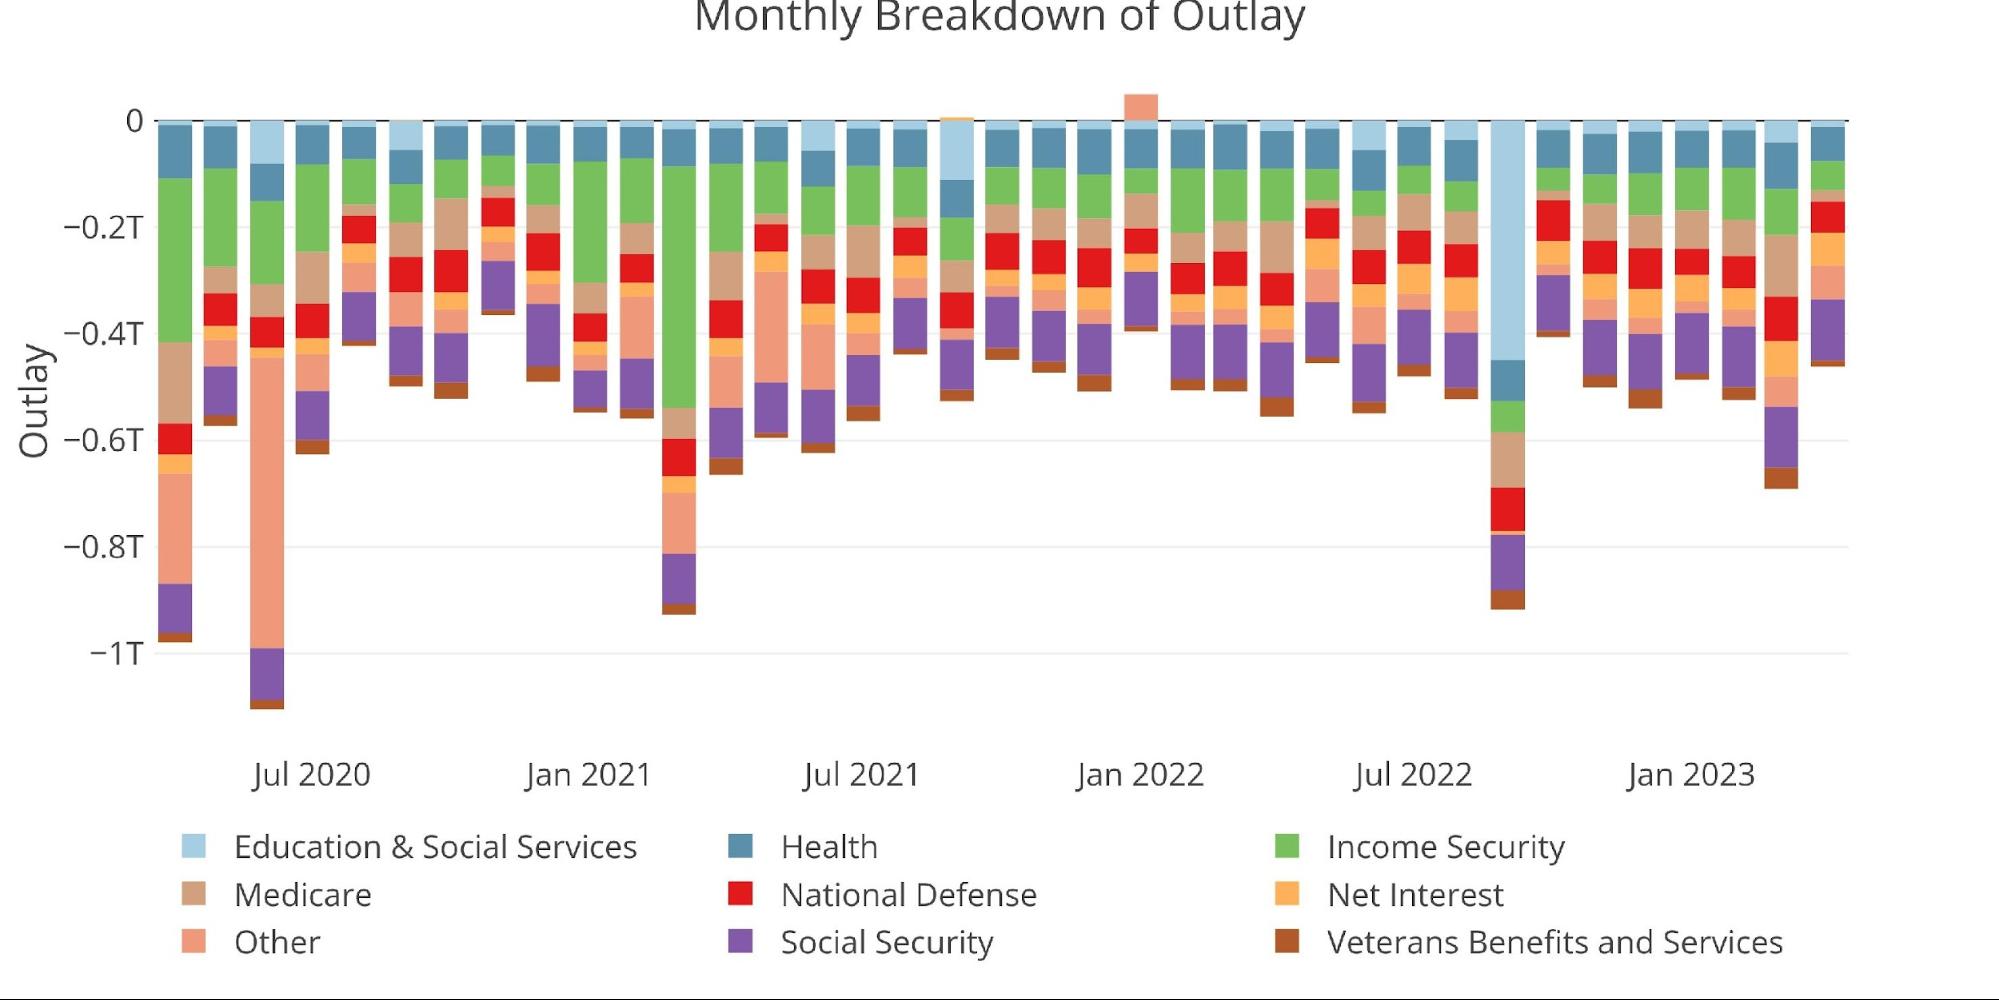
Figure: 7 Monthly Outlays
One expense that did not fall, was Net Interest Expense. The chart below shows the trajectory of the TTM Net Interest. In the latest month, it rose $19B and has reached $583B! Based on the debt rollover and current interest rates, it’s likely that interest expense could exceed $700B by year-end.
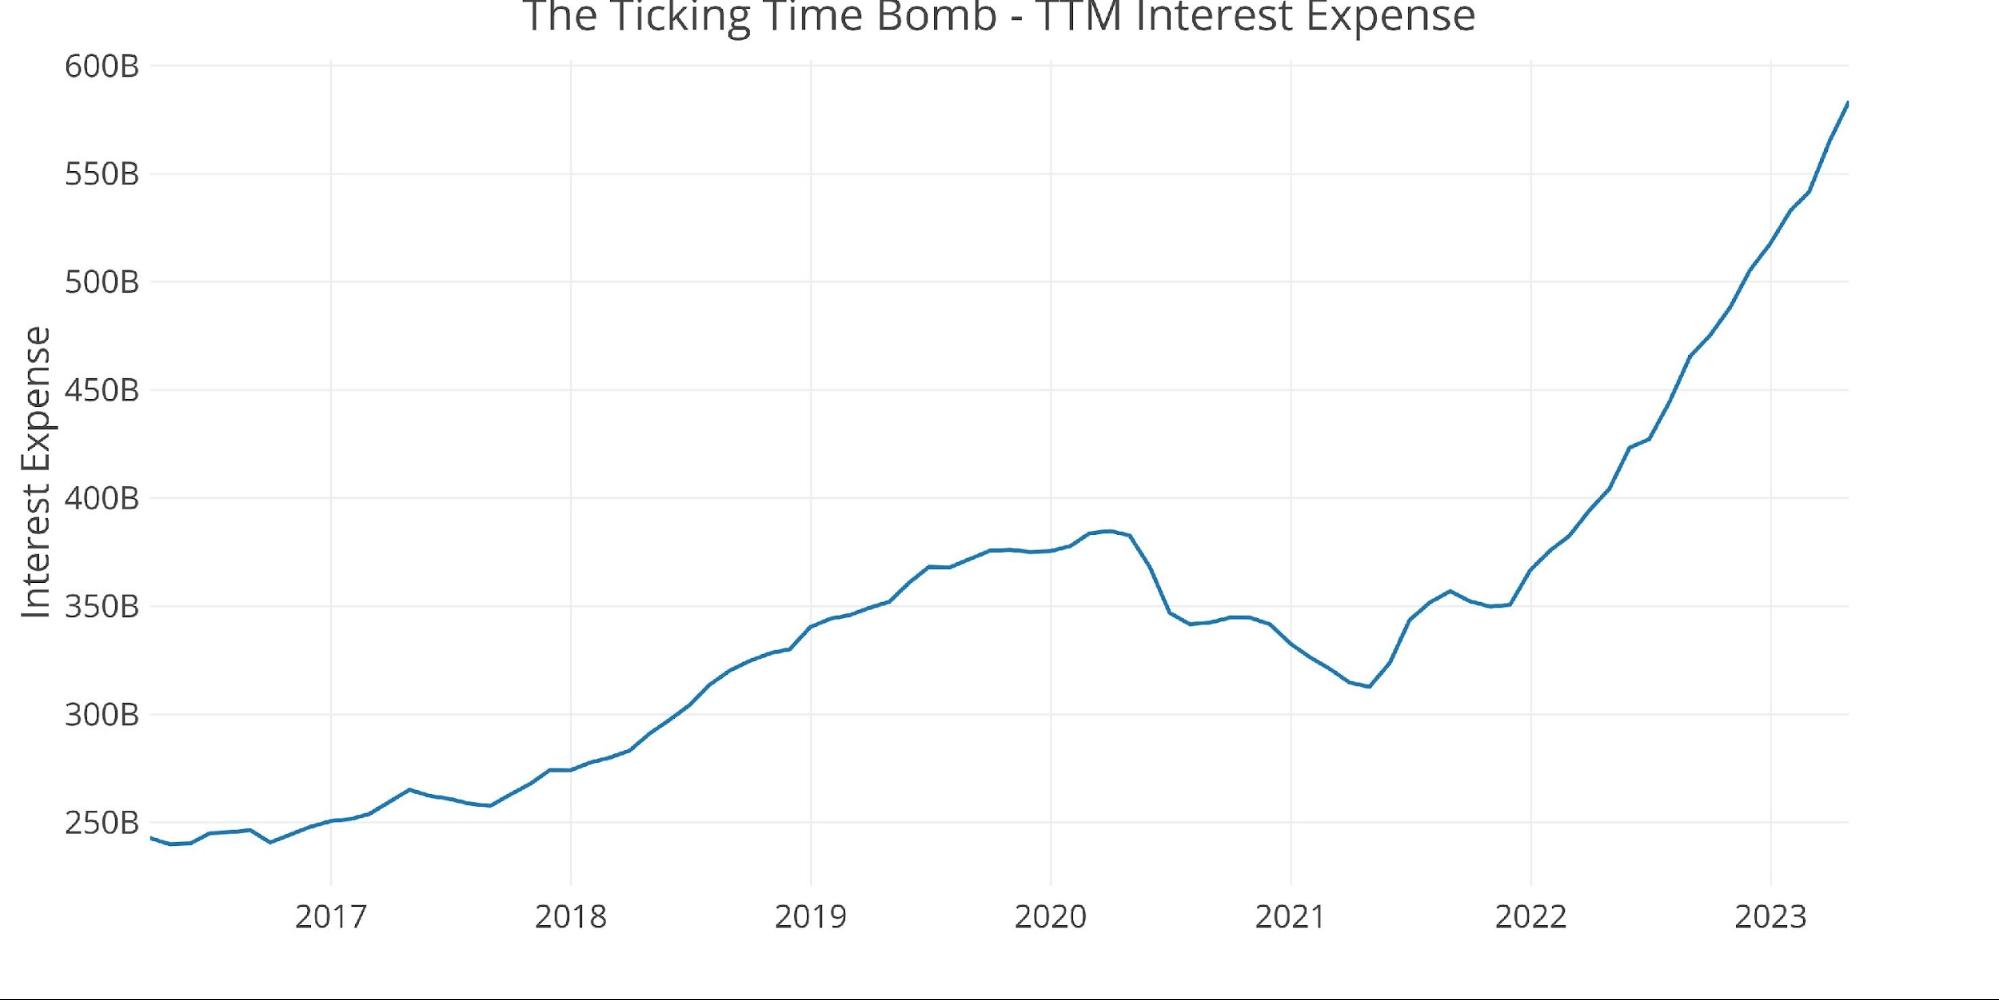
Figure: 8 TTM Interest Expense
The table below goes deeper into the numbers of each category. The key takeaways from the charts and table:
Outlays
-
- Almost all spending categories were down except for Social Security and Net Interest. Net Interest was up a whopping 42% YoY
-
- It’s possible that some spending fell due to the Treasury management of the debt ceiling and how to use cash
- Net interest of $62.7B annualizes to a $752.4B figure already!
-
- Medicare saw a big drop in monthly expenses but this is likely a one-time event
- Almost all spending categories were down except for Social Security and Net Interest. Net Interest was up a whopping 42% YoY
Receipts
-
- Individual Income Taxes fell an incredible 35.8% YoY
-
- A more discouraging trend (or encouraging if you are a taxpayer) is that Individual Tax Revenues were down on a TTM basis by 15%.
-
- All other revenue sources also fell YoY except for Social Security which was up 8.8%
- Individual Income Taxes fell an incredible 35.8% YoY
Total
-
- On a TTM basis – Outlays were up 7.4% with Receipts down 6%.
-
- This caused the TTM deficit to surge $739B or 61.6%!
-
- On a TTM basis – Outlays were up 7.4% with Receipts down 6%.
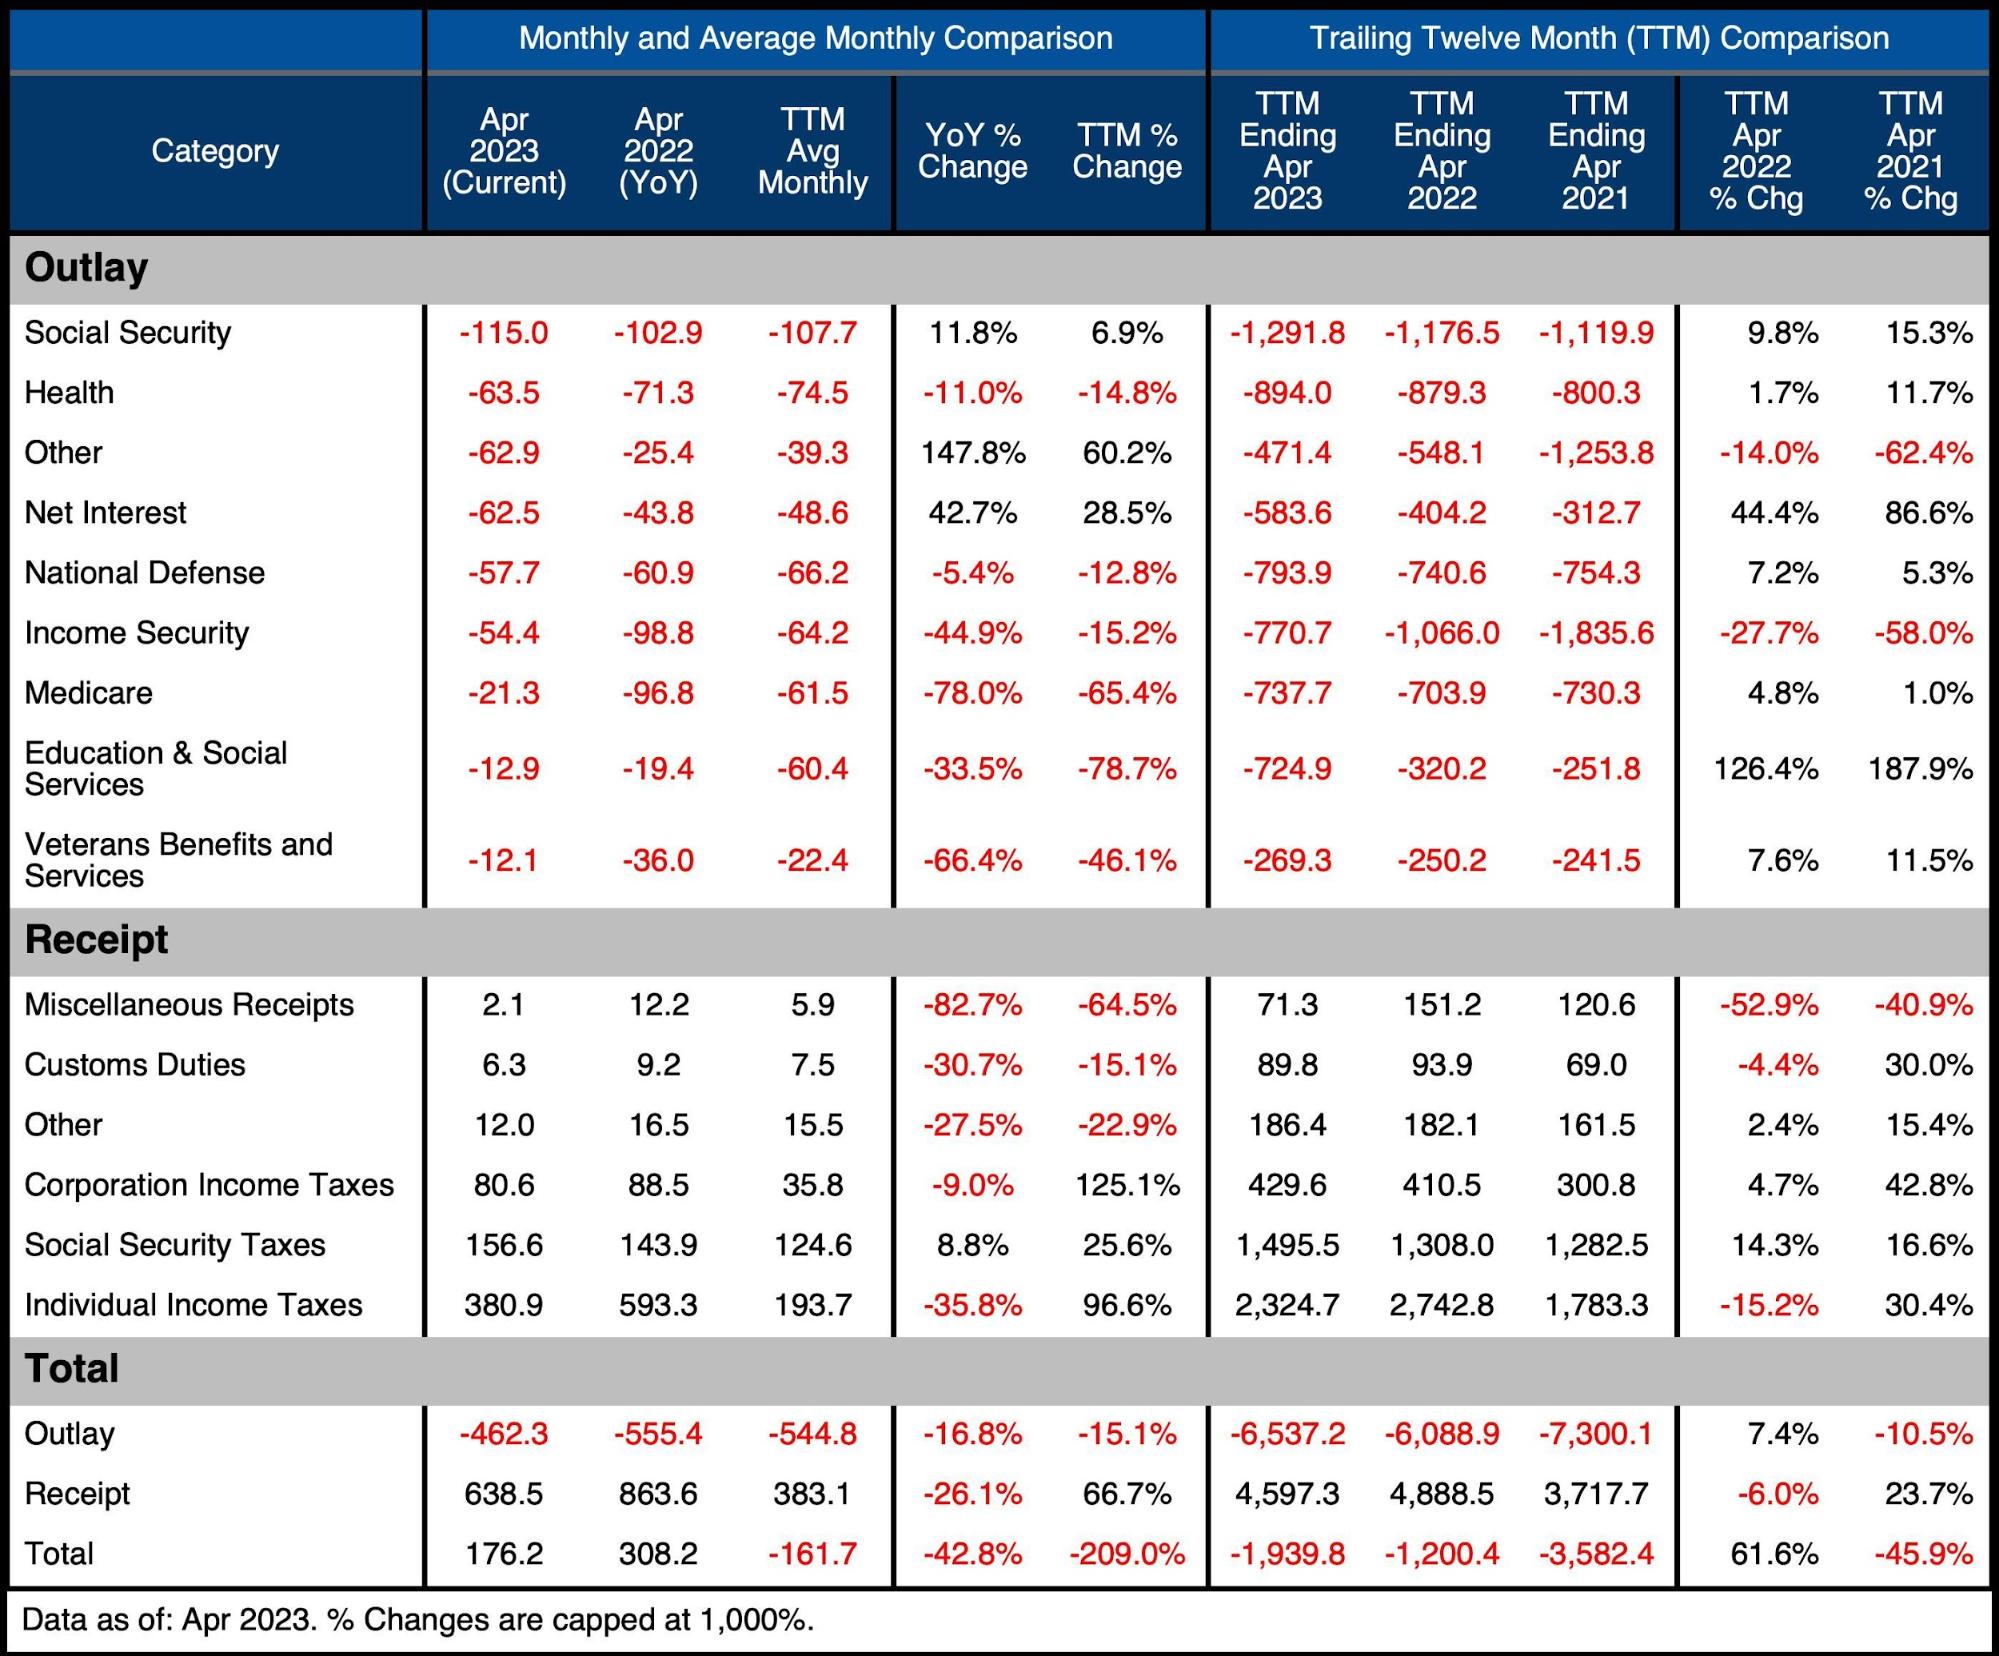
Figure: 9 US Budget Detail
Historical Perspective
Zooming out and looking over the history of the budget back to 1980 shows a complete picture. Both spending and revenue saw a big jump right at the beginning of Covid. Spending saw a retrenchment but has since reversed and started growing again. On the other side, revenue has now been flat for months, dropping in the latest month. This means that the recent tax windfalls that helped buffer the increase in spending have now waned as evidenced by the $1.9T TTM deficit.
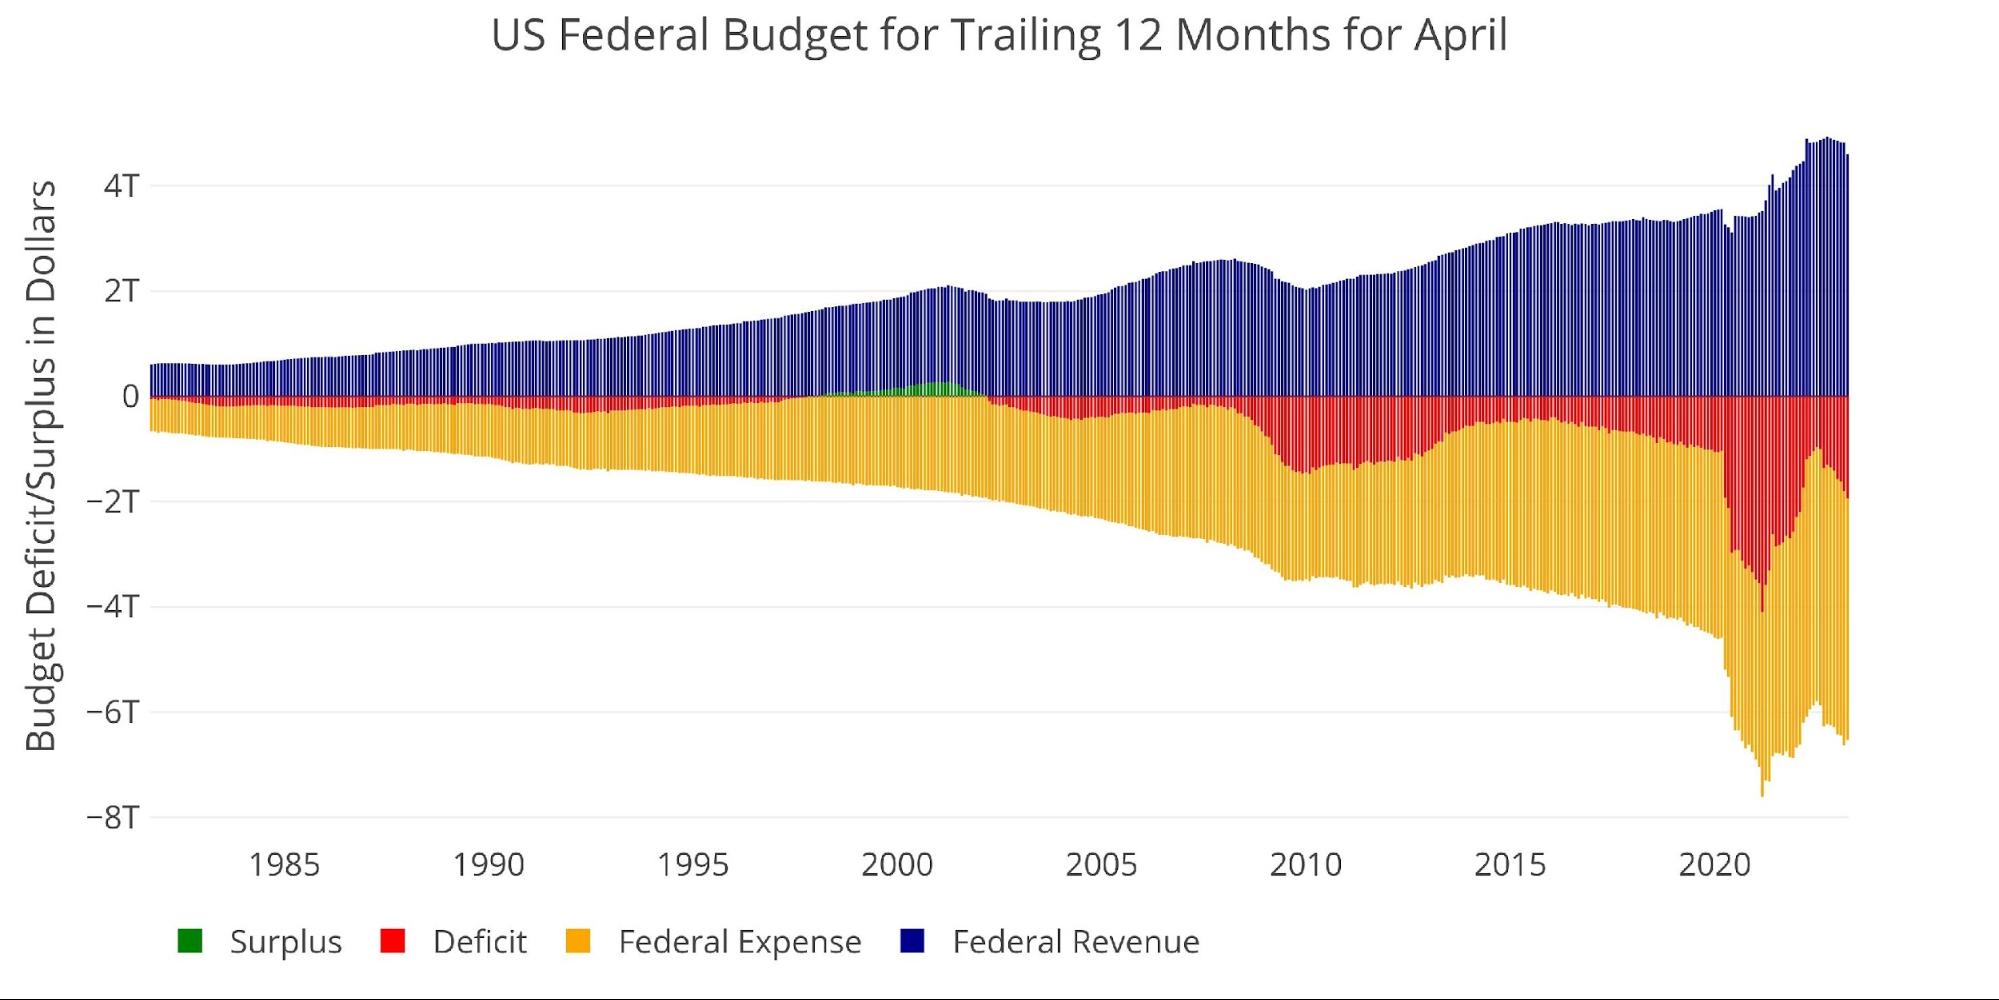
Figure: 10 Trailing 12 Months (TTM)
The next two charts zoom in on the recent periods to show the change when compared to pre-Covid.
As shown below, total Receipts have surged higher in the wake of the pandemic but have since come down.
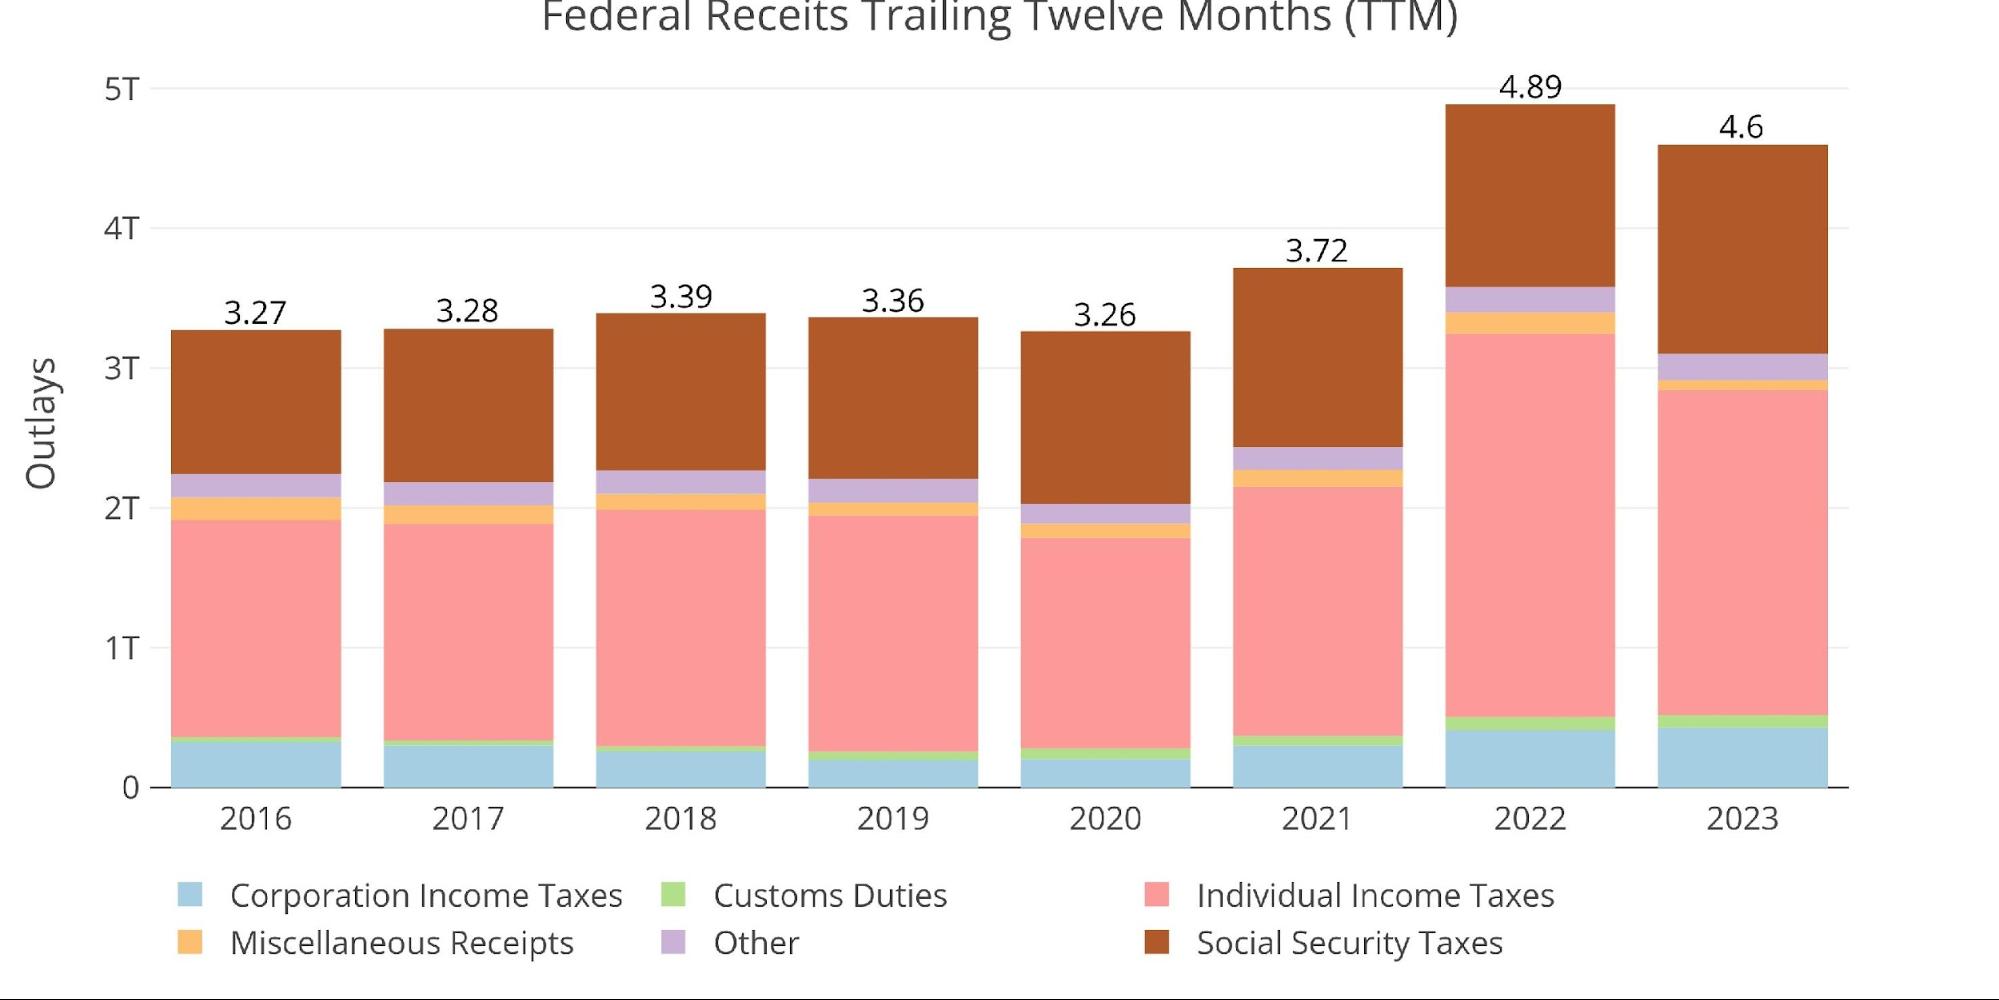
Figure: 11 Annual Federal Receipts
On the other side, expenditures surged earlier in the pandemic, dropped down some, but have now come back up.
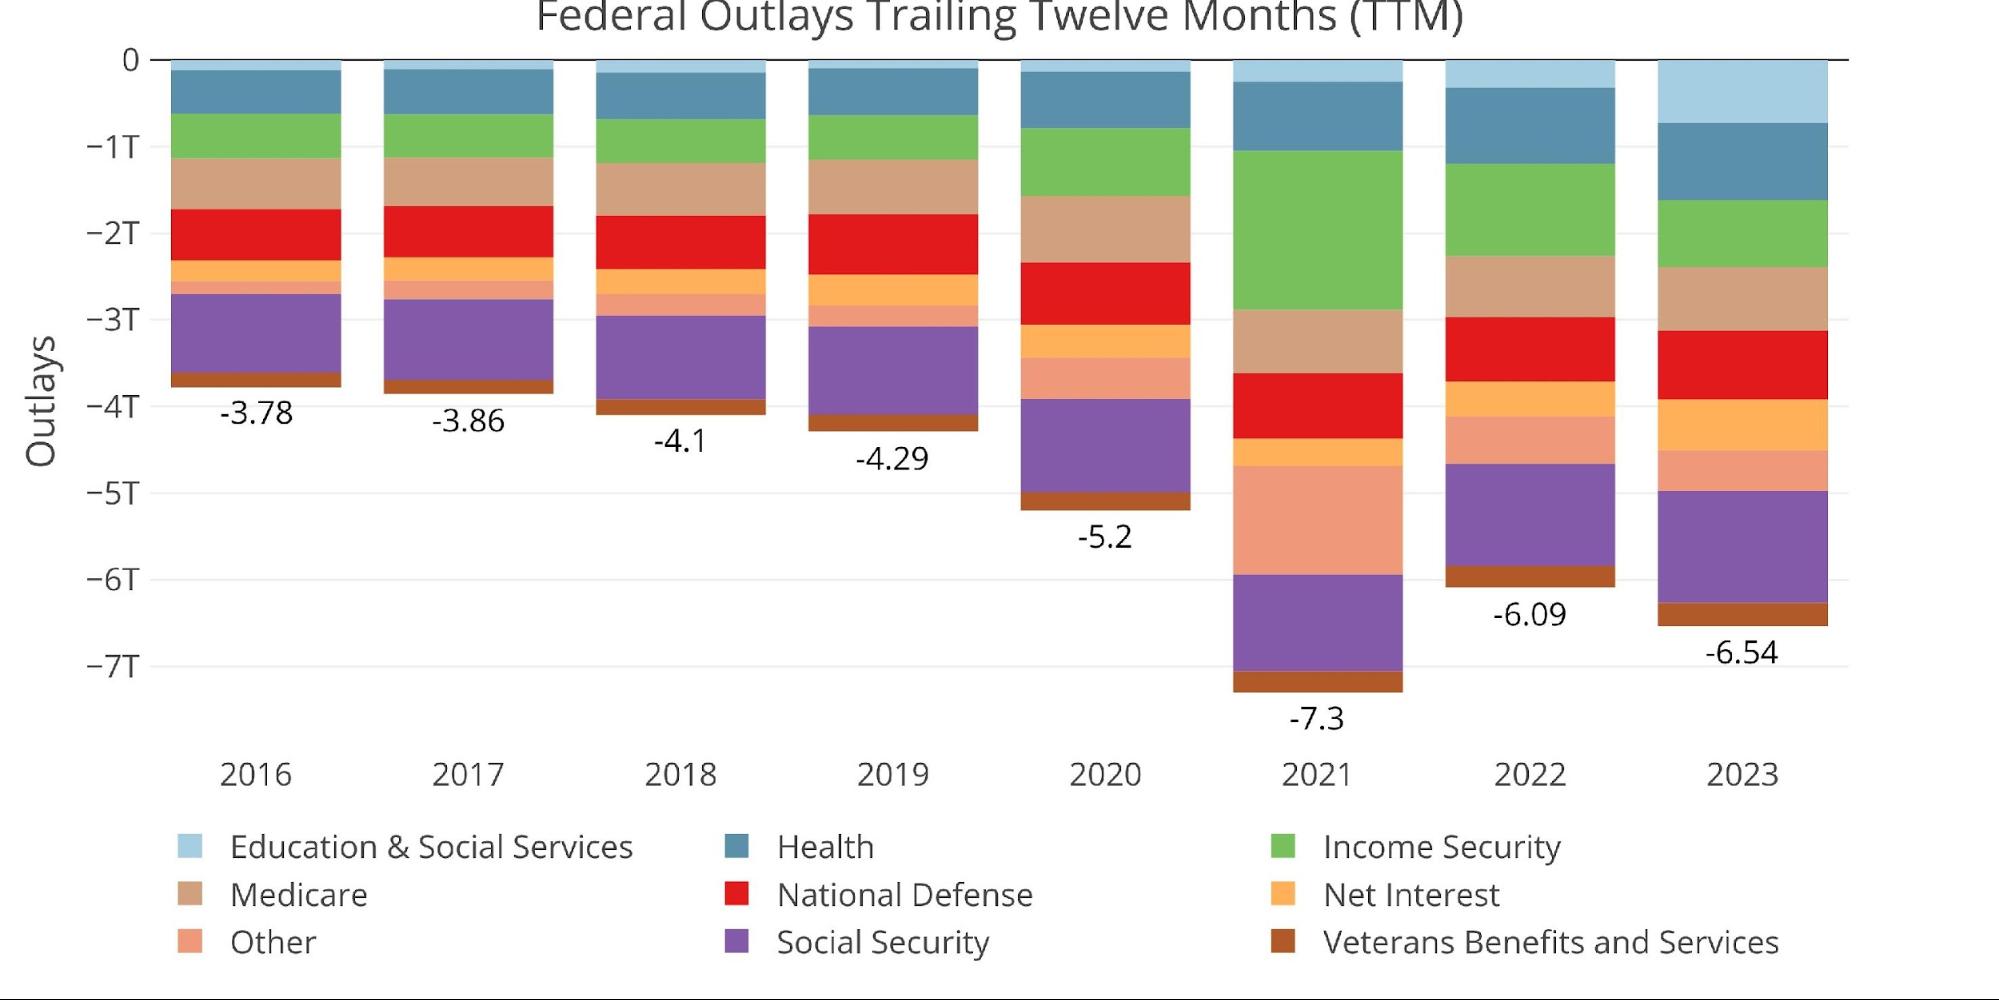
Figure: 12 Annual Federal Expenses
The view below shows the deficit as a percentage of GDP. As seen, the deficit spiked in response to Covid, retraced, but is now heading back up. The relative deficit is still below the 2009 level, but the 10% in 2009 was in the midst of the Great Recession. We are now at 7.3% and the meat of the current recession lies ahead. As tax revenues continue to fall, or at best flat-line, expenses are likely to surge. This will happen as GDP falls, expenses increase, and revenue falls.
Note: GDP Axis is set to log scale
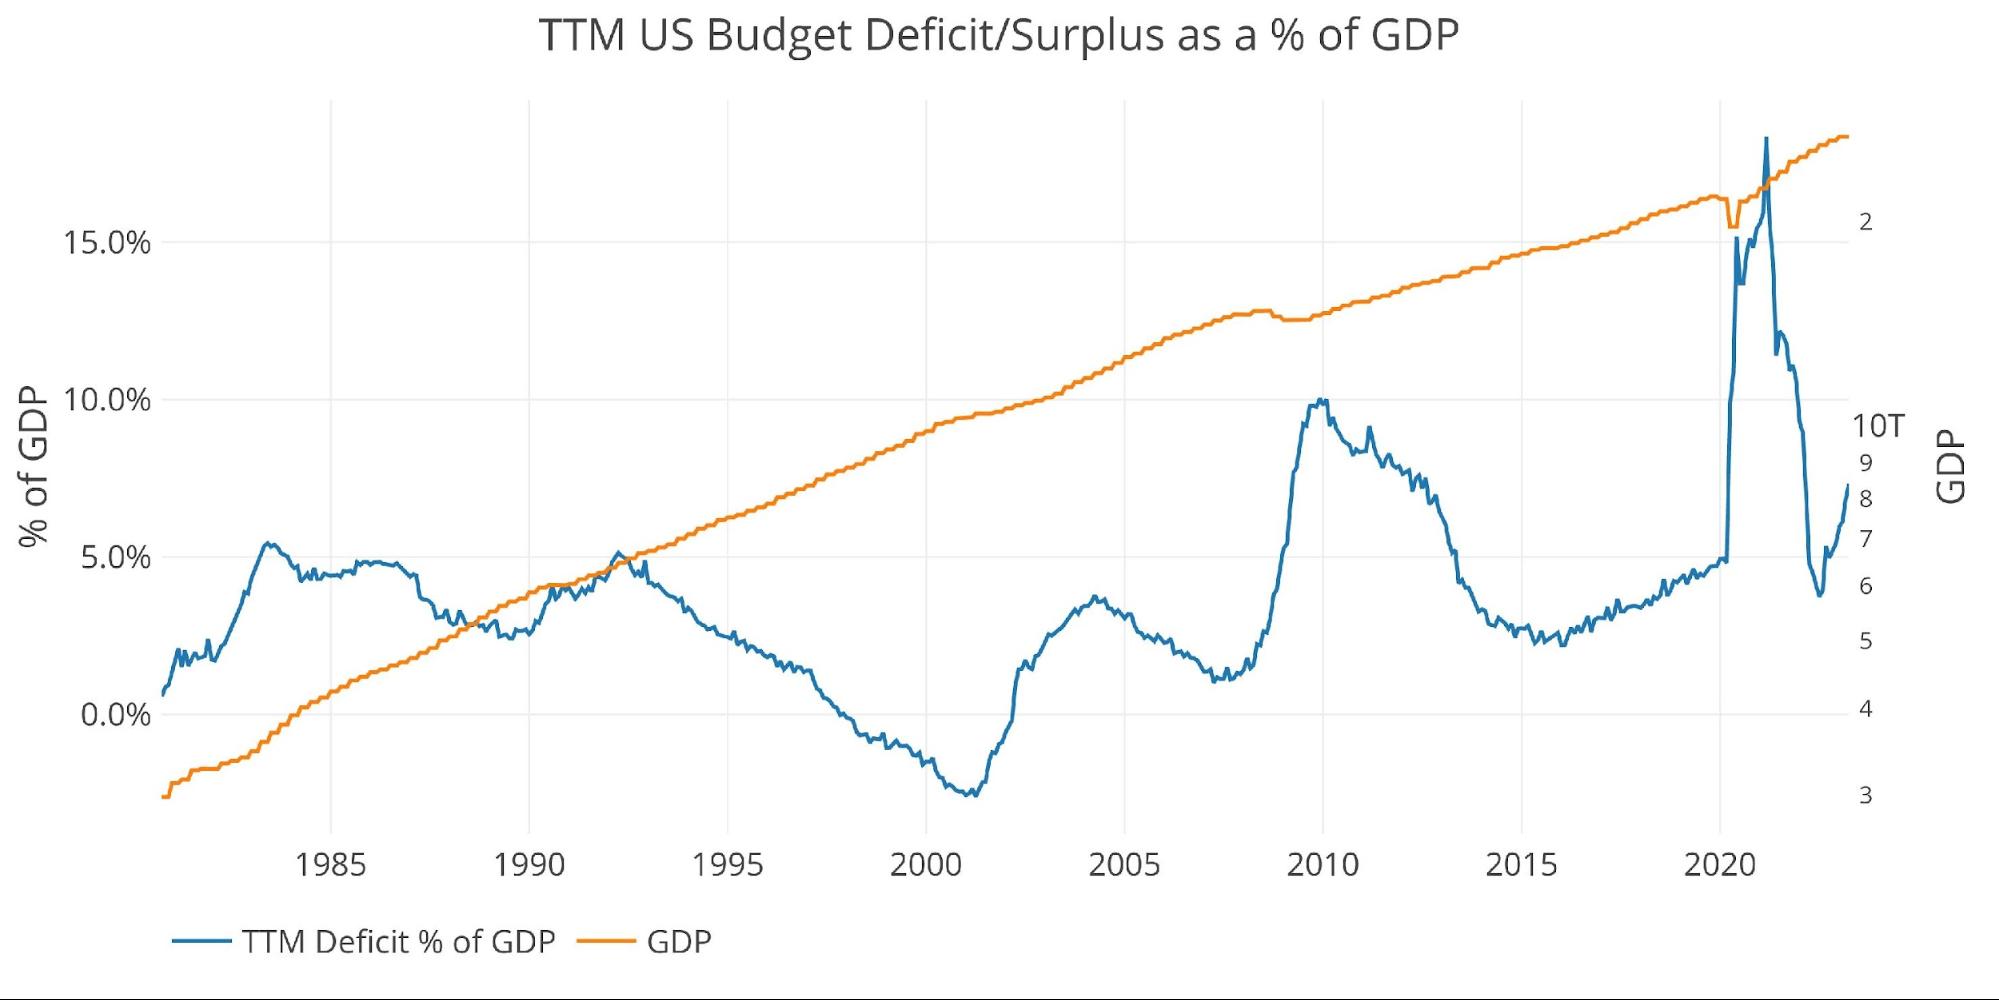
Figure: 13 TTM vs GDP
Finally, to compare the calendar year with previous calendar years (not fiscal budget years), the plot below shows the YTD numbers historically. The current year’s expenses trail only 2021 which included the Biden stimulus package. The net deficit is the largest behind only the 2020-2021 Covid surge.

Figure: 14 Year to Date
Wrapping Up
The record tax revenues in 2022 helped cover up an explosion in government spending. Those revenues are now declining but spending is not. This will very quickly make a terrible fiscal situation exponentially worse.
The Treasury will need to be issuing trillions of new debt with far fewer parties to absorb it. International buyers have left the market and the Fed is sidelined with their inflation fight. This leaves far fewer dollars chasing Treasury debt than the market has been accustomed to over the years. Eventually, the Fed will have to re-enter the market to keep the government solvent.
This is coming sooner rather than later. When the Fed re-enters, it should immediately become obvious the permanent position the Fed has put itself in… an economy addicted to cheap money that cannot survive long without out.
Data Source: Monthly Treasury Statement
Data Updated: Monthly on eighth business day
Last Updated: Period ending Apr 2023
US Debt interactive charts and graphs can always be found on the Exploring Finance dashboard: https://exploringfinance.shinyapps.io/USDebt/

Call 1-888-GOLD-160 and speak with a Precious Metals Specialist today!
Buka akaun dagangan patuh syariah anda di Weltrade.
Source link