The March Trade Deficit decreased for the first time in four months. The total deficit came in at -$64.2B, which is the second smallest deficit since January 2021.
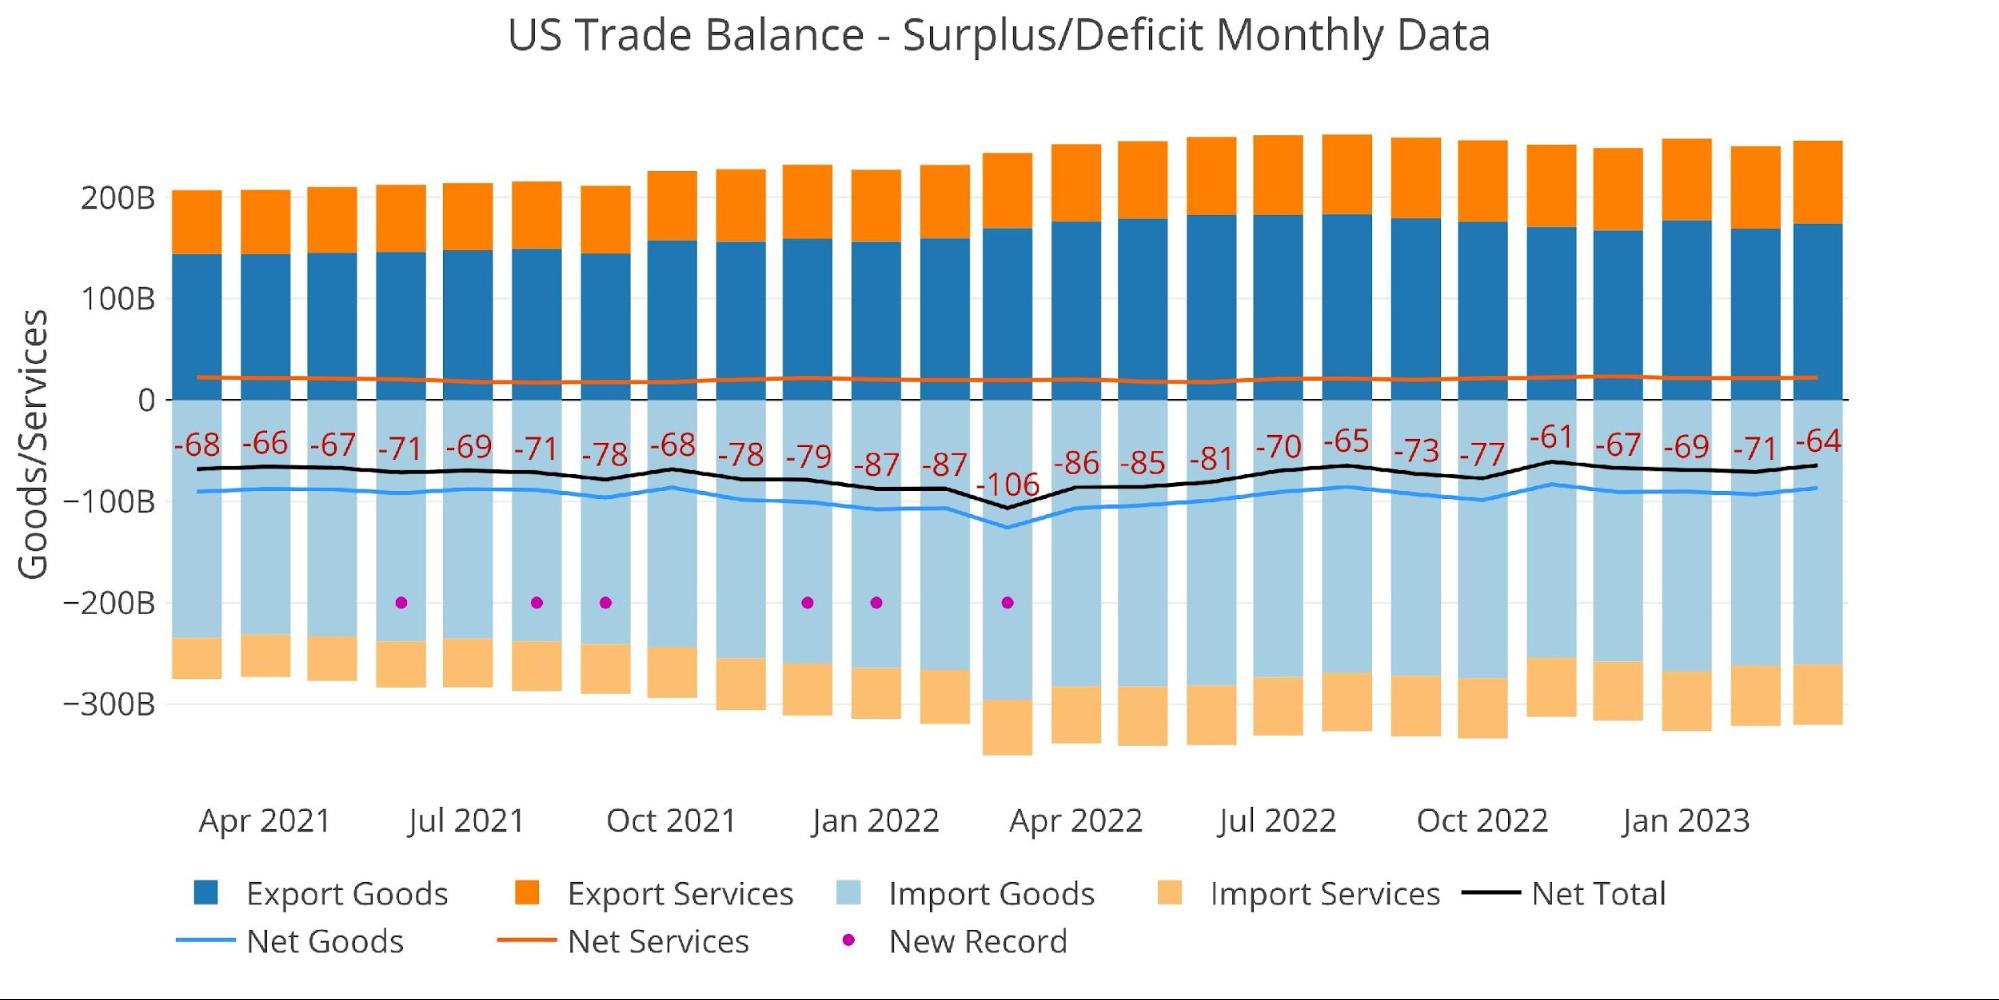
Figure: 1 Monthly Plot Detail
The table below provides detail.
Monthly Trade Deficit
-
- The fall was driven by a combined drop in Imports with a rise in Exports
-
- Specifically, Goods Imports fell by $1.2B while Goods Exports increased by $5.2B
- Services Imports and Exports both grew by $100M
-
- The fall in Net Goods was 7% while Net Services was mostly flat
- The fall was driven by a combined drop in Imports with a rise in Exports
Looking at Trailing Twelve Month:
-
- Exports and Imports have grown significantly over the last year, but Exported Goods are growing faster than Imported Goods
-
- This led to a 3.8% decline in the Net Goods Deficit
-
- Services Imports are growing faster than Services Exports on a relative basis, but because Services Exports was larger to begin with, the Net Services Surplus increased over the year
- With the TTM Exports Deficit falling and the TTM Imports Surplus rising, the Net Deficit fell 6.6% or $61.3B
- Exports and Imports have grown significantly over the last year, but Exported Goods are growing faster than Imported Goods
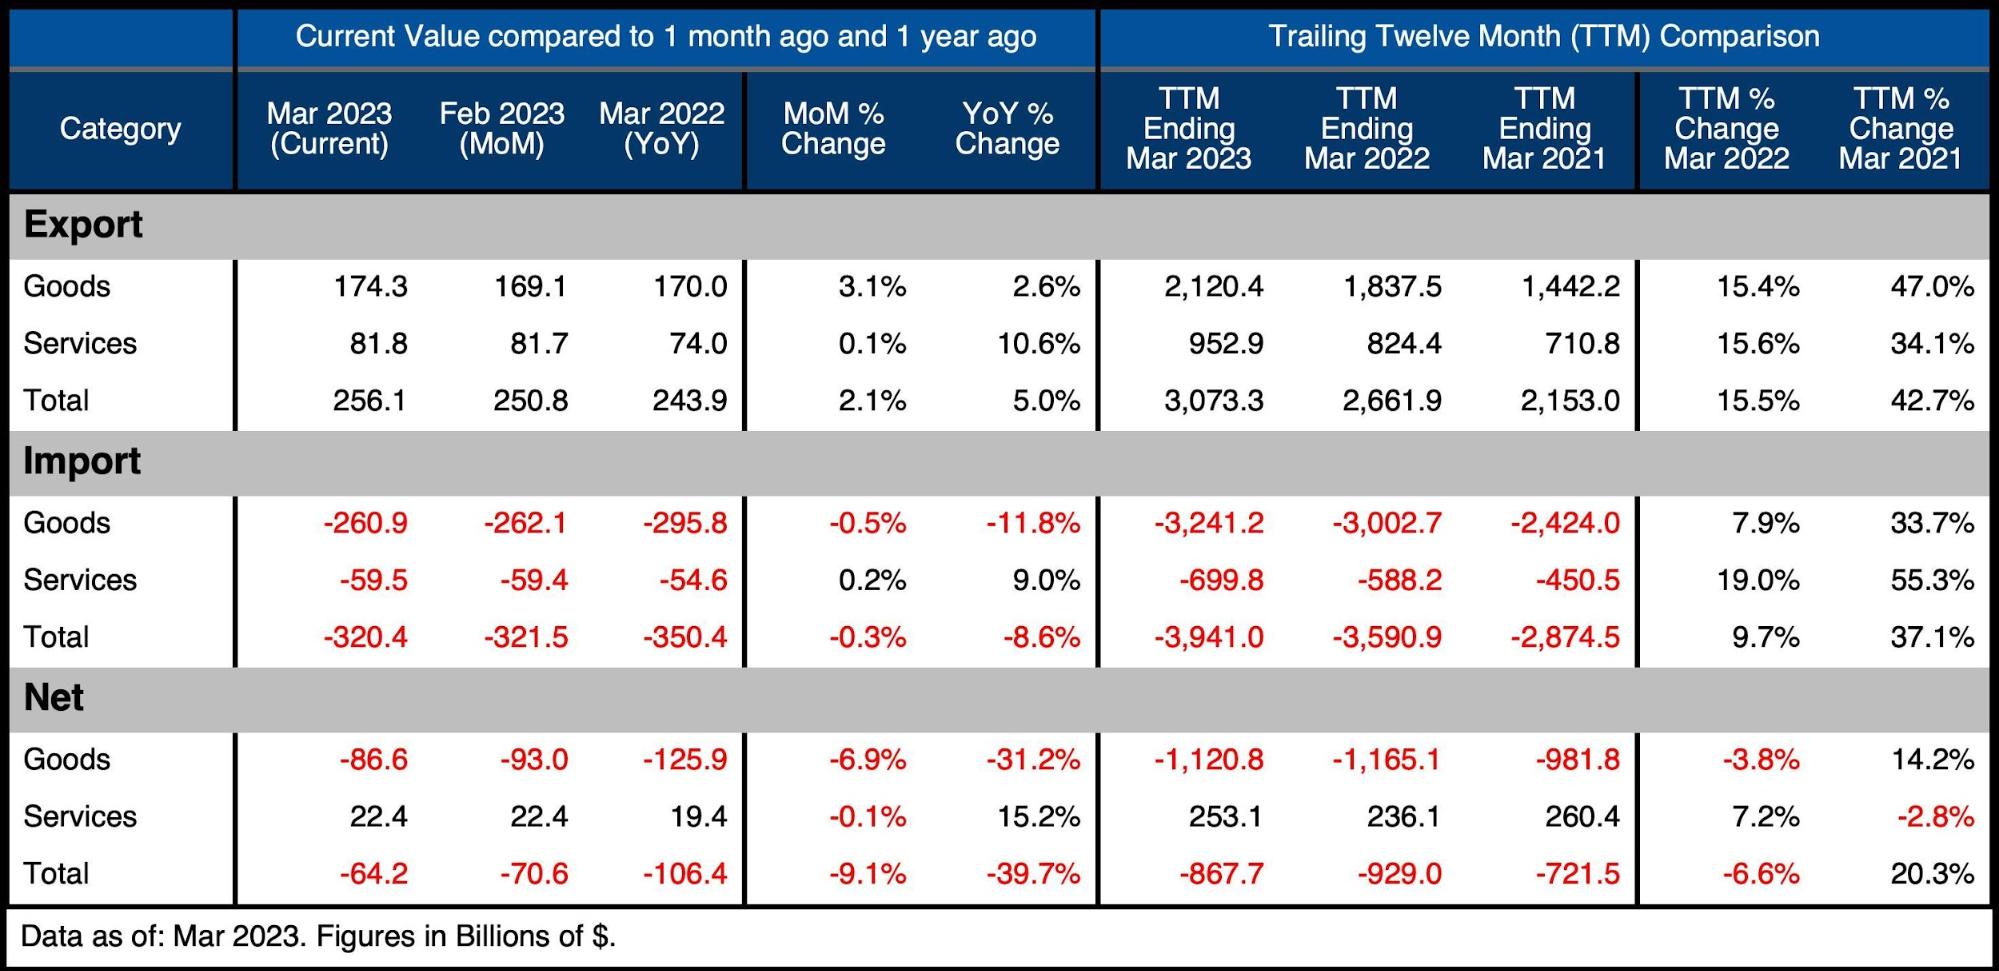
Figure: 2 Trade Balance Detail
Historical Perspective
Zooming out and focusing on the net numbers shows the longer-term trend. The latest month suggests the trend of a shrinking deficit is not yet over. The deficit numbers have returned to a much choppier month-over-month look which was pretty standard before Covid. If the US economy and USD continue to weaken, driving Imports down and Exports up, the Trade Deficit could return to pre-Covid levels soon.
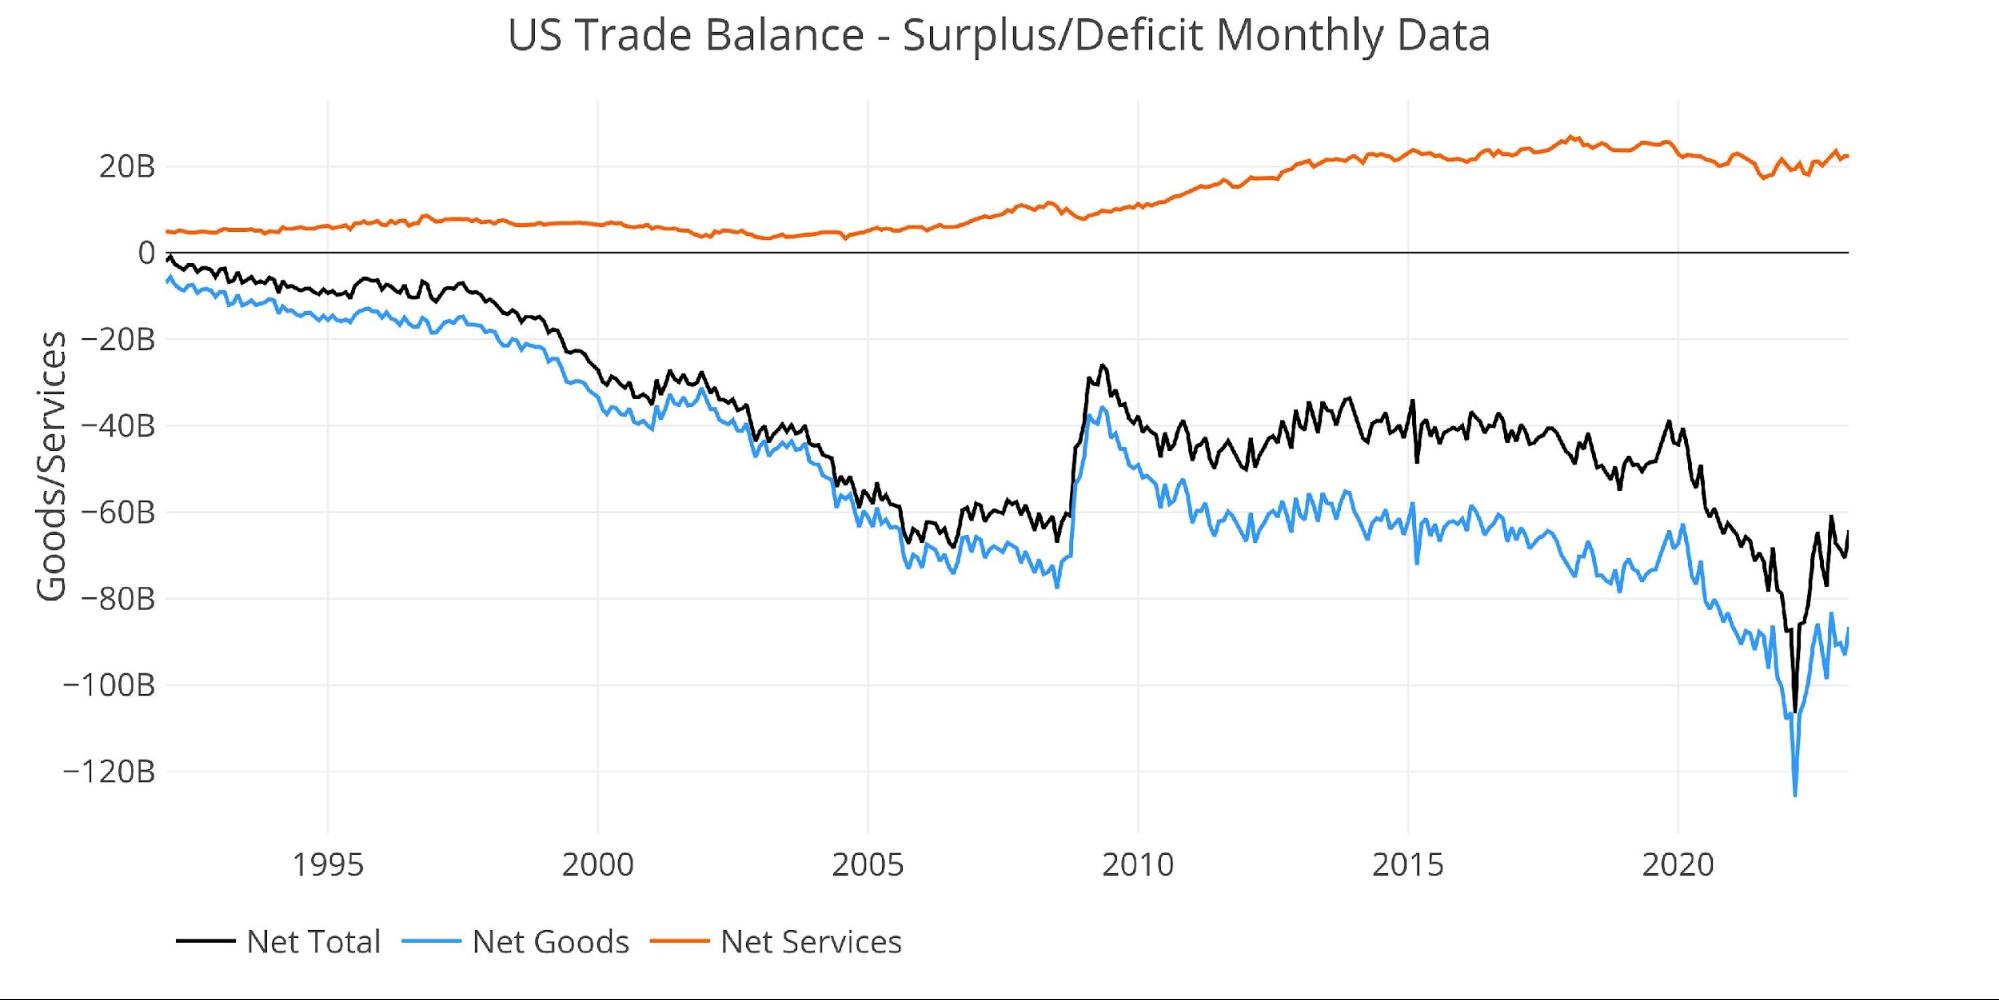
Figure: 3 Historical Net Trade Balance
That said, the Services Surplus seems to have stabilized at a new level. After Net Services hovered around 35% of Exported Services for some time, it has now found a new range between 25% and 30% suggesting the Services Surplus has faced a relative contraction.
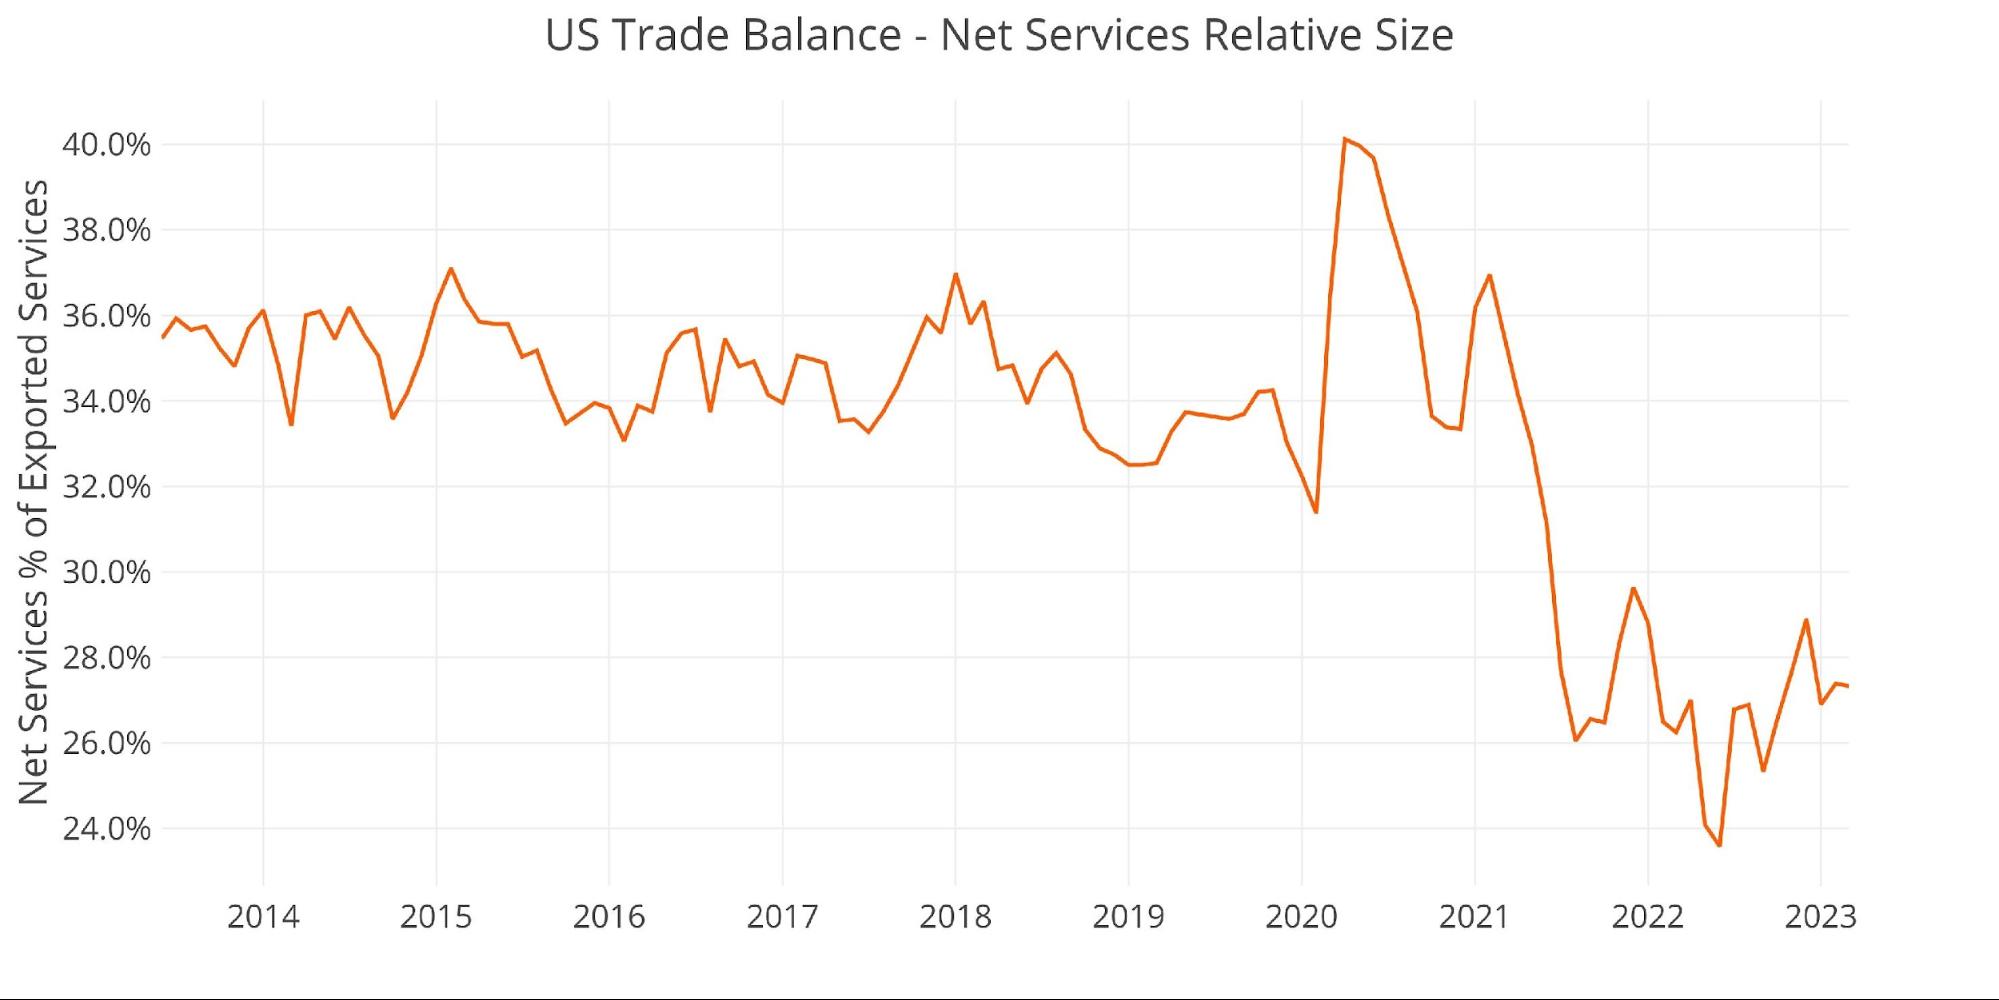
Figure: 4 Historical Services Surplus
To put it all together and remove some of the noise, the next plot below shows the Trailing Twelve Month (TTM) values for each month (i.e., each period represents the summation of the previous 12-months). The global surge in consumption post-Covid is clear to see below, or, more likely, the global increase in prices. The black line is showing a mild recovery on a TTM basis as noted above.
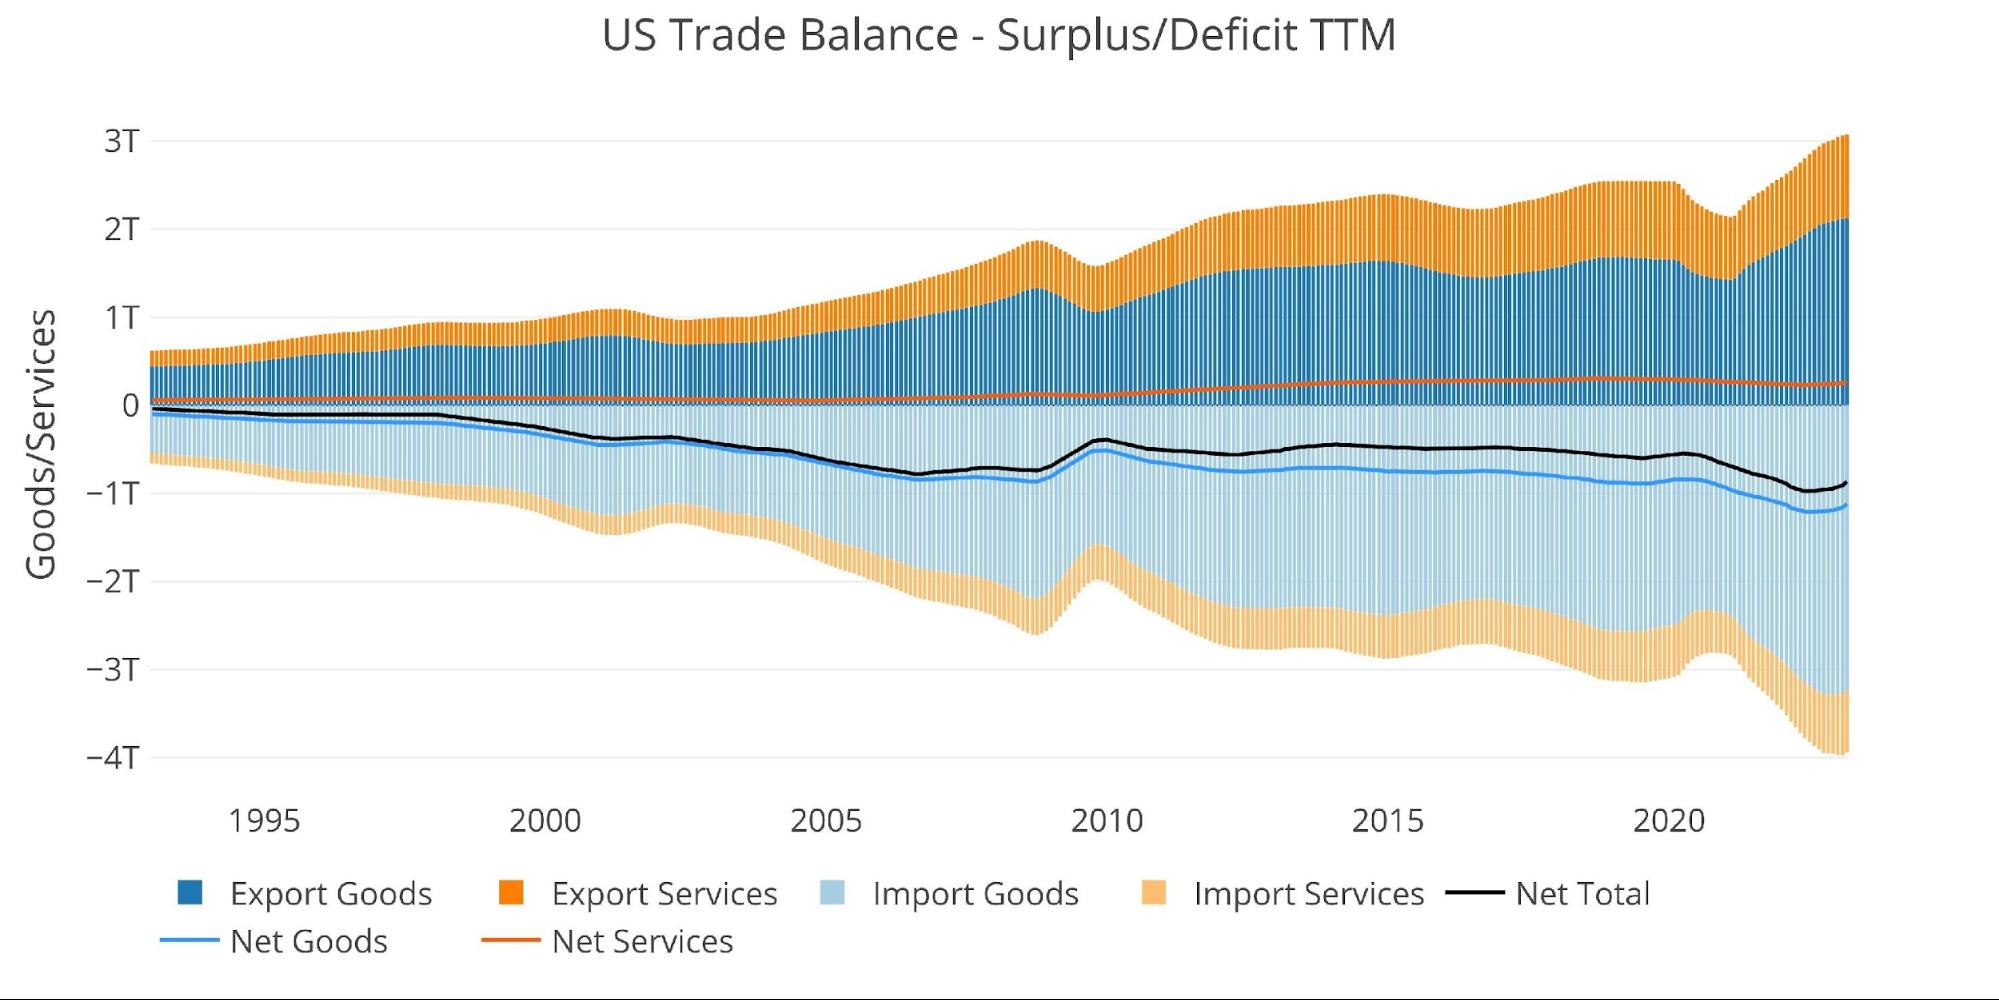
Figure: 5 Trailing 12 Months (TTM)
Although the TTM Net Trade Deficit is near historical highs, it can be put in perspective by comparing the value to US GDP. As the chart below shows, the current records are still below the 2006 highs before the Great Financial Crisis.
The current value of 3.28% is moving back down but is still well above the 2.5% from before Covid.
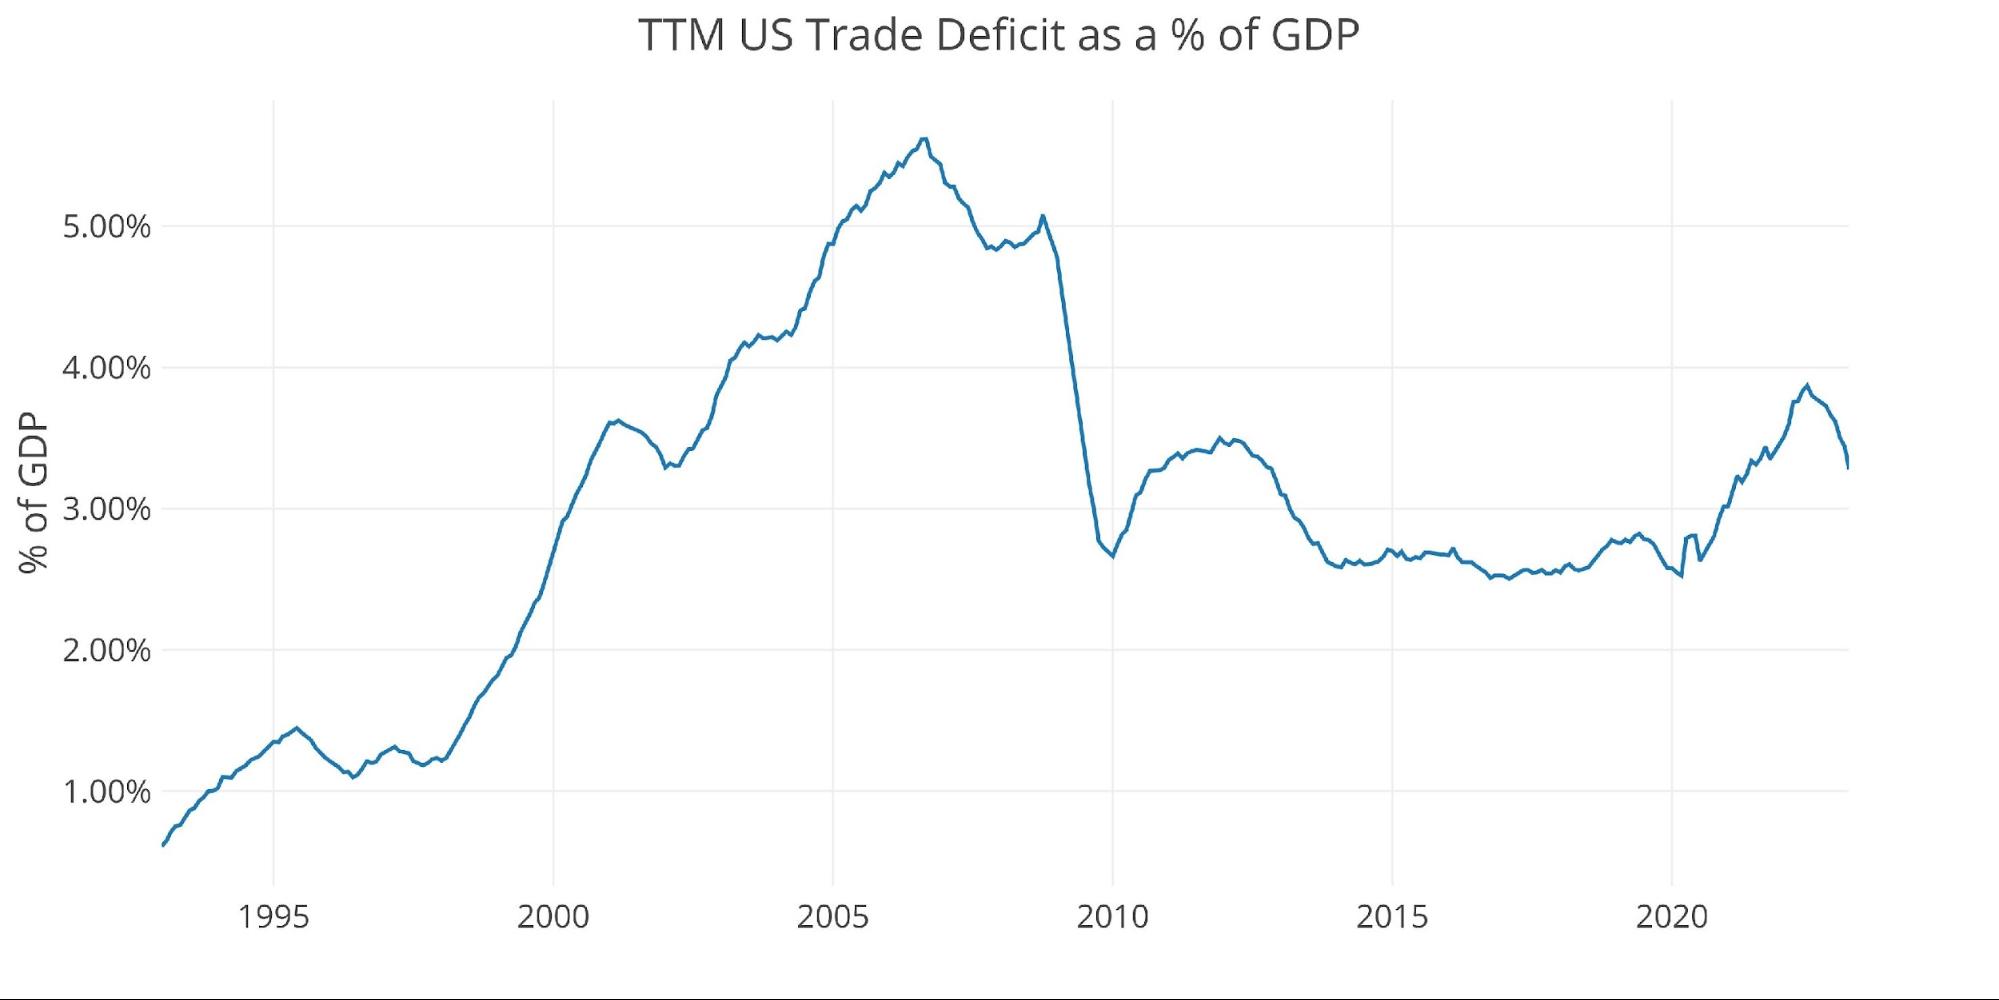
Figure: 6 TTM vs GDP
The chart below shows the YTD values. Total Exports have actually increased while total Imports have decreased when compared to the same period last year.
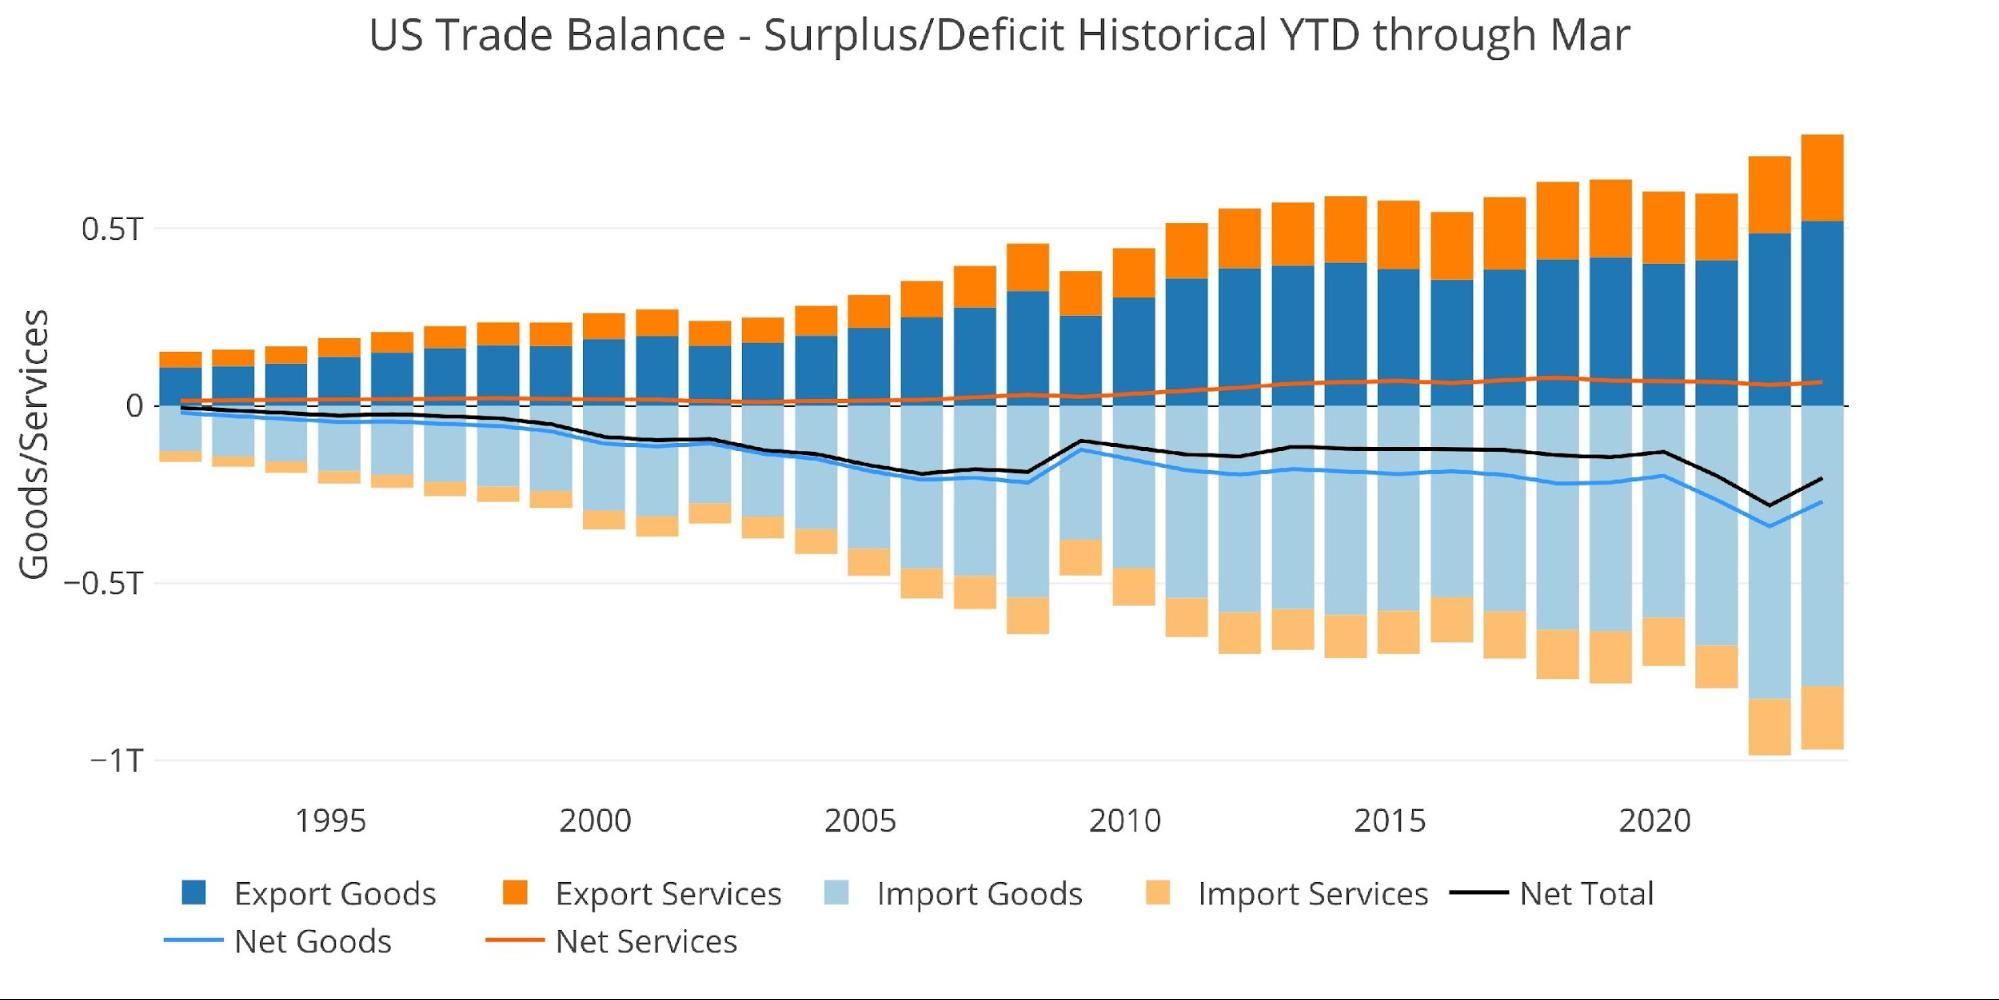
Figure: 7 Year to Date
Wrapping Up
The Trade Deficit is down from the records set last year, but the US is still printing very large Deficits relative to history. It is not totally surprising to see the current trend. There could be a few reasons for falling Imports and rising Exports. It’s safe to rule out increased domestic production and productivity. It’s more likely a combination of a falling dollar and rising inflation.
Rising inflation has taken a bite out of American incomes which leaves less money for goods. This has shown up as a decrease in Imported Goods. The falling US dollar has also made US goods more attractive to foreigners. This explains why Exports have increased.
This is a trend that could continue. As the US enters recession, the Fed gives up its inflation fight, and the world moves to de-dollarize… it will be harder for US consumers to continue running up massive trade deficits. If anything, all the dollars out there will likely come back to the US, making the inflation problem worse.
It is wise to diversify away from the dollar and maintain purchasing power. The best way to do this is to own precious metals.
Data Source: https://fred.stlouisfed.org/series/BOPGSTB
Data Updated: Monthly on one month lag
Last Updated: May 04, 2023, for Mar 2023
US Debt interactive charts and graphs can always be found on the Exploring Finance dashboard: https://exploringfinance.shinyapps.io/USDebt/

Call 1-888-GOLD-160 and speak with a Precious Metals Specialist today!
Buka akaun dagangan patuh syariah anda di Weltrade.
Source link