
As discussed last month, it is getting harder to take all the BLS data as fact. This month, some of the data is a bit closer in line, but the QECW report seemed to show a big deviation (more below).
Let’s start with the Household Survey. Last year the HH survey trailed the headline number until December and then saw a miraculous recovery in both Dec and Jan. This February, the Household Survey represented 57% of the Headline number, coming in at 177k vs 311k. 177k is a much less impressive figure!
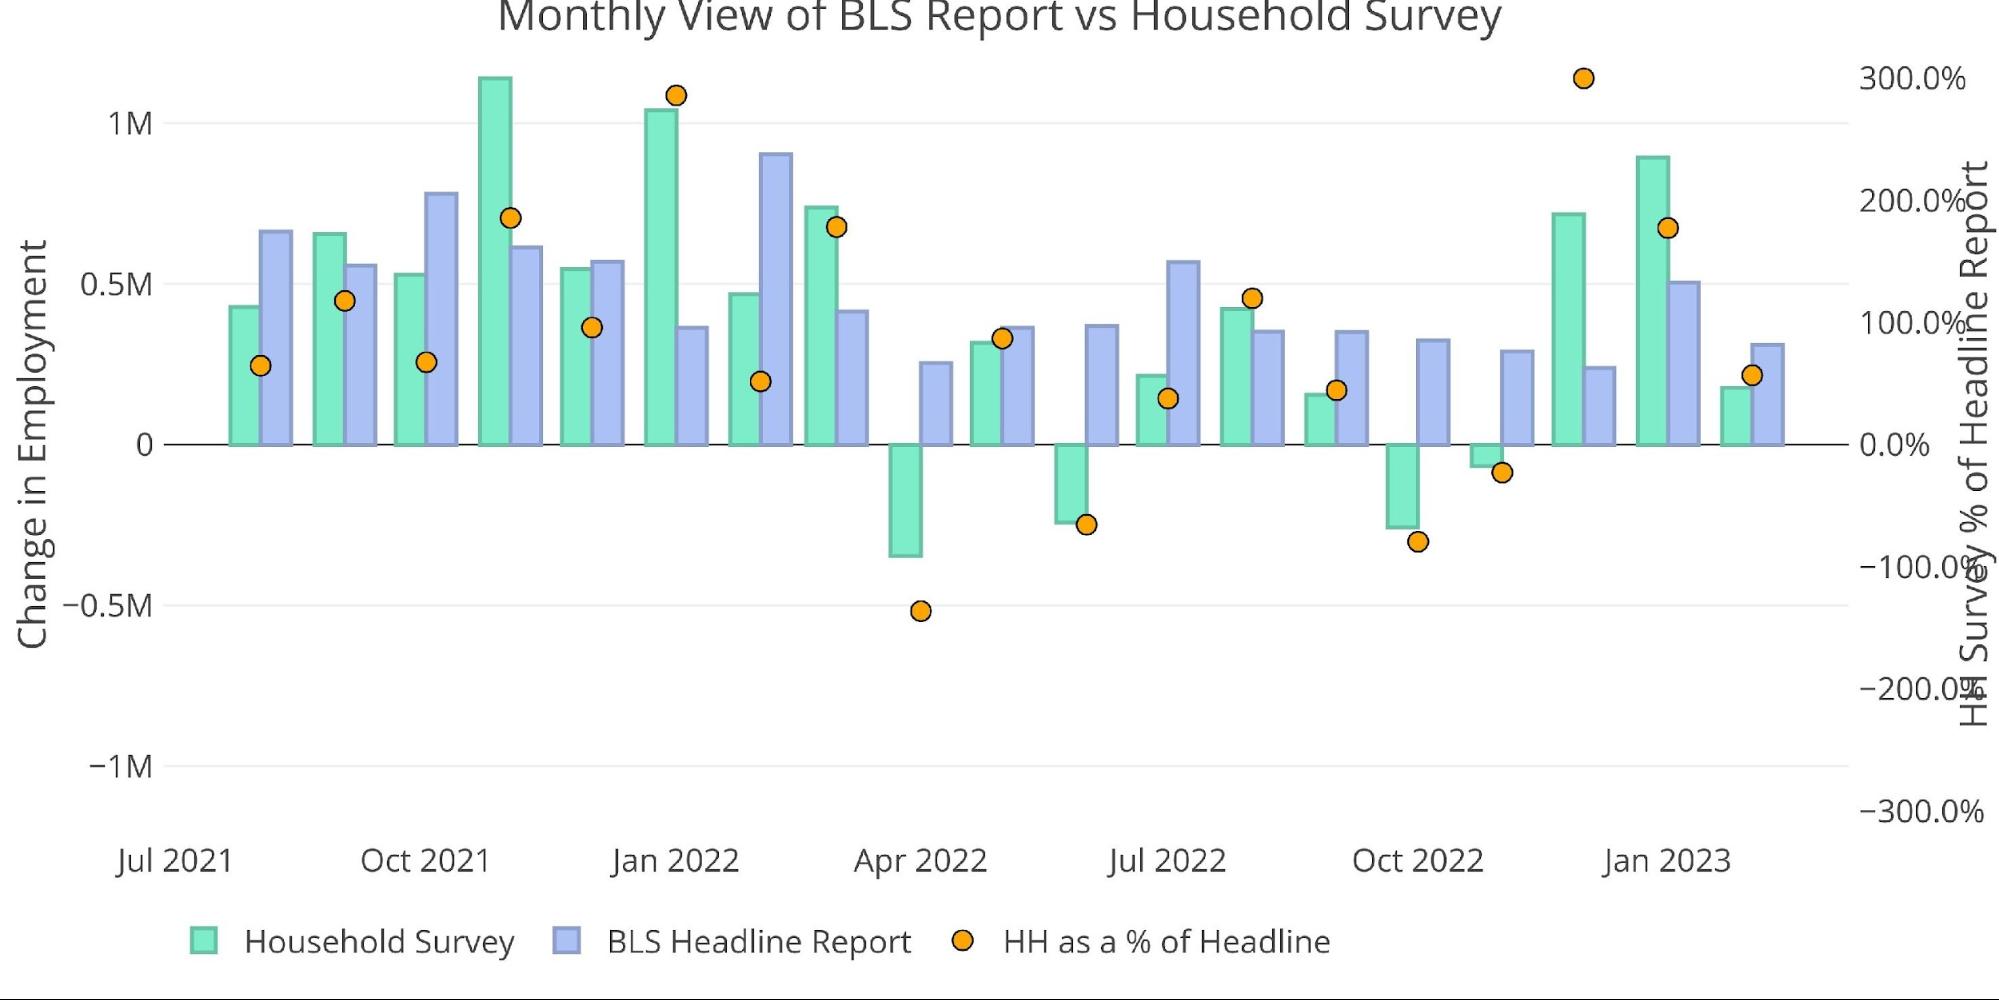
Figure: 1 Primary Report vs Household Survey – Monthly
Looking at an annual basis, the Household survey is still outperforming the Headline number because of the massive deviation in January. Time will tell if the Household Survey starts to underperform again.
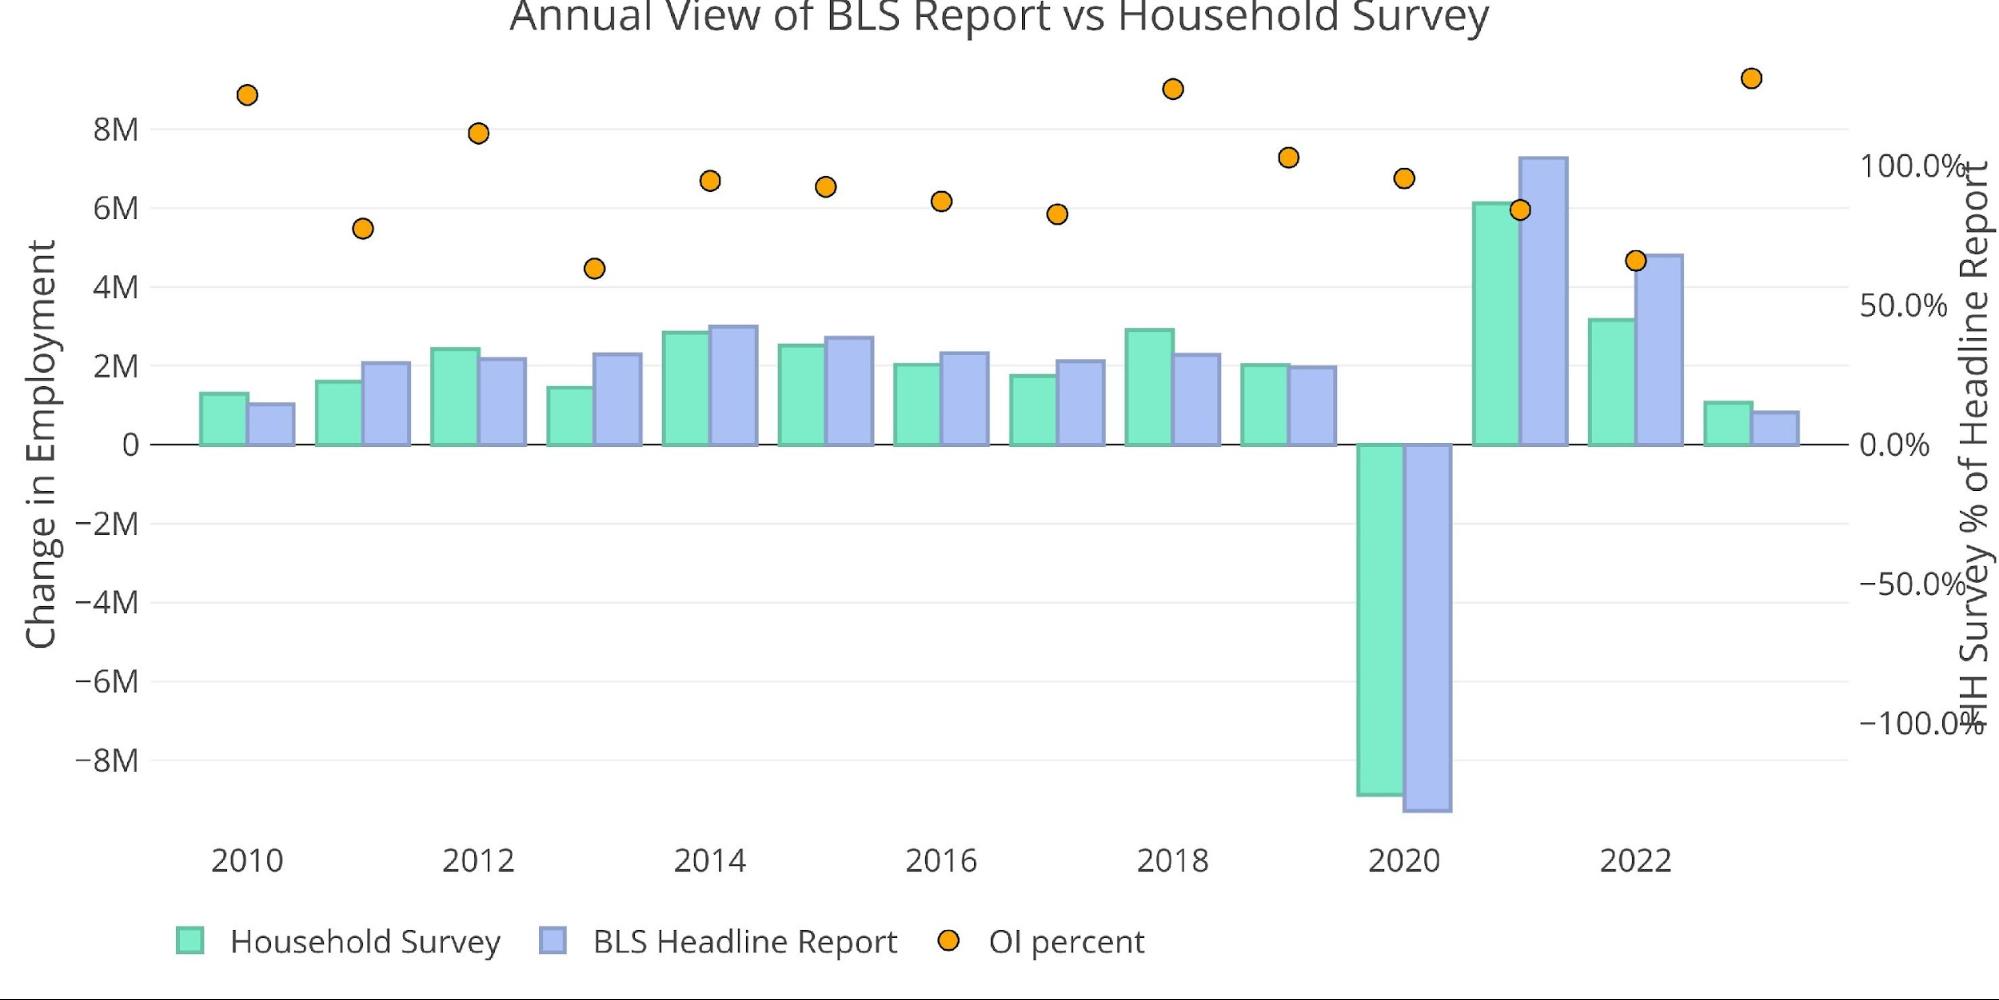
Figure: 2 Primary Report vs Household Survey – Annual
There is another report published by the BLS called the Quarterly Census of Employment and Wages (QECW). According to the BLS, this is a far more accurate and rigorous report covering 95% of jobs available at a highly detailed level. Due to the rigor, the report is released quarterly on a 7-month lag. The latest report was published at the end of February to show Q3 2022.
Below are the monthly numbers. Similar to what we saw with the Household report, the QECW has caught up in a big way to the Headline number. In fact, going back 24 months shows that the most recent release had the largest deviation from the Headline number in all three months.

Figure: 3 Primary Report vs QCEW – Yearly
The overperformance in August and September shown above has brought the QECW in line with the Headline number on an annual basis (Jan – Sep is shown for 2022). The QECW is now 92% of the Headline number.

Figure: 4 Primary Report vs QCEW – Yearly
The BLS also publishes the data behind their Birth/Death assumptions. These are the jobs that the BLS assumes based on companies starting or closing. While the data is not seasonally adjusted, it directly impacts the Headline Report. The chart below shows the impact of Birth/Death jobs on the total number for the last several months.
In January, there was a decrease of 144k thousand jobs, but February has made up for that loss with 176k jobs added. So yes, in the current environment, the BLS is assuming that new companies are forming and creating jobs on net in 2023.

Figure: 5 Primary Unadjusted Report With Birth Death Assumptions – Monthly
On an annual basis, the number is still flat on the year when compared to previous years. It will be interesting to see if this number becomes more positive in the months ahead, even against the current climate.
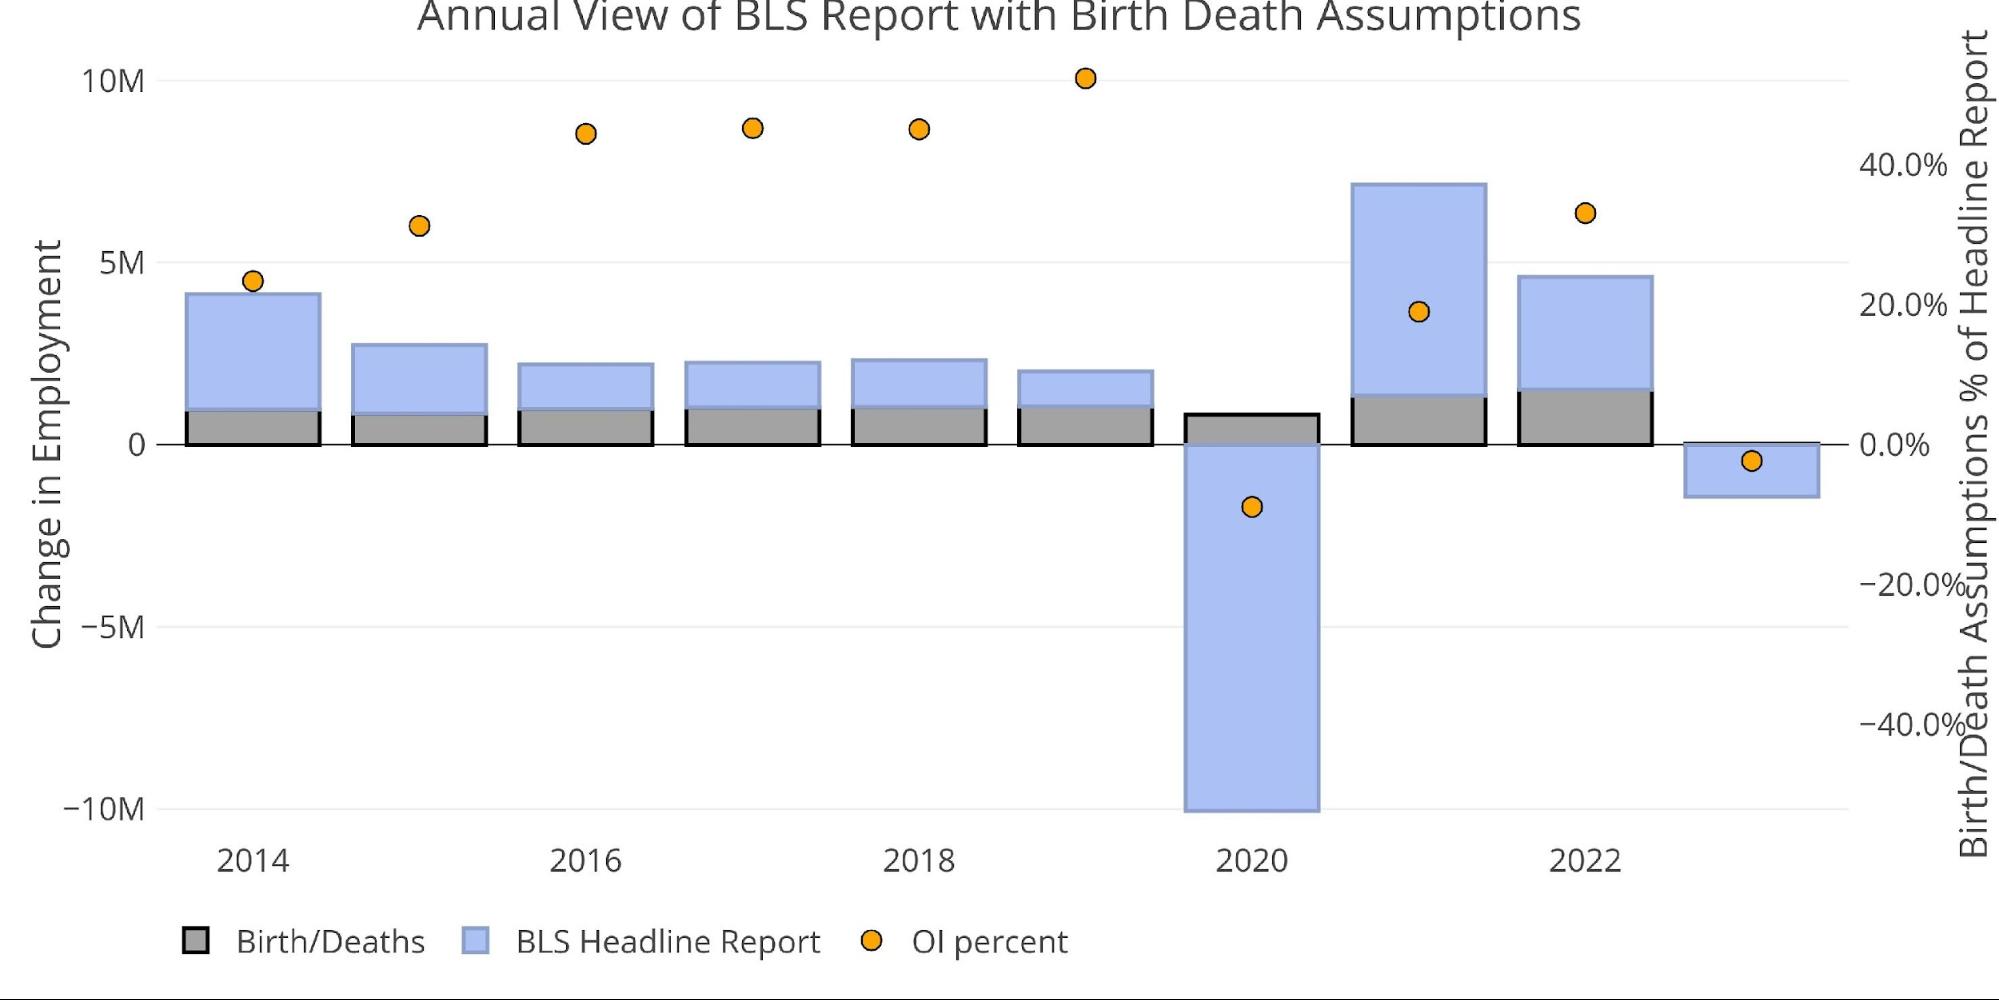
Figure: 6 Primary Unadjusted Report With Birth Death Assumptions – Annual
Digging Into the Report
This jobs report was another beat, with 311k jobs being added, even as the unemployment rate moved up from 3.4% to 3.6% as the labor force participation rate ticked up from 62.4% to 62.5%.
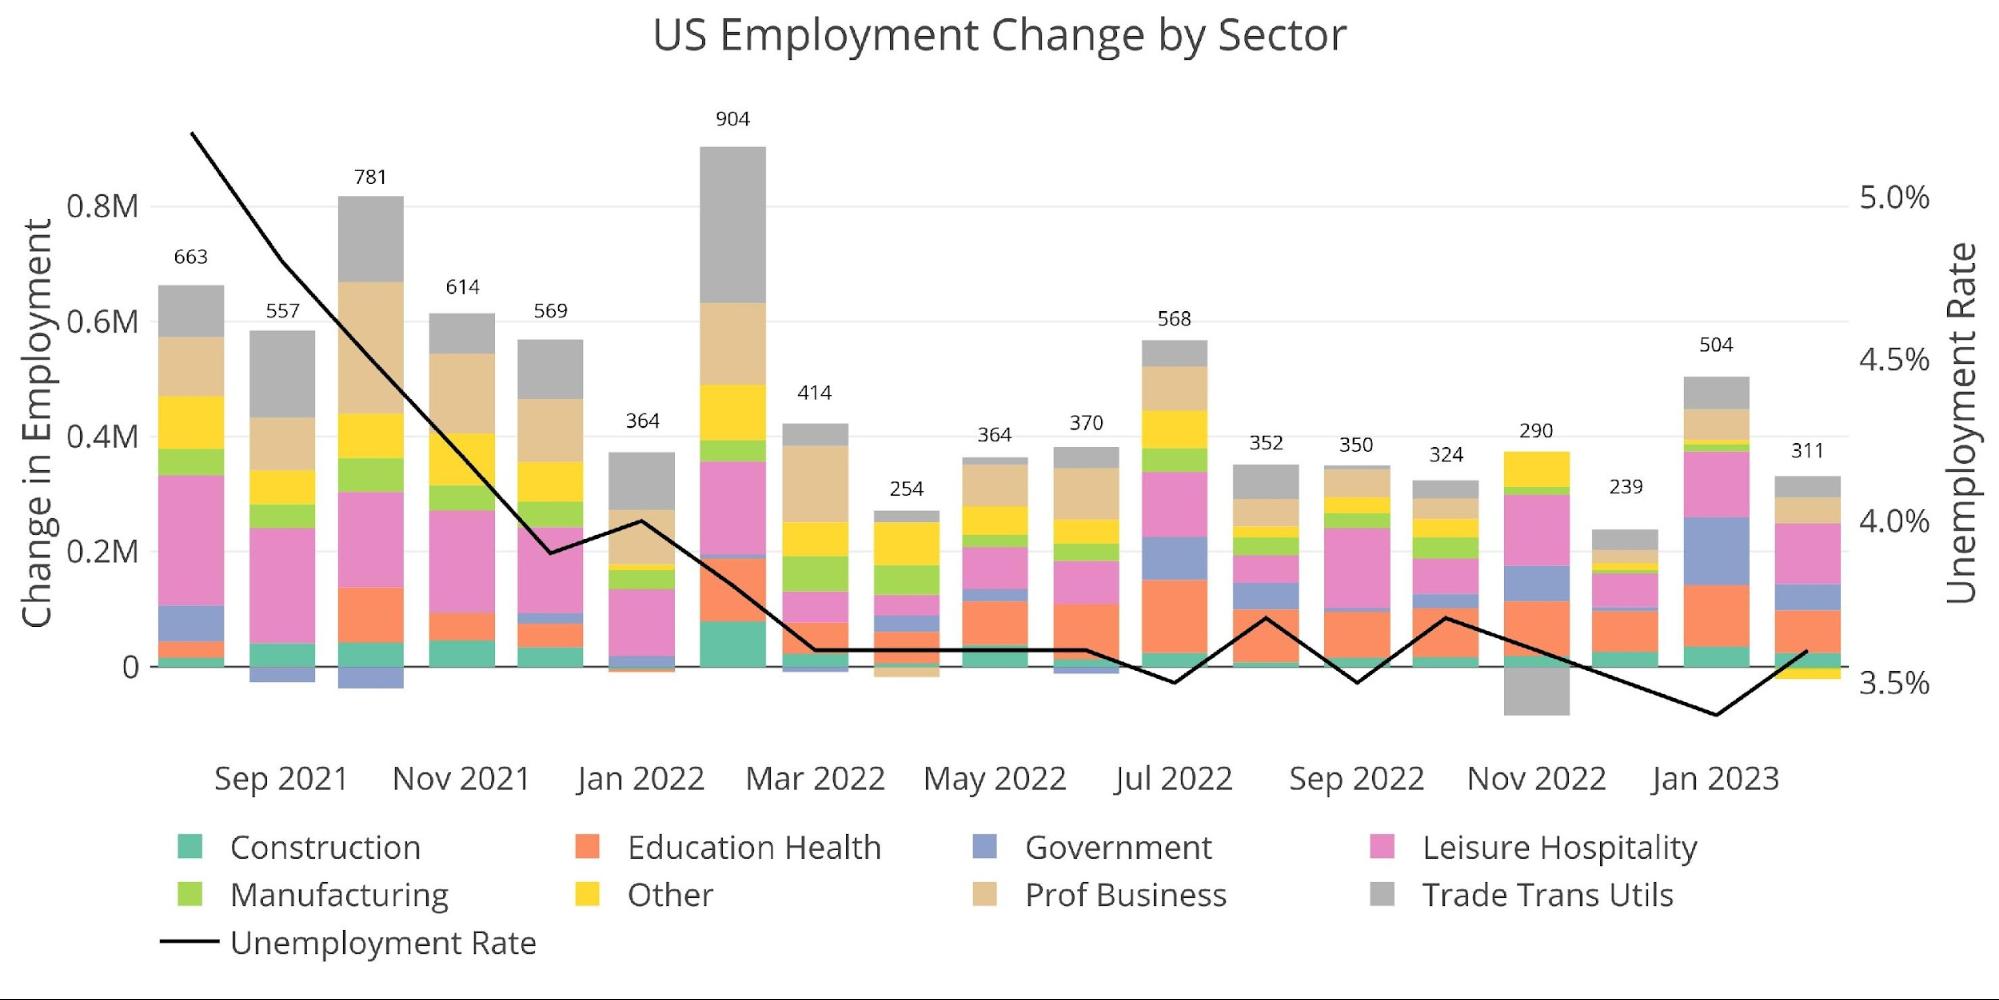
Figure: 7 Change by sector
The number of workers with multiple jobs fell for a second month in a row, down to 7.9M from 8.04M two months ago.
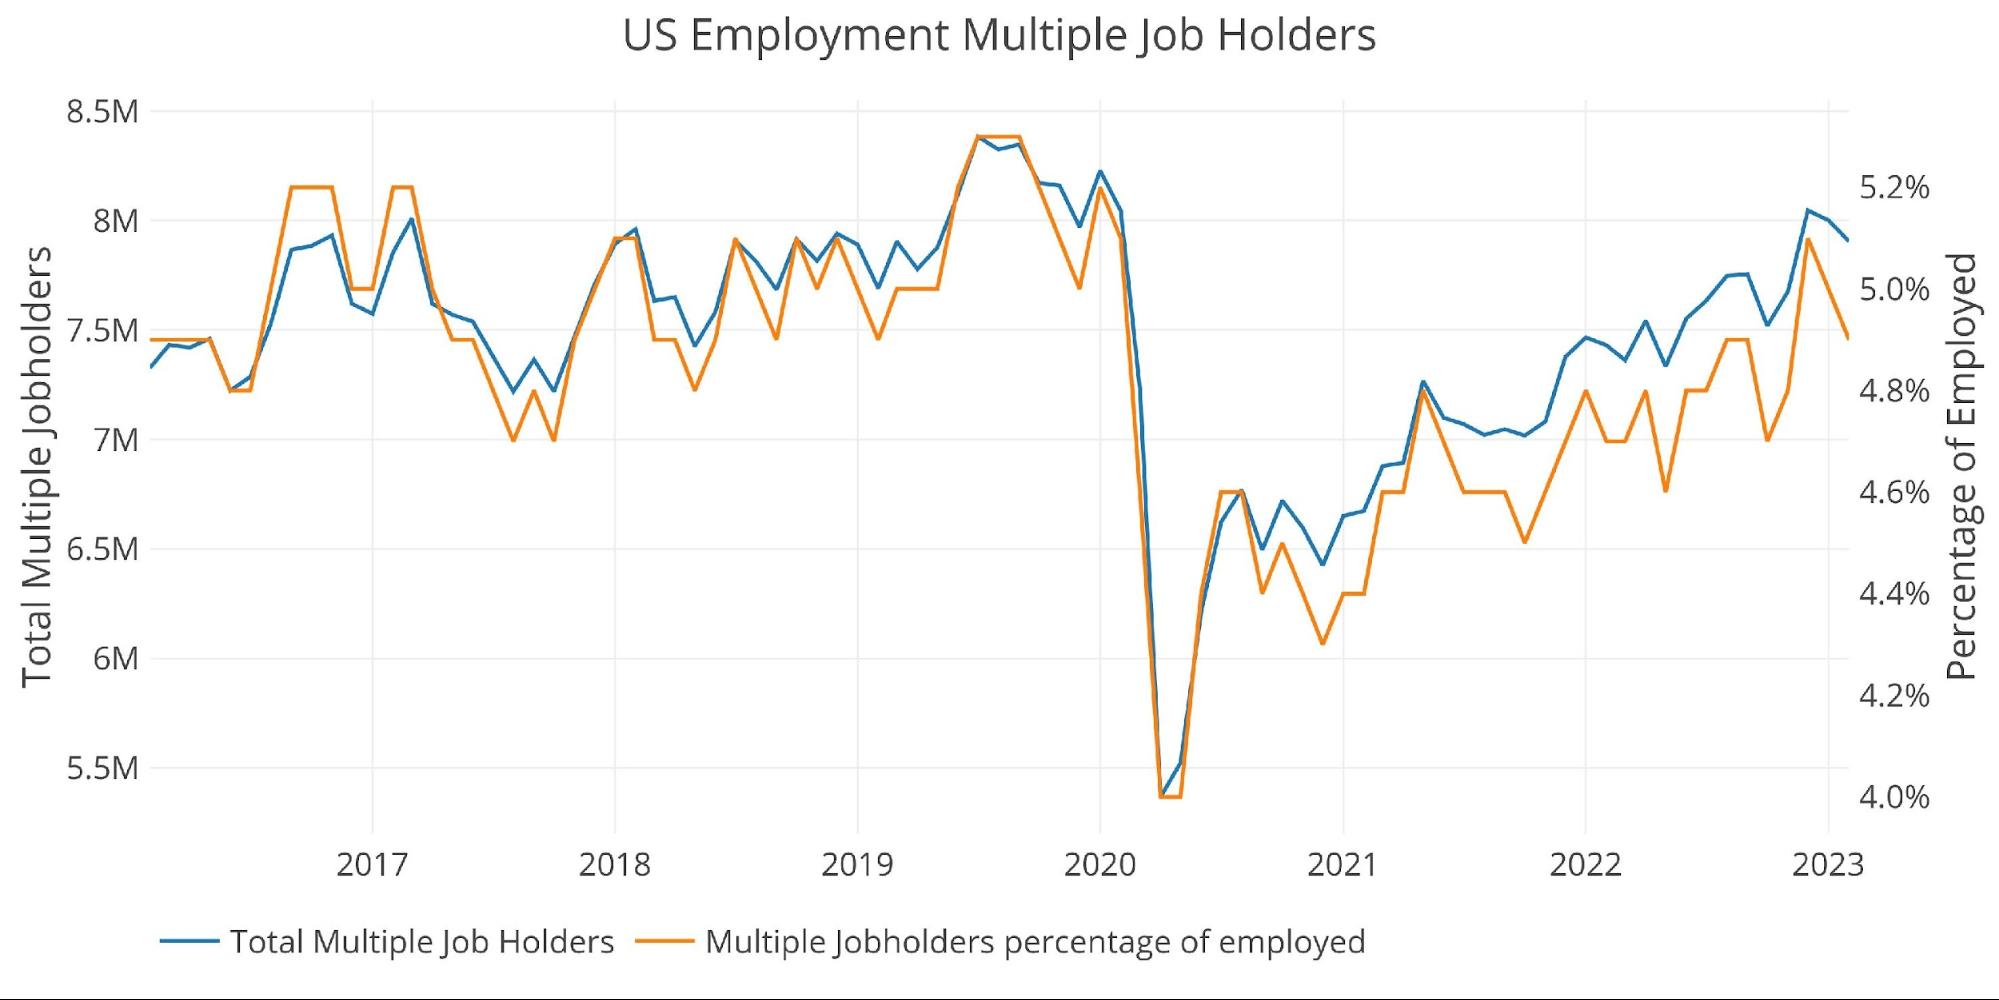
Figure: 8 Multiple Full-Time Employees
February is typically a strong month on a raw basis and gets adjusted down for seasonal reasons. The adjustment down for this February was 808k jobs which was the biggest downward adjustment since 2019.
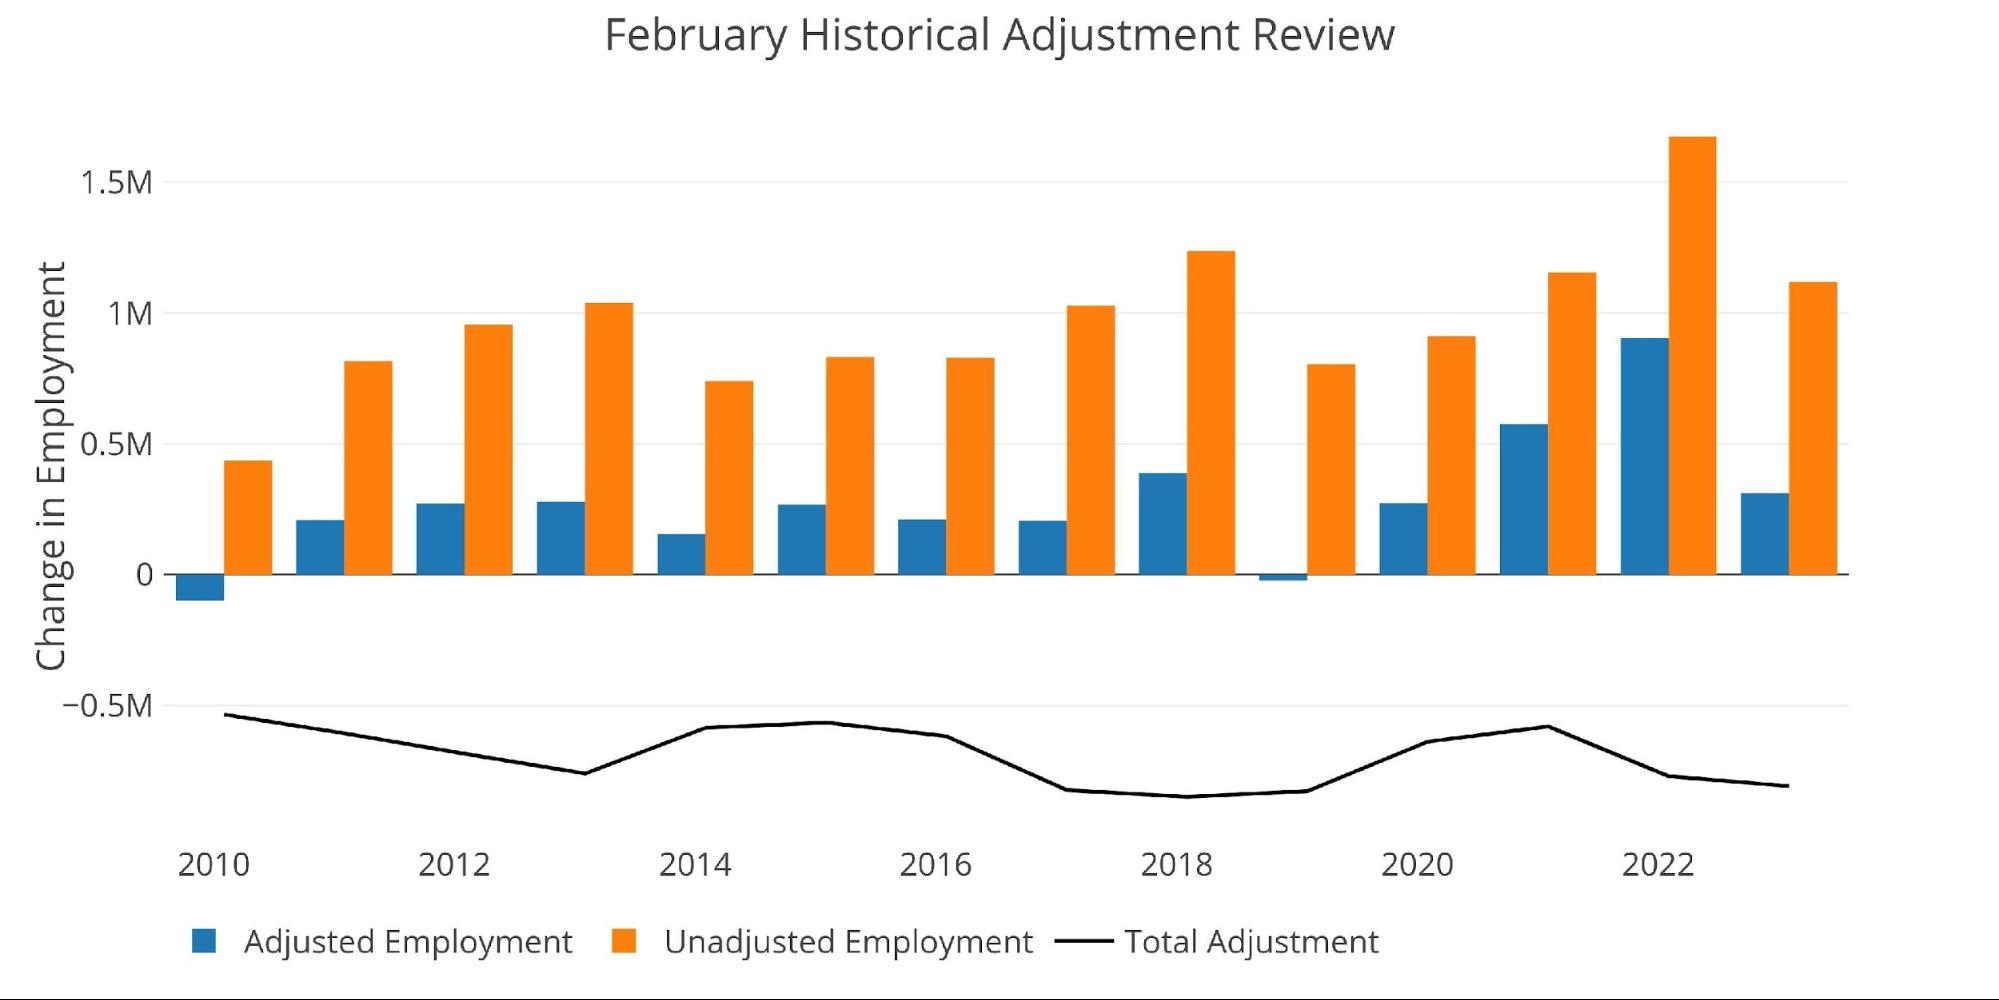
Figure: 9 YoY Adjusted vs Non-Adjusted
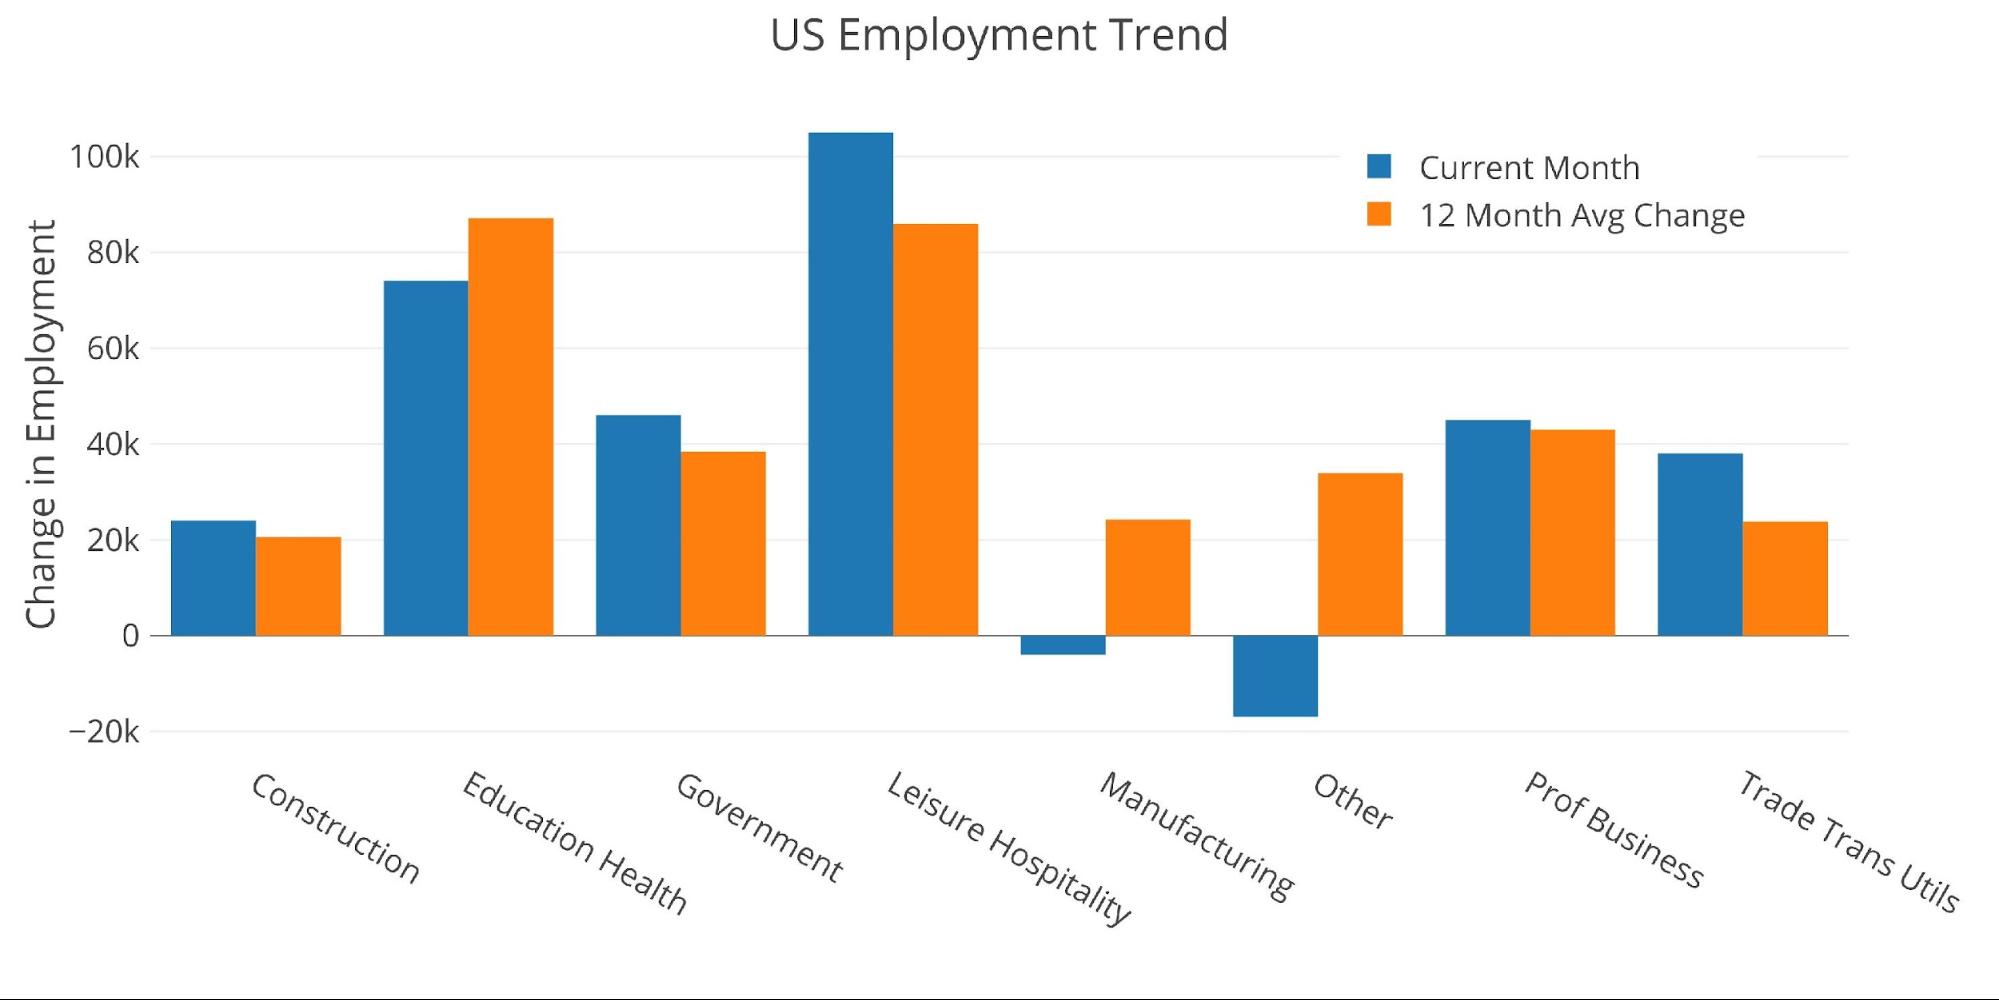
Breaking Down the Adjusted Numbers
Comparing the current month to the 12-month trend shows that this month was closely aligned to the 12-month trend outside of “Other” and “Manufacturing” which both saw job losses. All other categories were in line with the average.
Historical Perspective
The chart below shows data going back to 1955. As shown, the economy is currently “enjoying” its lowest unemployment rate on record. Again, this is quite hard to believe given the current economic environment and job losses that have been announced and implemented.
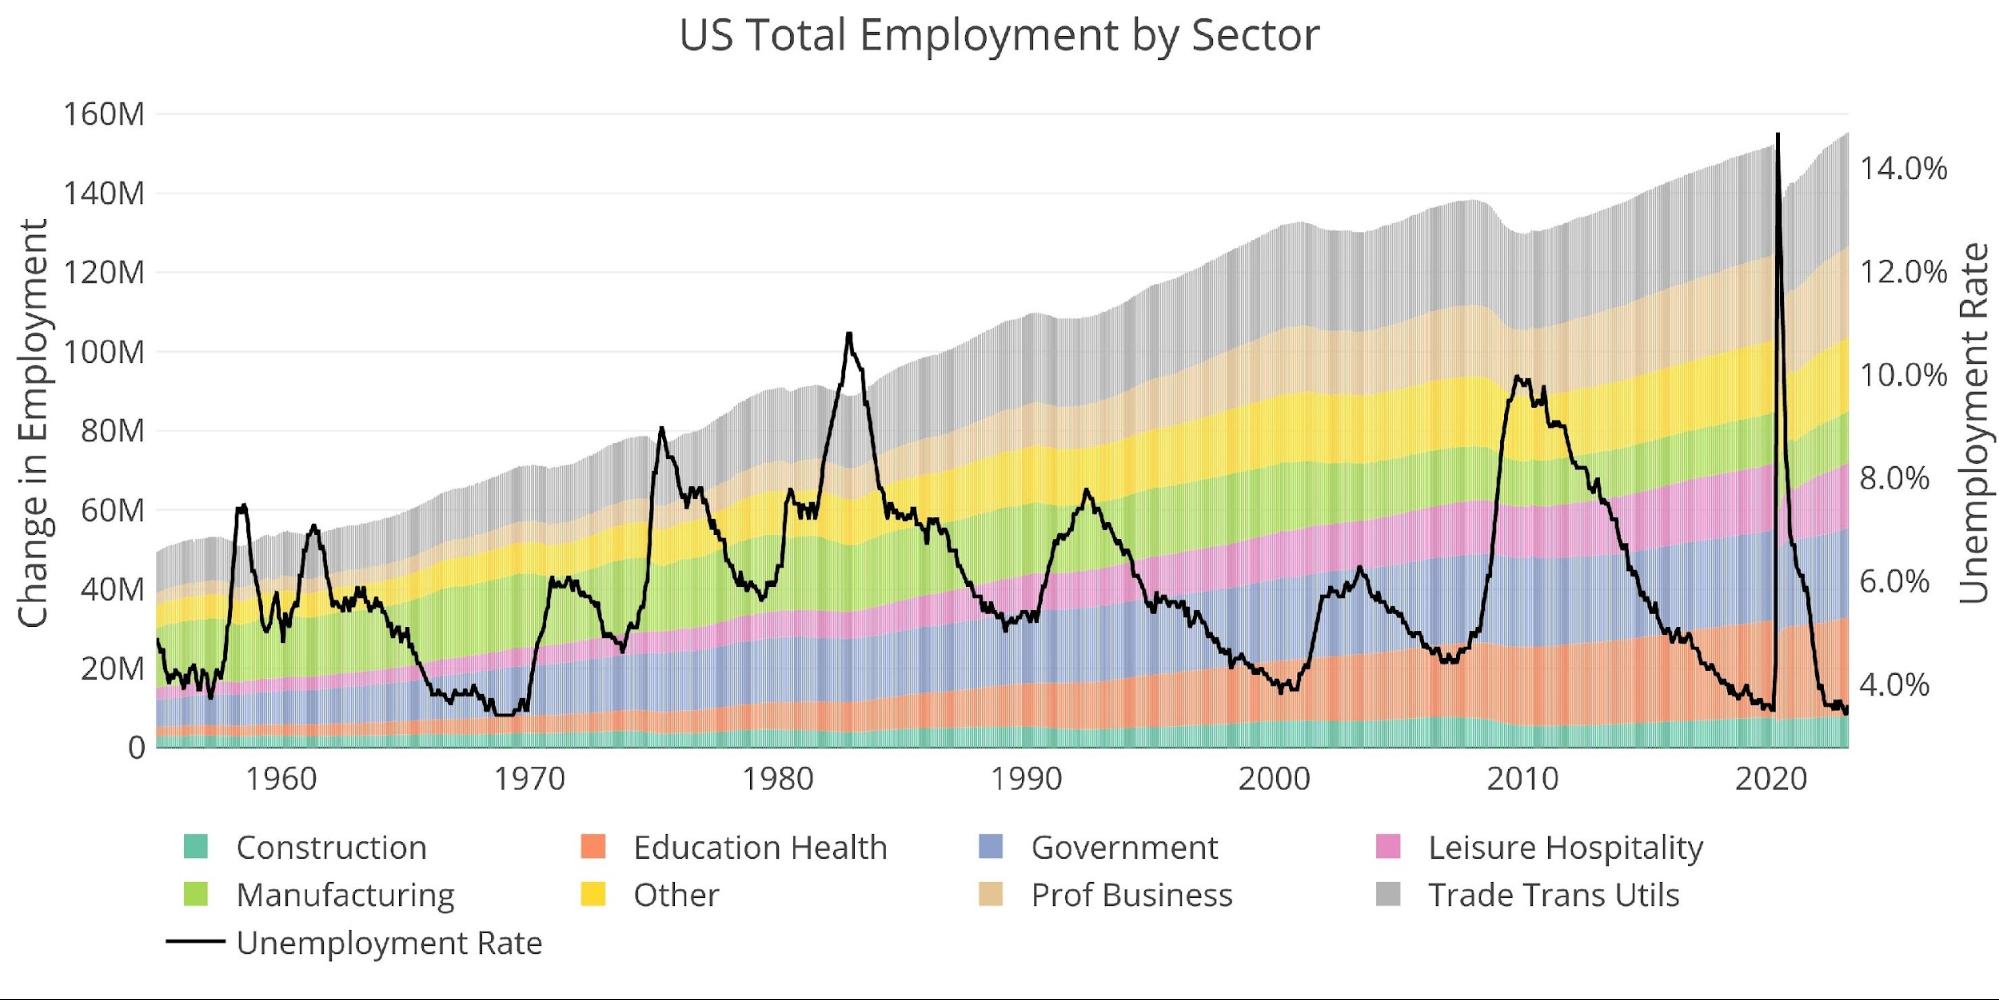
Figure: 11 Historical Labor Market
The labor force participation rate has reached a post-pandemic high of 62.5% but sits below the 63.3% in Feb 2020 and well below the 66% from before the Financial Crisis.
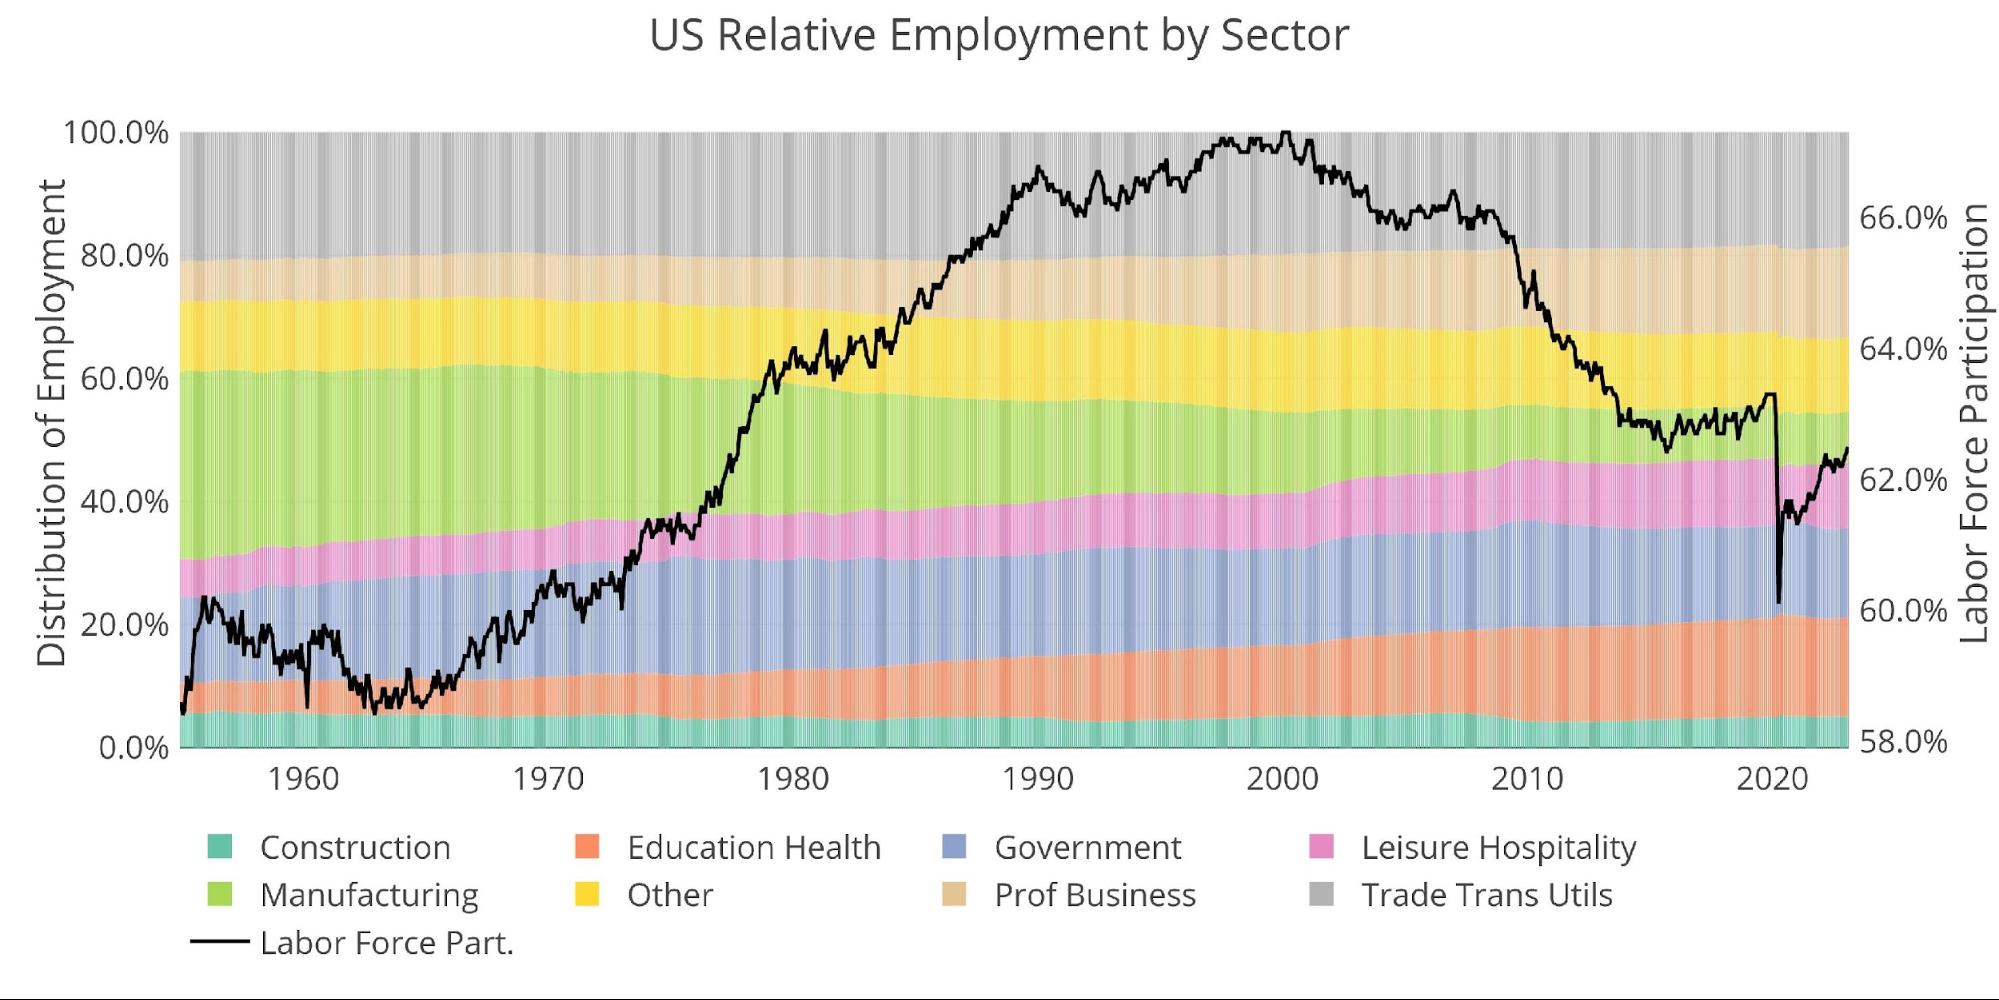
Figure: 12 Labor Market Distribution
Wrapping Up
Employment figures are a lagging indicator. Regardless, the BLS numbers continue to confound when more job cuts are announced daily. The Fed has pressed on using the job numbers as evidence of a strong and resilient economy. However, we have been saying for months that it’s only a matter of time before the Fed breaks something and has to reverse course quickly. We may have just hit that point…
The collapse of Silicon Valley Bank (SVB) has roiled markets this week and the stock market is signaling concern about contagion to other banks. Some are speculating that the Fed is causing this bank run as customers drain cash for better rates.
It’s hard to call SVB the first domino (was it FTX or Three Arrows?), but it most definitely won’t be the last. It takes time for these issues to manifest and the biggest risk-takers are being exposed first. The economy needs cheap money to survive and the spigots are off. Things are starting to feel a lot like early 2008. There were tremors but everyone said things were contained. Banks stocks took a hit but stayed high all through the summer. Then the bottom fell out. History doesn’t repeat, but it rhymes…
Sure, the job numbers continue to come in strong. Even if they are reliable, which is a BIG “if”, they are a lagging indicator. The Fed can keep its head in the sand, but it looks like the cracks are starting to get bigger. If the Fed plays this game of chicken much longer, they will absolutely lose. Either they start cutting now or they make massive cuts on the defensive once things really break. In either case, inflation at or below 2% is a pipe dream. Protect yourself with something that cannot be printed like gold and silver!
Data Source: https://fred.stlouisfed.org/series/PAYEMS and also series CIVPART
Data Updated: Monthly on first Friday of the month
Last Updated: Feb 2023
Interactive charts and graphs can always be found on the Exploring Finance dashboard: https://exploringfinance.shinyapps.io/USDebt/

Call 1-888-GOLD-160 and speak with a Precious Metals Specialist today!
Buka akaun dagangan patuh syariah anda di Weltrade.
Source link