Mastery Trade for XAUUSD 16 Jan 2023 for Fundamental Analysis and Technical Analysis


Gold : Fundamental Factors
1) Federal Reserve will be a lot less aggressive with rate hikes this year versus 2022, and might even wrap its monetary tightening well before the end of 2023.
2) Inflation, as indicated by the Consumer Price Index, or CPI, rose by 6.5% in the 12 months to December, the U.S. Labor Department said Thursday. It was the slowest annual advance for the CPI since October 2021.
3) Disinflation for silver prices happens which causes that FED is lowering its interest rate.
The trend is Bullish
Gold : Fundamental Range : 1,916.86-1,920.93

Technical Analysis
Check at Daily Timeframe Support and Resistance for Fibonacci.
Check based on the current timing for the Support and Resistance when you want to go into trade.
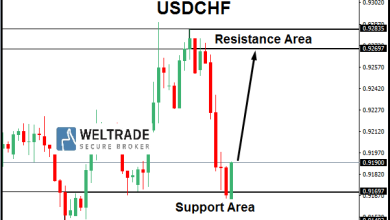
Resistance Area : 1919.81,1920.74, 1922.24
Support Area : 1916.81, 1915.88, 1914.38
Pivot point : 1918.31
Confirm with technical indicators and based on your own technical analysis for the trend.
Check investing.com to get more info on what most indicator would display
Check higher timeframe also for more confirmation for entry in Daily timeframe.
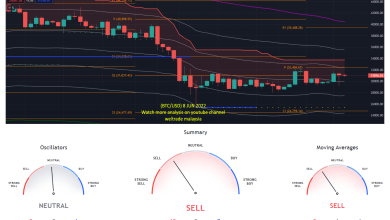
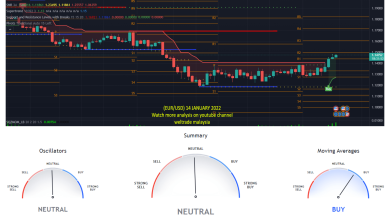
The technical indicator display strong buy in Daily and strong buy in weekly and strong buy in monthly timeframe.
Use linear regression to get confirmation trend at daily as they are not available in investing.com
Linear regression shows upward trend at the daily timeframe .Can check linear regression trend in weekly and monthly for more confirmation.For weekly, it is downtrend and for monthly,it is showing uptrend.
Use Bolinger Band Strategy Tester and RSI Strategy Tester to get more confirmation for the trend and percent profitable.Check at bigger timeframe also such as weekly and monthly.
Ensure that both RSI strategy and Bolinger Band Strategy gives above 50%. for the percent profitable
RSI strategy tester and Bolinger Band Strategy Tester at the daily has percentage higher than 50% ,weekly and monthly has lesser than 50% for the RSI strategy Tester and Bolinger Band Strategy Tester.
Gold : Find buy at the daily chart by using the third support point,1916.81 will be at the pivot point , 1918.31 (SEE CURRENT MARKET PRICE)
See current market and find the nearest support point for entry and take profit at the pivot point.
Fundamental and Technical analysis must be aligned
For further information, contact me ,Gurmit at +60142584067, I will guide anyone who wants to register with Weltrade. You can register at the link below. Thank you.
https://my.weltrade.com/?r1=ipartner&r2=49989
DISCLAIMER :This analysis is based on Investing.com and Forexfactory.com. You may follow based on your own discreetion.
Can join at our telegram group at https://t.me/weltrade_my
For traders who want to trade on their own can join Weltrade, we provide benefits for traders out there, learn to trade and follow free signals such as free paid signal providers, bookmap gold and tradingview premium live.
Free Bookmap Education t.me/+JetSe33YA0U2ZDk1
Join us at our zoom for online learning from 10.30am to 11.30am by the Financial Markets Research Center (FMRC) team. With Cikgu Hafiz and Cikgu Gurmit
Link: https://us06web.zoom.us/j/81843968428?pwd=VkZ3L2UrcXh2WlZsZHU3ZFFGUmJMQT09
Komen anda
Source link