
The Federal Government ran a deficit of -$85B in December. While this was much smaller than the deficit posted in November, it marks one of the largest December deficits ever.

Figure: 1 Monthly Federal Budget
As the chart below shows, the month of December is usually a small deficit month with 2020 and the Great Financial Crisis being the exceptions. For example, the last four December deficits have been -$13B, -$143, -$21B, and -$85B (2022).
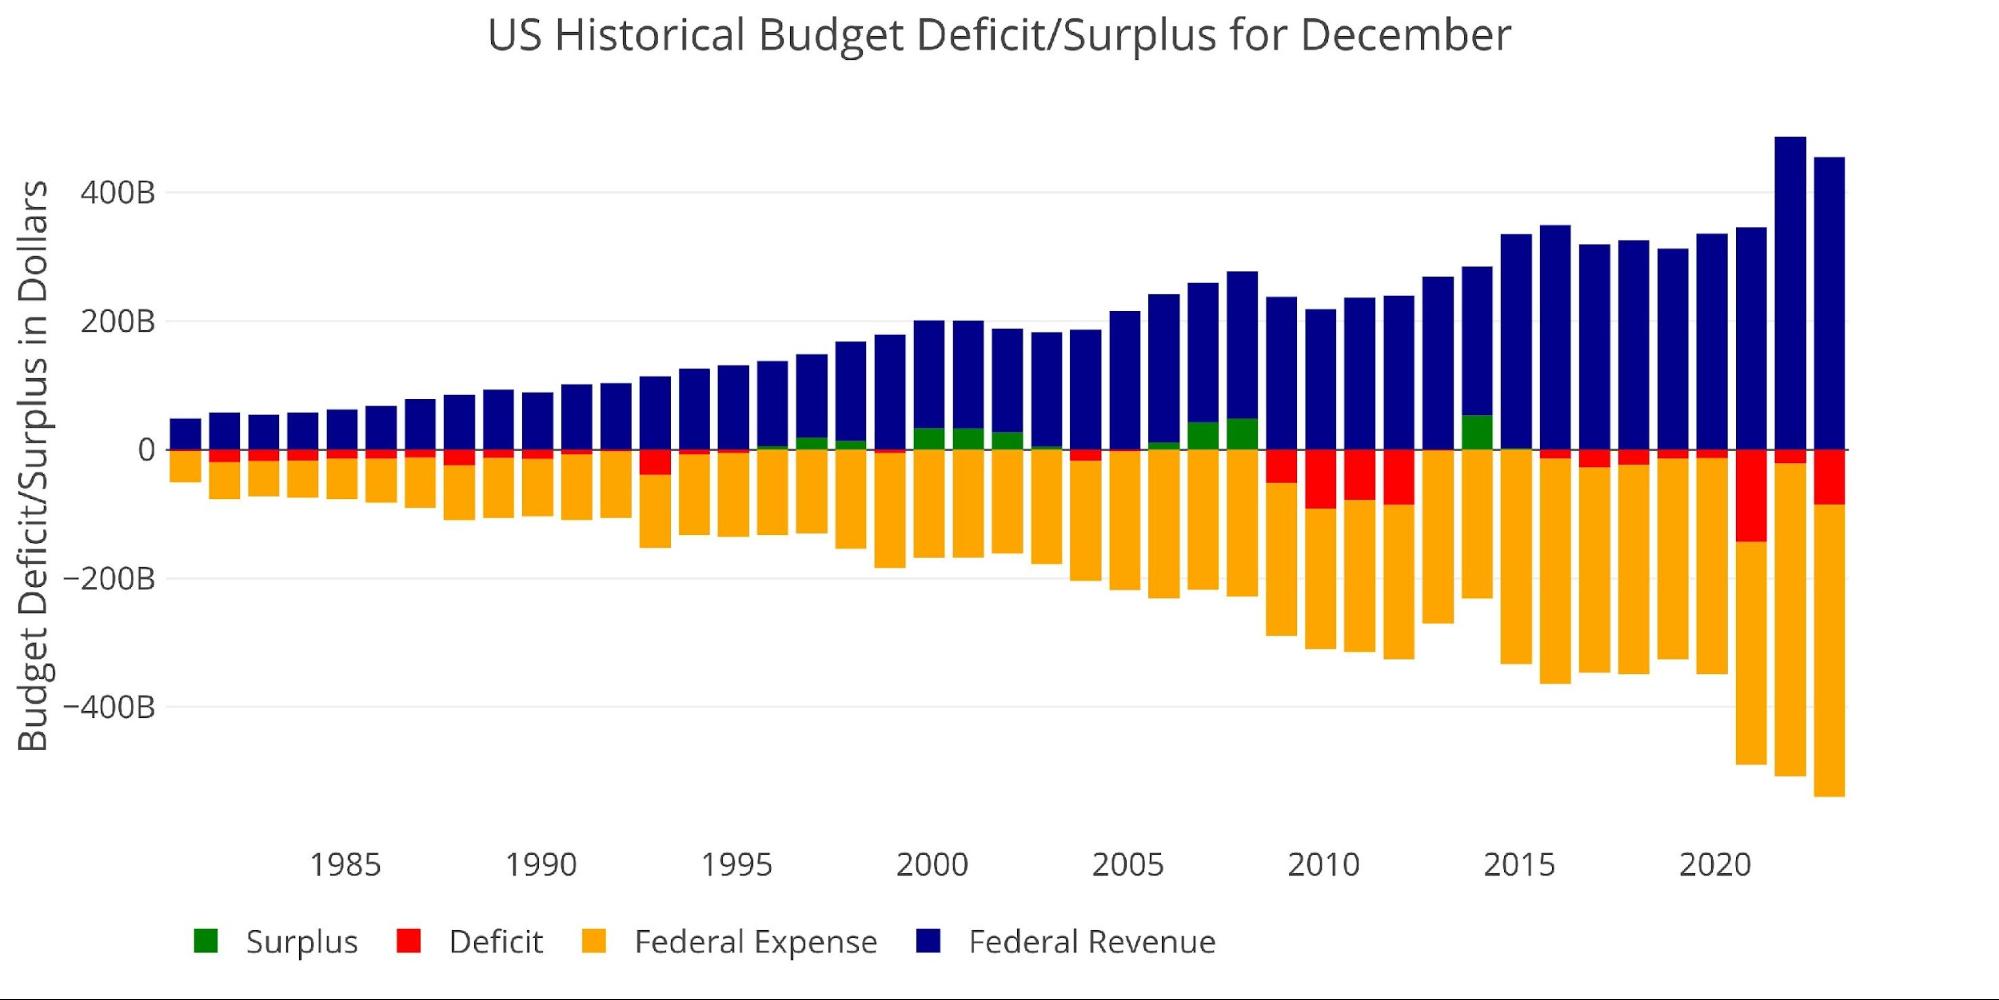
Figure: 2 Historical Deficit/Surplus for December
For the decade before Covid, December averaged a deficit of -/$6.5B which makes this December 13x larger than the historic average.
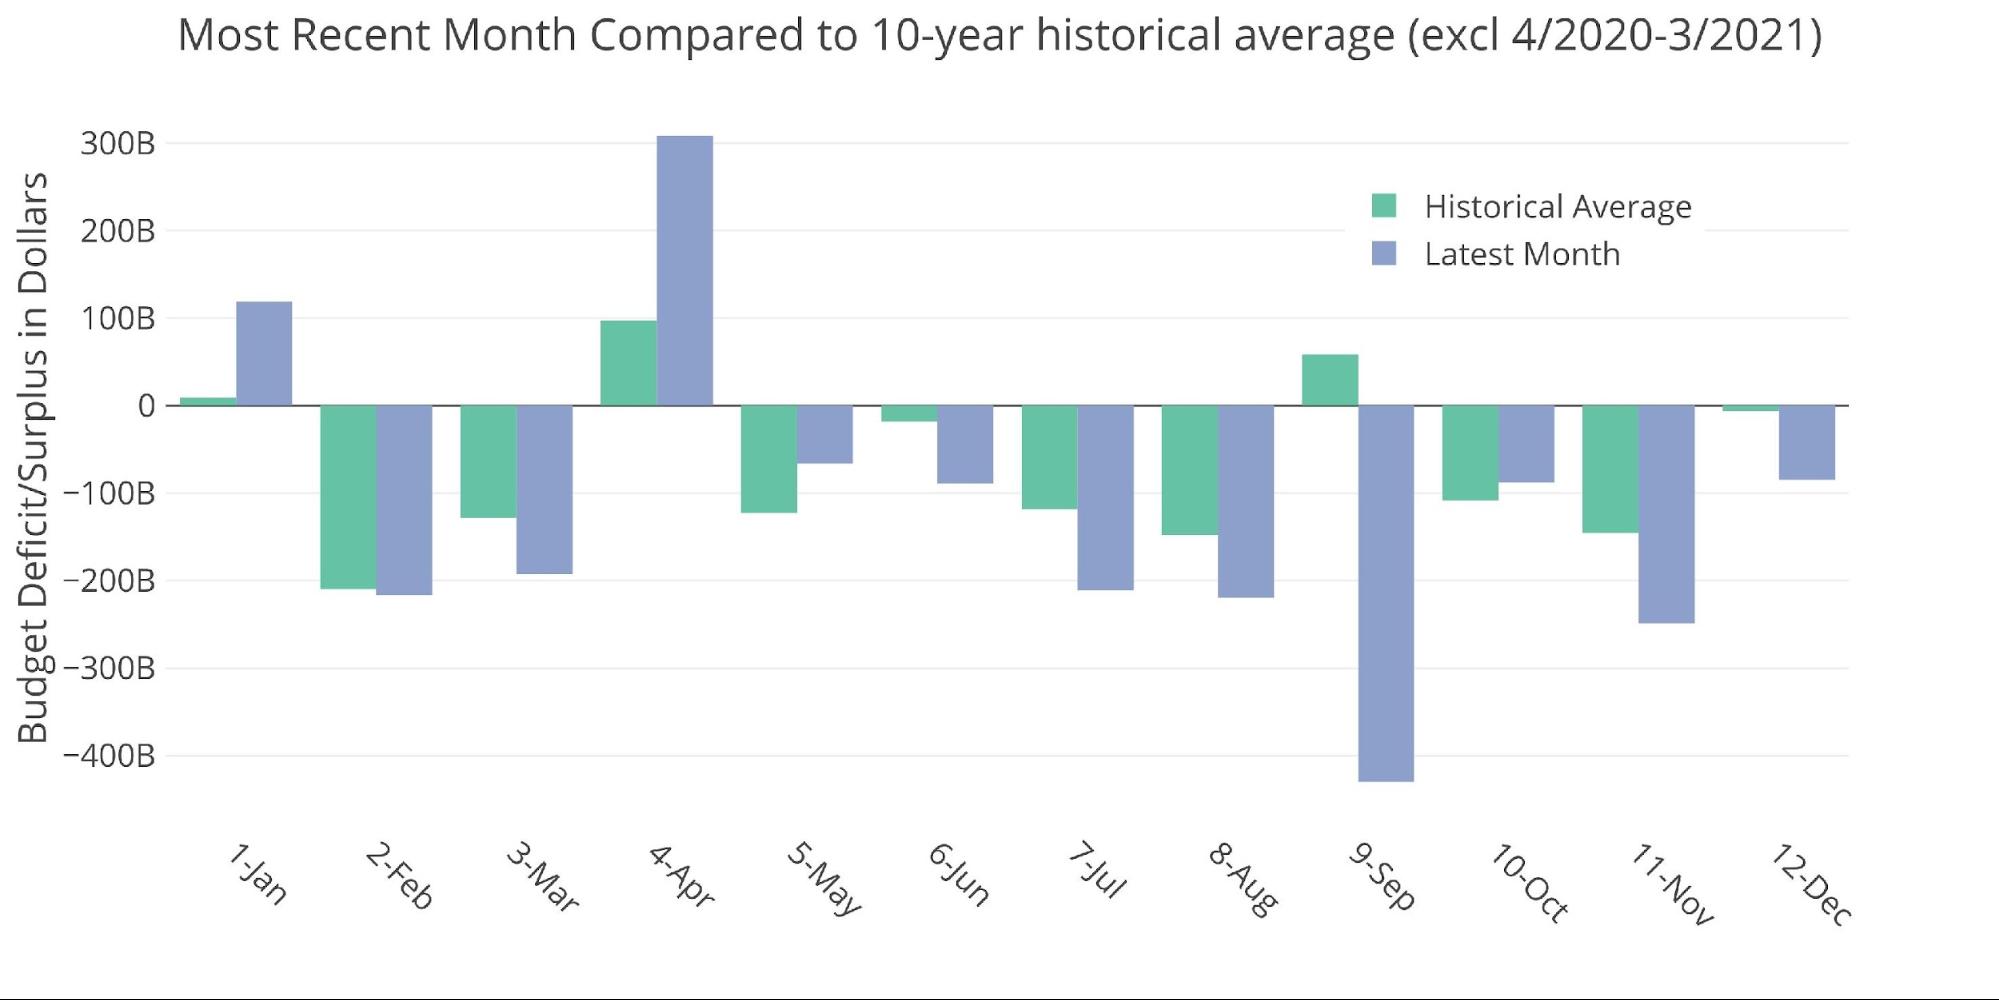
Figure: 3 Current vs Historical
The Sankey diagram below shows the distribution of spending and revenue. The Deficit represented 15.7% of total spending.
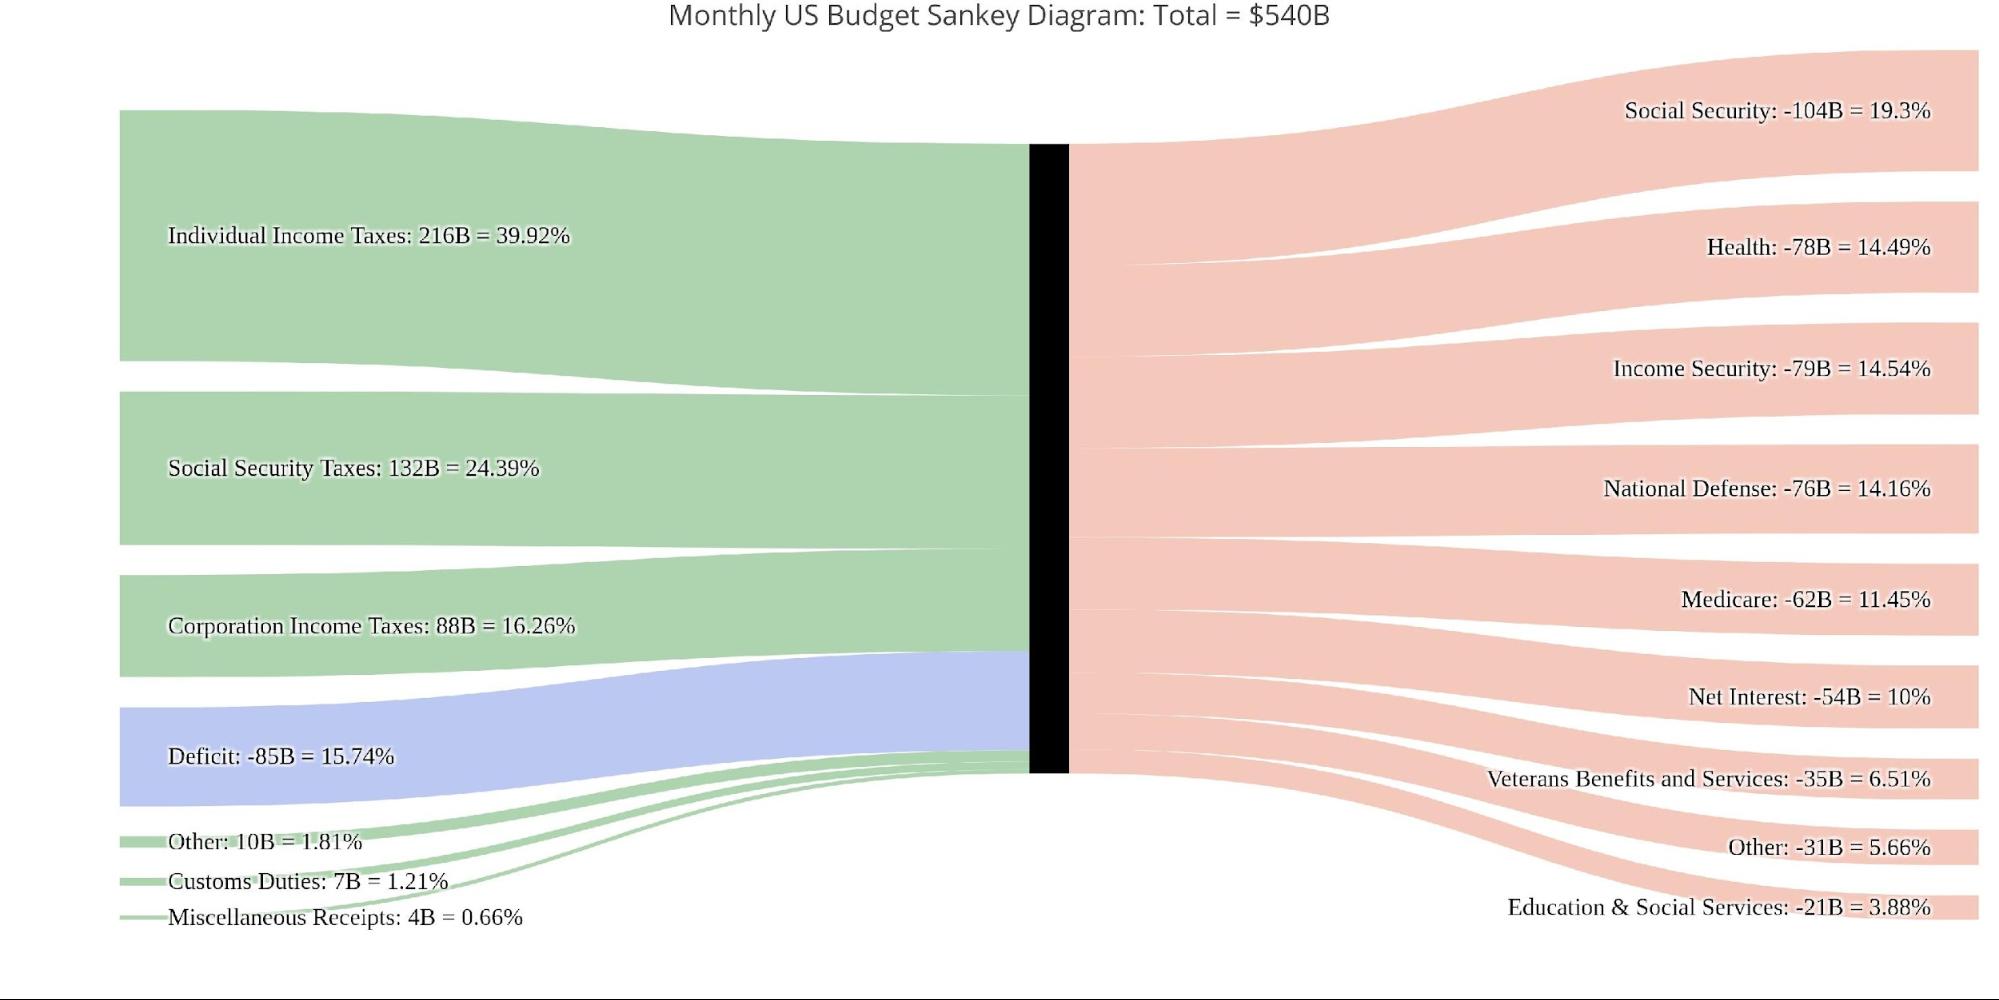
Figure: 4 Monthly Federal Budget Sankey
Looking at the TTM, the December Deficit was lower than the aggregate 12 months which represented 22.6% of total spending.
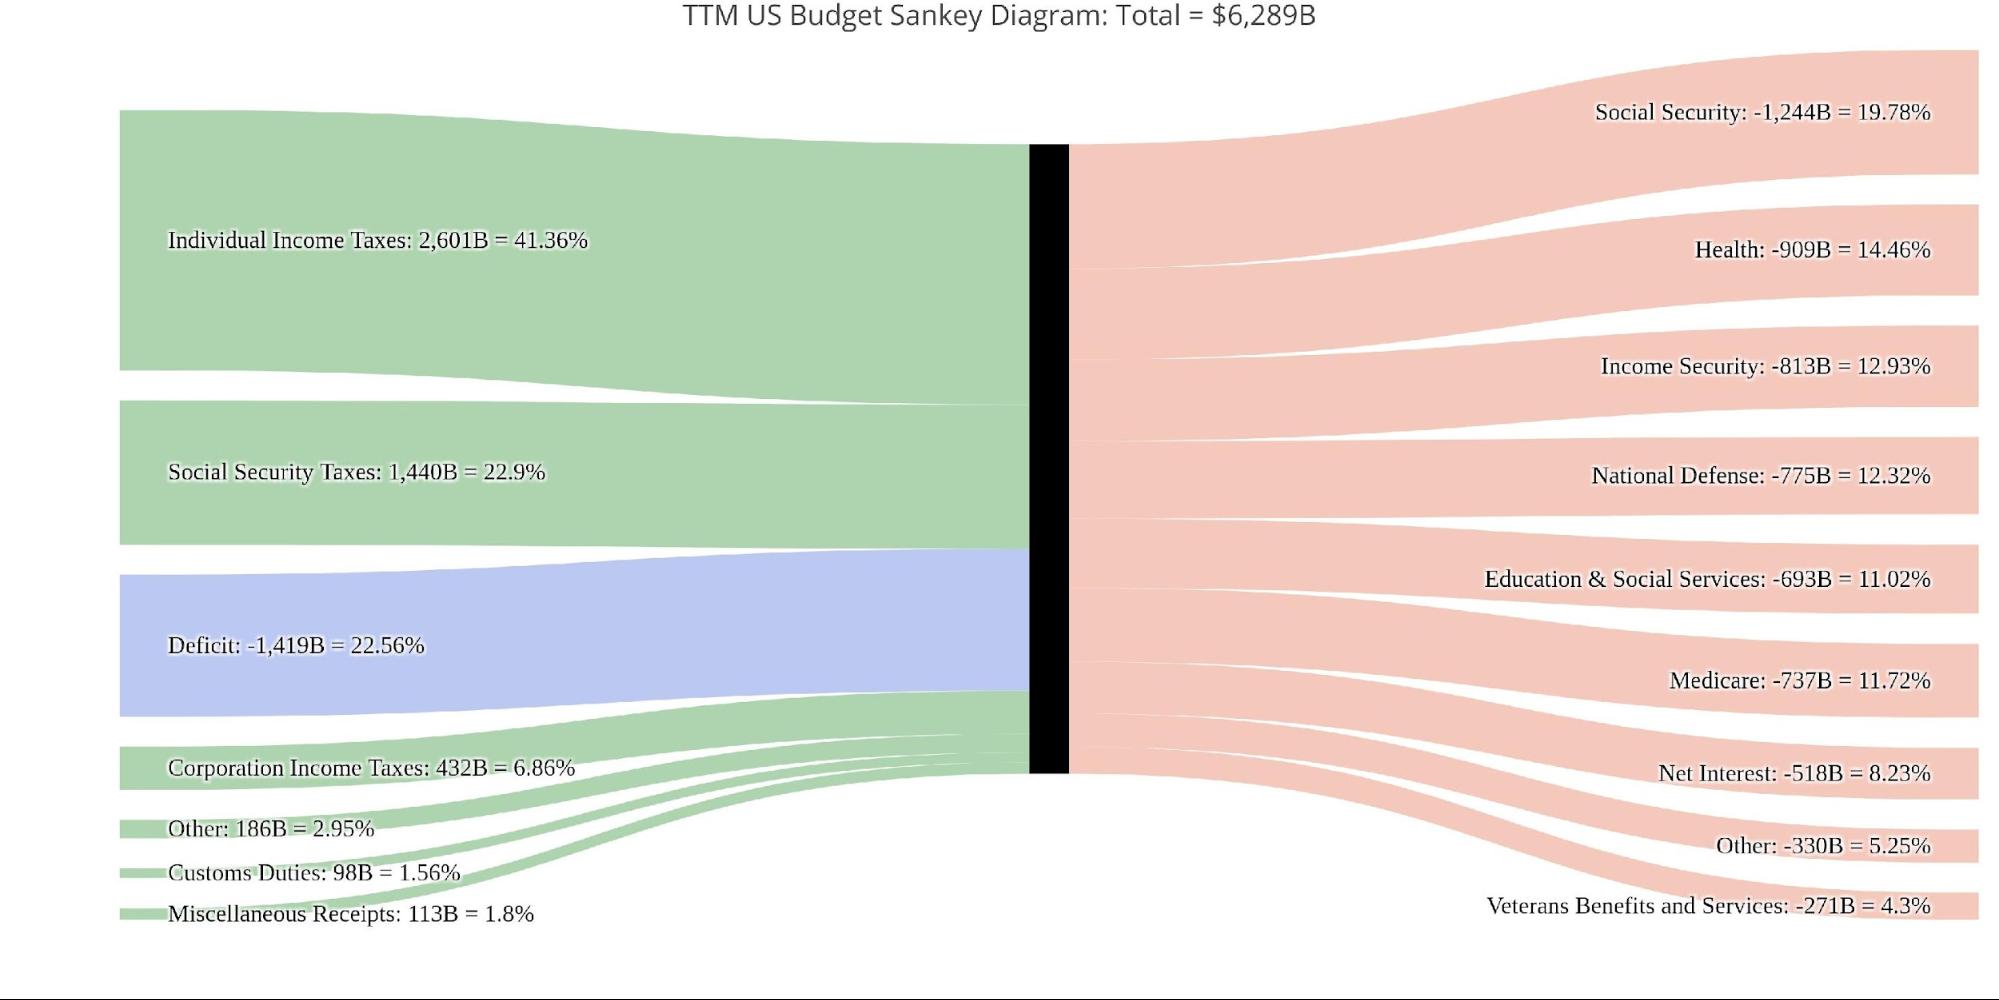
Figure: 5 TTM Federal Budget Sankey
One thing that helped the Treasury this month was a surge in revenue from Corporate Taxes which occurs every 3 months or so.
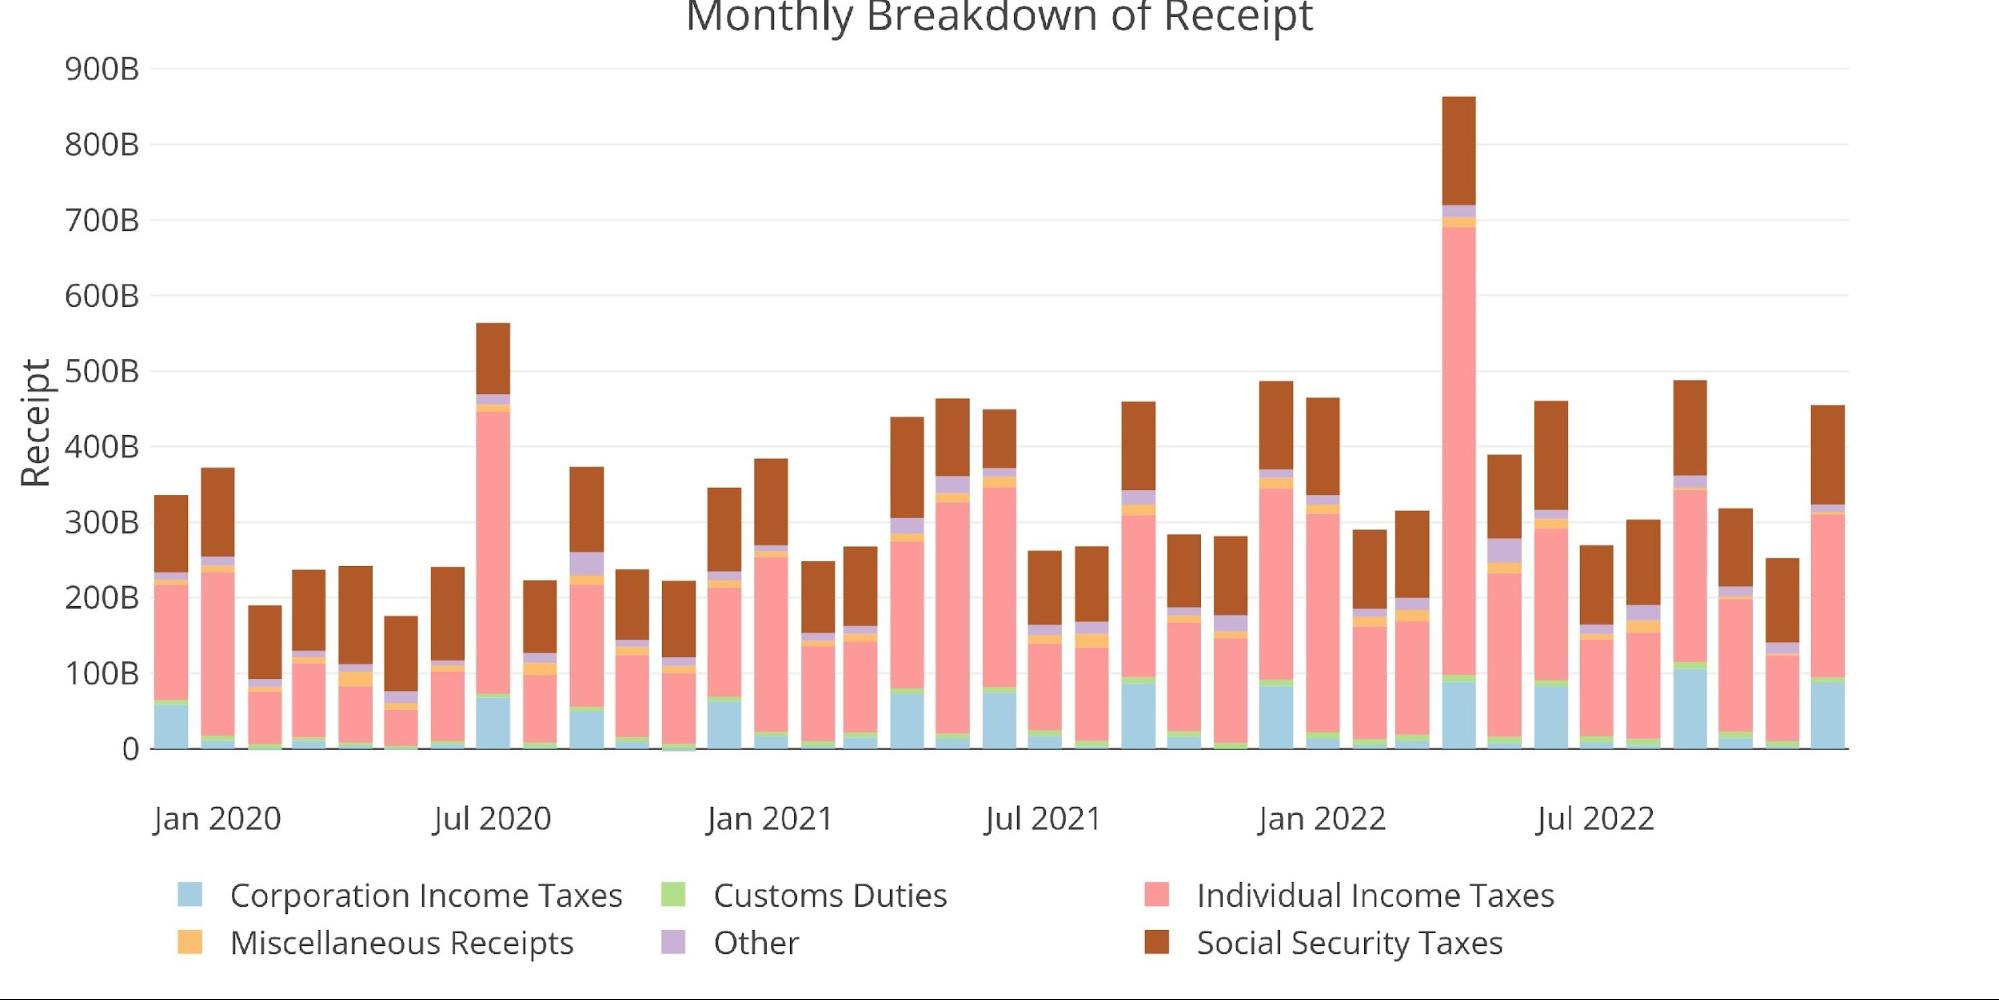
Figure: 6 Monthly Receipts
Total Expenses grew quite significantly this month, with all categories showing an expansion.
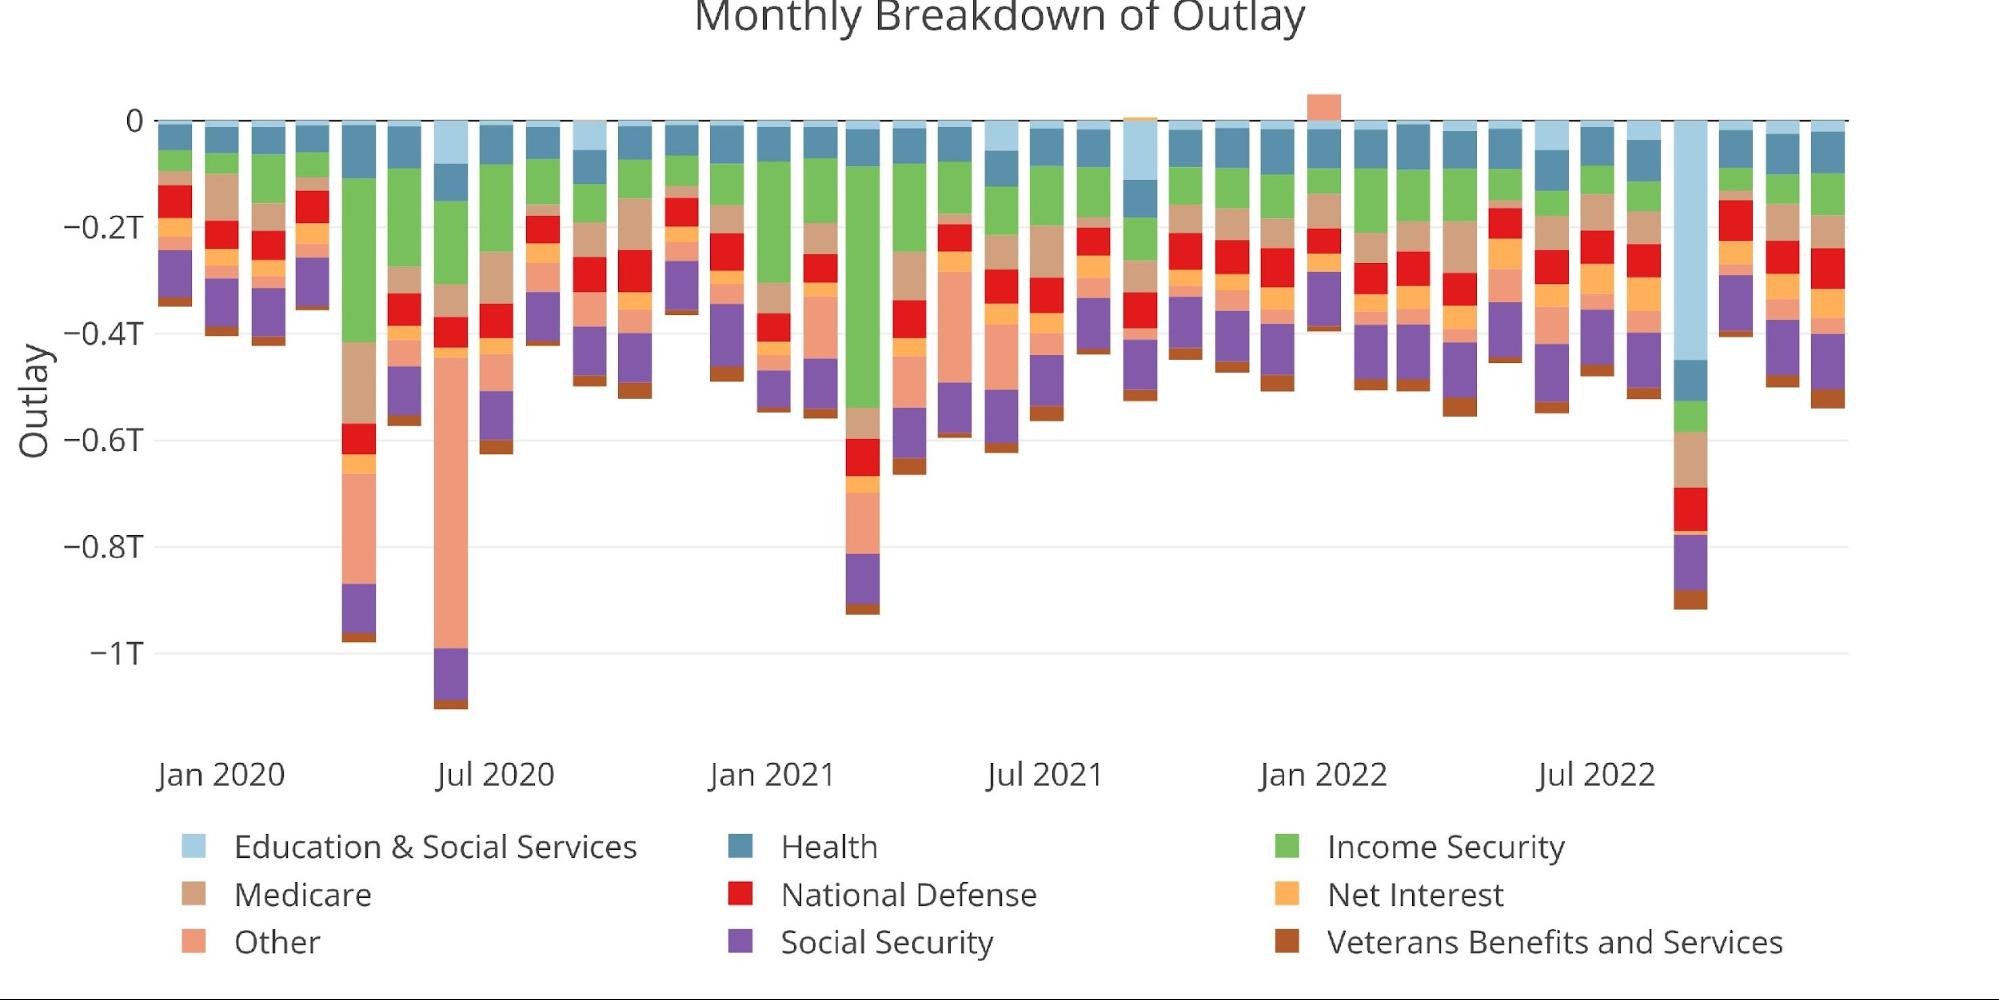
Figure: 7 Monthly Outlays
The elephant in the room remains the interest owed on the debt. On a TTM basis, this has surged to $517B which is $200B higher than it was in April of 2021. This is taxpayer money that is not buying anything or investing in anything of value. It is just money to finance the debt.
On a TTM basis, Net Interest expense represented 8.23% of total expenses. This will become a major problem for the Treasury going forward.
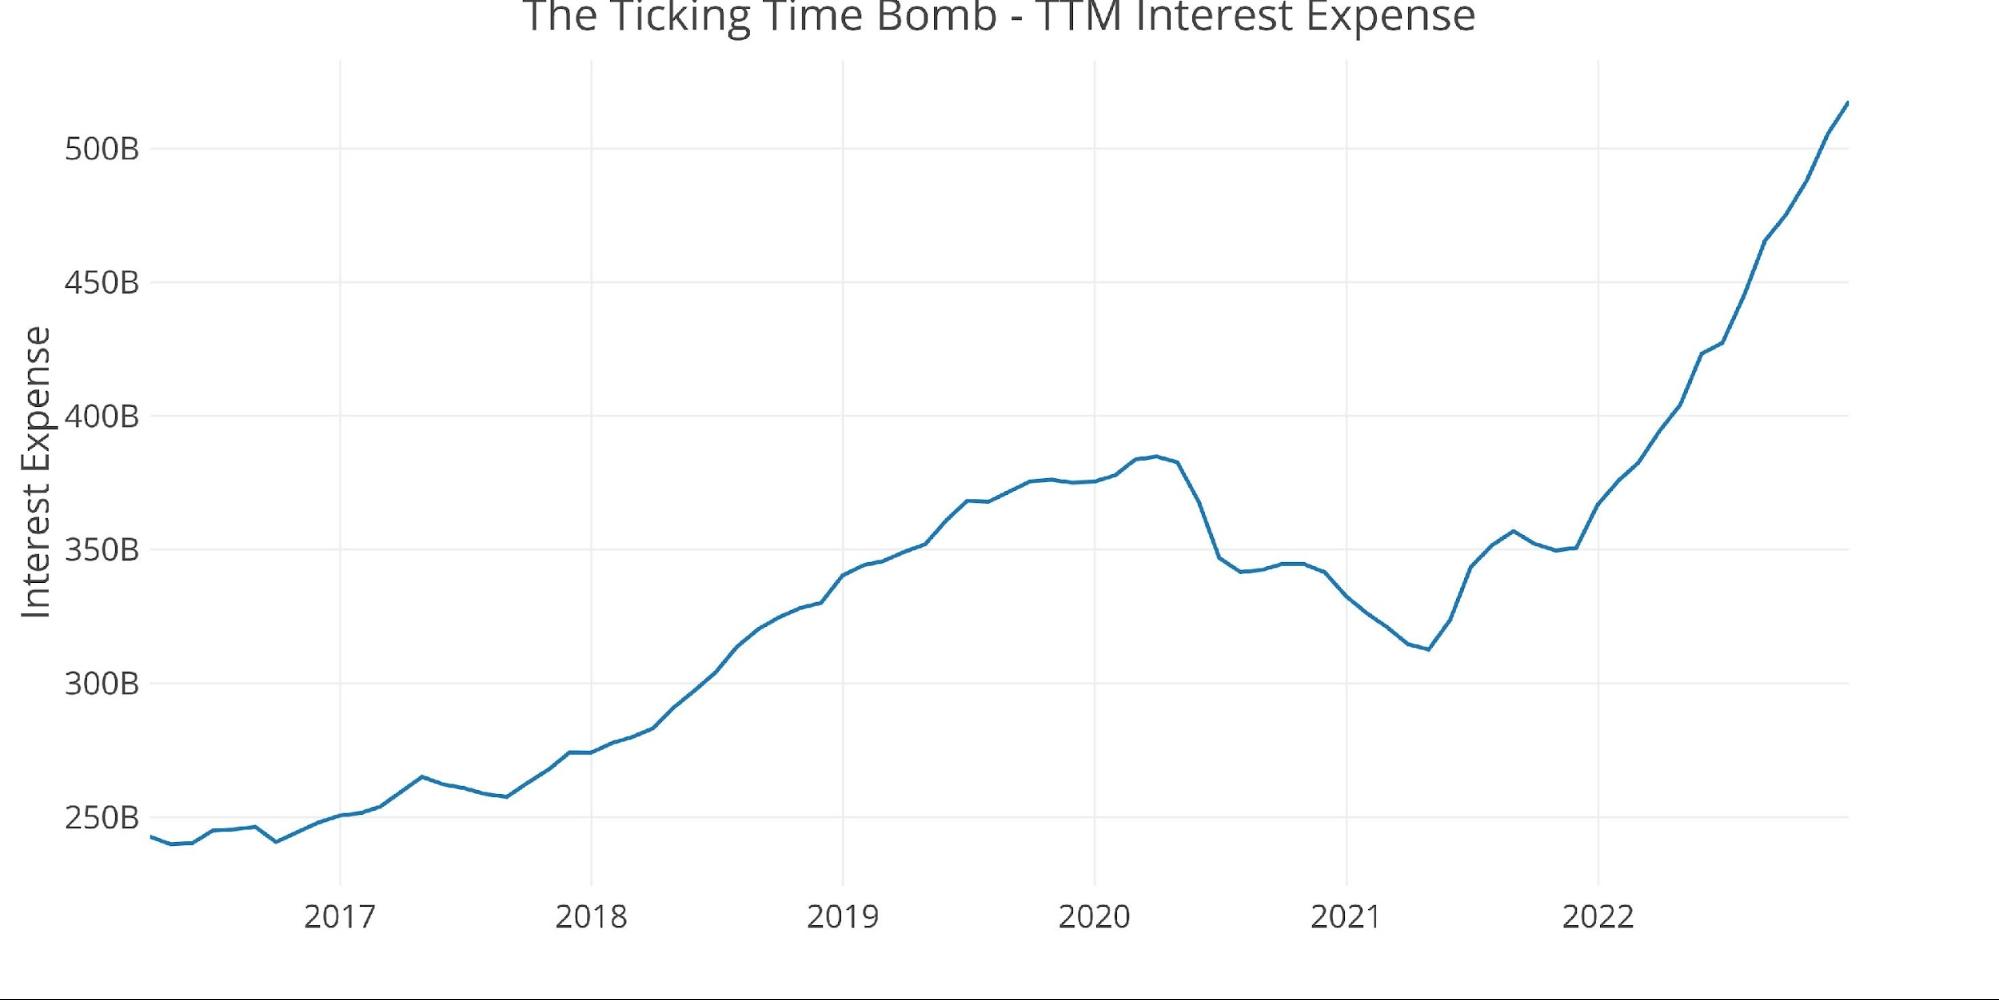
Figure: 8 TTM Interest Expense
The table below goes deeper into the numbers of each category. The key takeaways from the charts and table:
Outlays
-
- YoY all but two expenses increased
-
- Several by more than double digits with Interest and Education both climbing 30%
-
- On a TTM basis, Education is up 120% from December 2021 (mainly due to debt forgiveness)
- Also, on a 12-month basis, 4 categories grew by more than 10%
- YoY all but two expenses increased
Receipts
-
- Individual Income Taxes were down 15% but still up 16.5% YoY
-
- This is something to watch. Income Taxes have been a major new source of revenue for the Treasury so if this dries up as Interest Expense climbs it could have major implications for budget deficits
-
- Corporate Income Taxes were up 5.4% YoY but an incredible 144% compared to the pandemic year
-
- On a TTM basis compared to 2020, Corporate and Individual Taxes were up 100% and 65% respectively, but “only” 7.5% and 16.5% when compared to calendar year 2021
-
- Individual Income Taxes were down 15% but still up 16.5% YoY
Total
-
- The Total TTM Deficit was still $1.4T, up from $1.35T last month
- Expenses actually shrunk by 8.5% compared to 2021 while revenue increased 13.4%
Even with the extra help from increased revenues, the deficit was still $1.4T. If the revenues fall due to recession just as interest rates are rising, the Treasury could quickly find itself in a situation of $2T or more in debt. Who is going to buy all that debt?
The Fed of course!

Figure: 9 US Budget Detail
Historical Perspective
Zooming out and looking over the history of the budget back to 1980 shows a complete picture. It shows how a new level of spending has been reached that is being supported by a major surge in tax revenues. The blue bars on the far right show that the surge has definitely plateaued, but unfortunately, spending has turned back around after dipping lower into July of this year.

Figure: 10 Trailing 12 Months (TTM)
The next two charts zoom in on the recent periods to show the change when compared to pre-Covid.
As shown below, total Receipts have surged higher in the last two years driven by Social Security, Corporate Taxes, and Individual Taxes. In two years, total revenue has climbed by $1.4T or 40%.
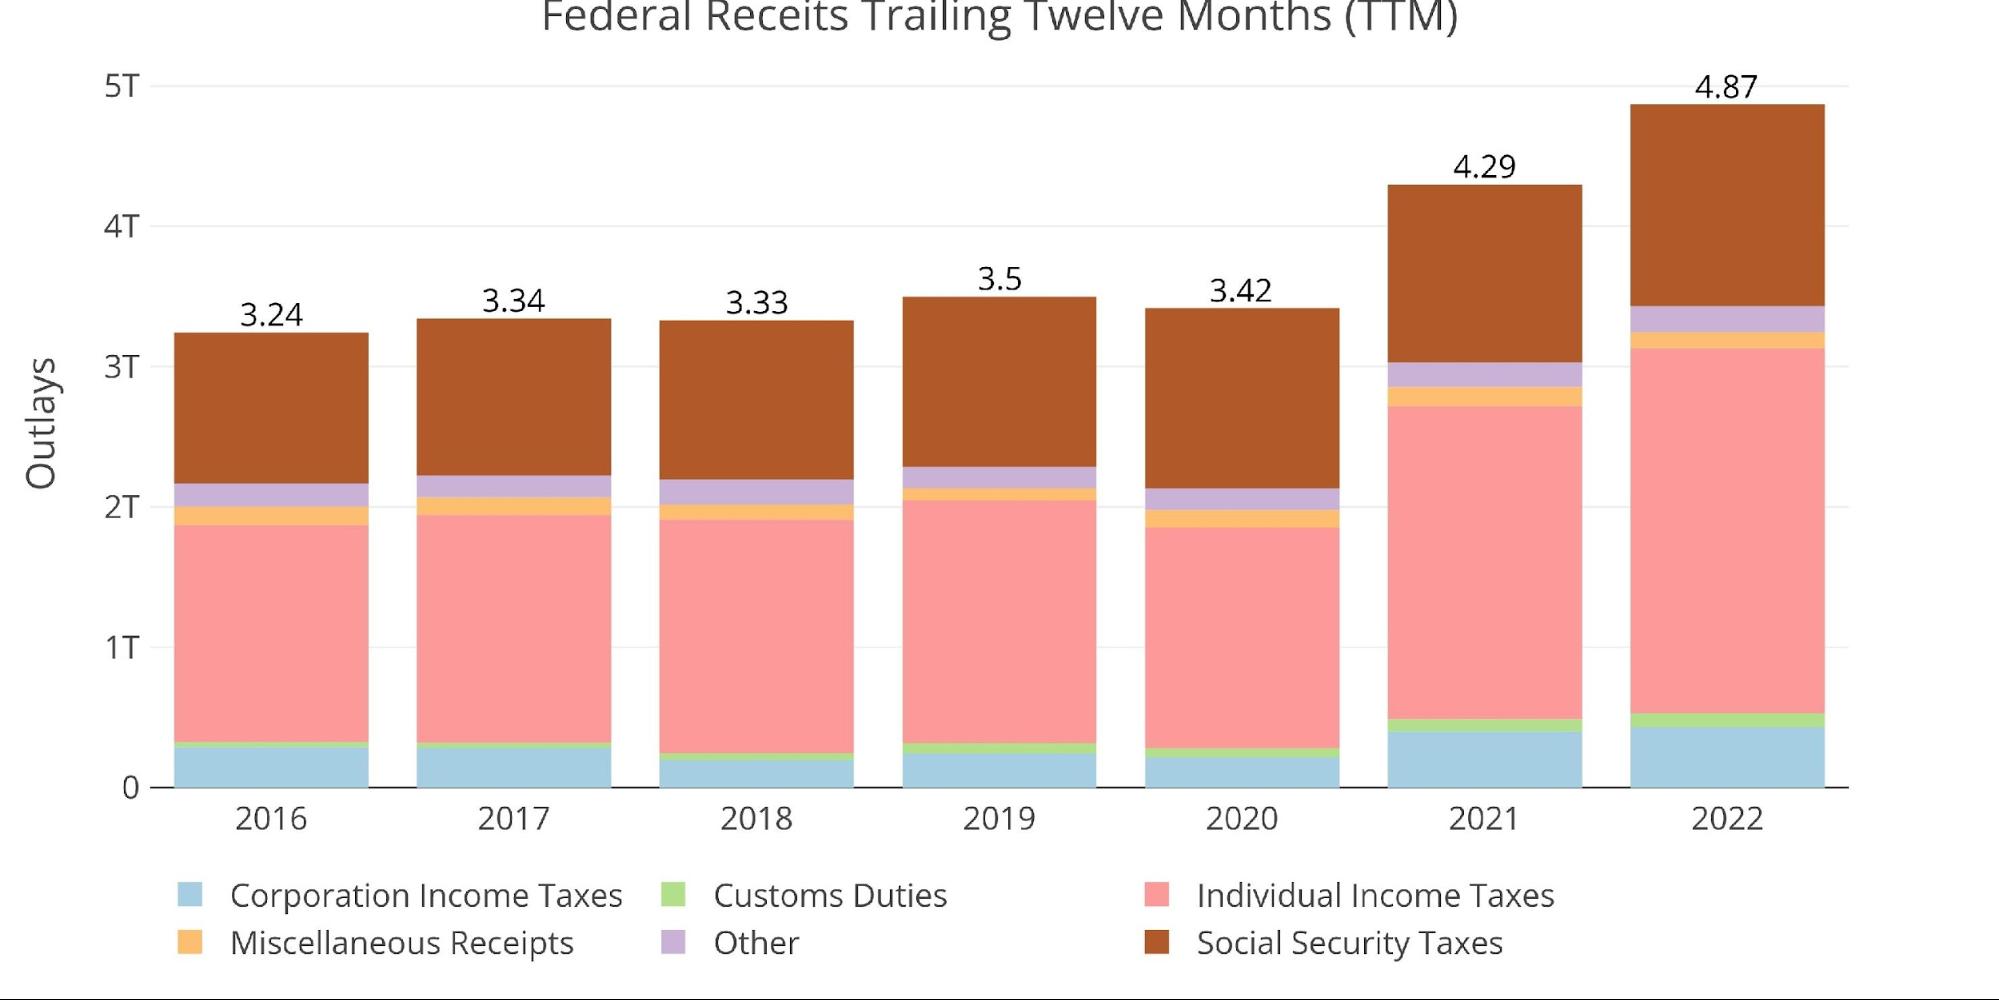
Figure: 11 Annual Federal Receipts
Despite no stimulus spending over the last 12 months (except for the Student Loan Forgiveness), spending still exceeded $6T in 2022. It has increased $1.77T or 39% since 2019.
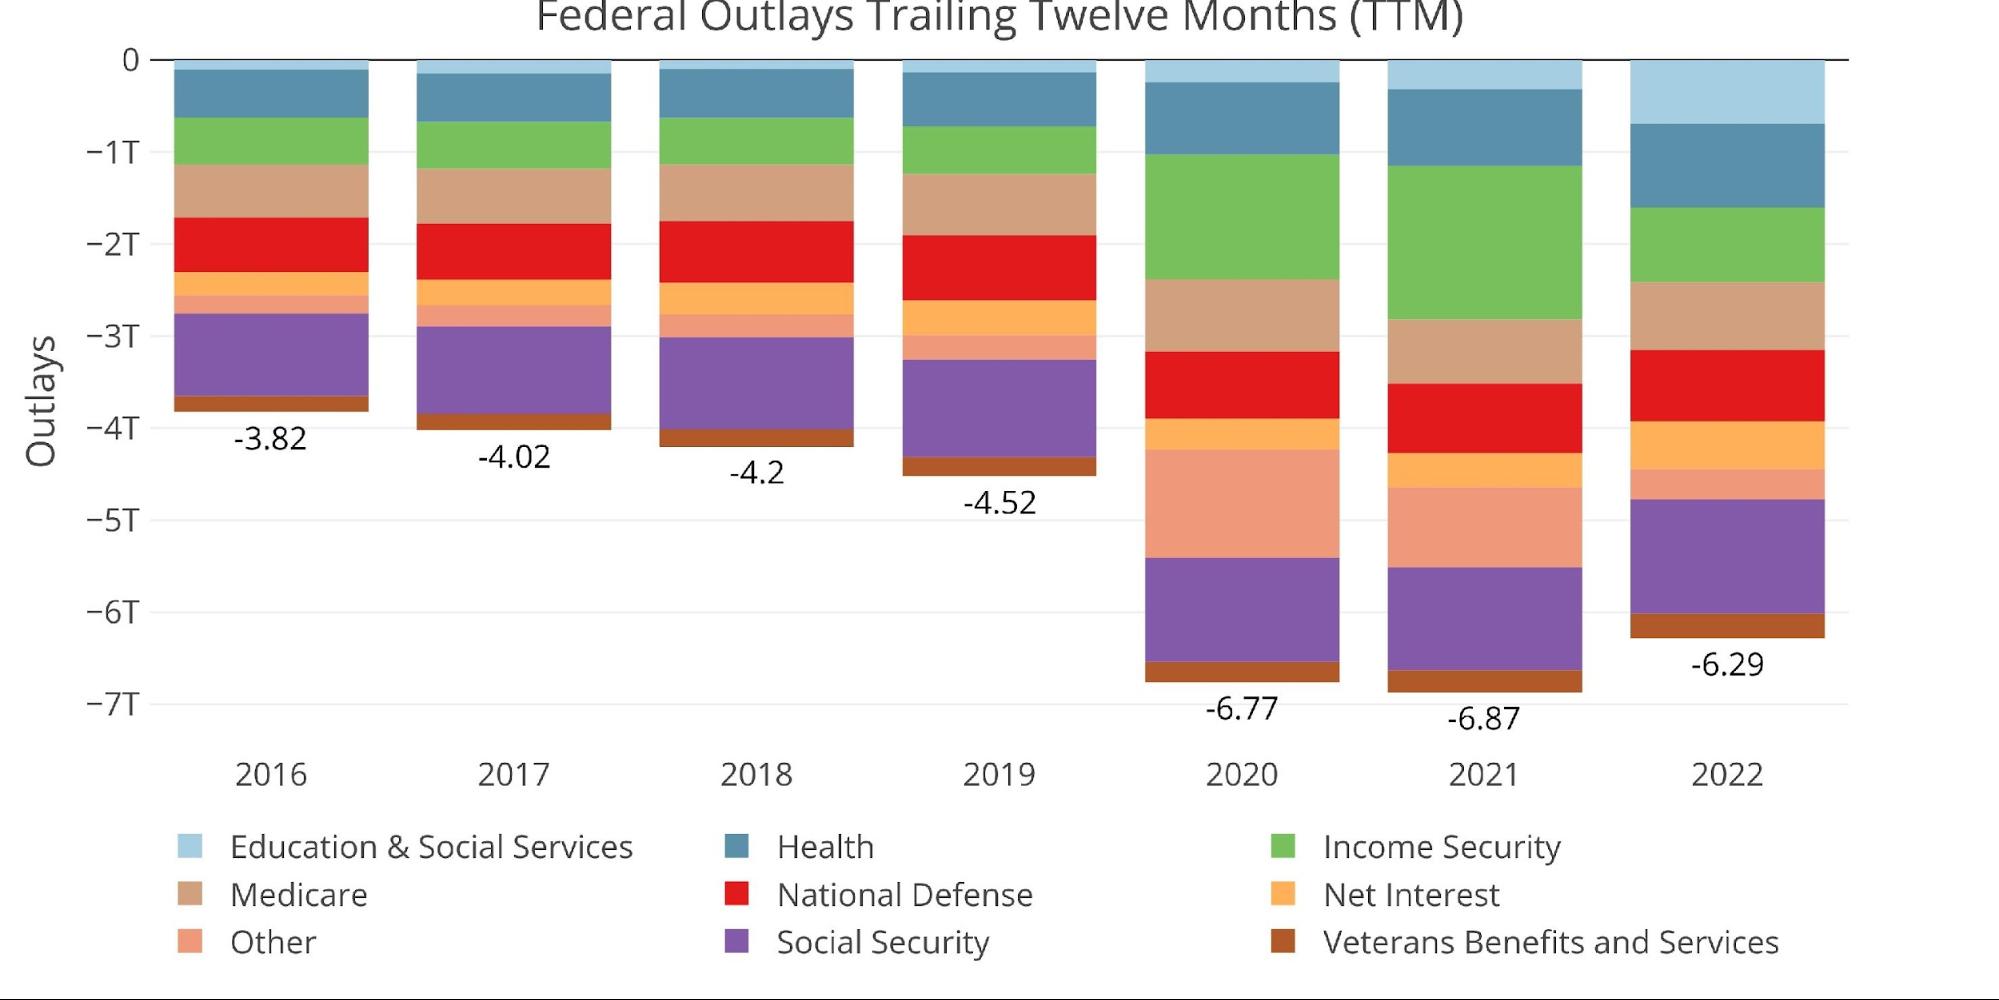
Figure: 12 Annual Federal Expenses
One bright spot for the Federal Government is that Social Security remains solvent (for now). The difference between revenue and payouts can be seen below. This comes at a price of course, over the last 10 years, the level of wages subject to Social Security tax has increased 41% from 113k to 160k in 2023. The increase from 2022 to 2023 was a whopping 9%, one of the biggest moves upward on record.
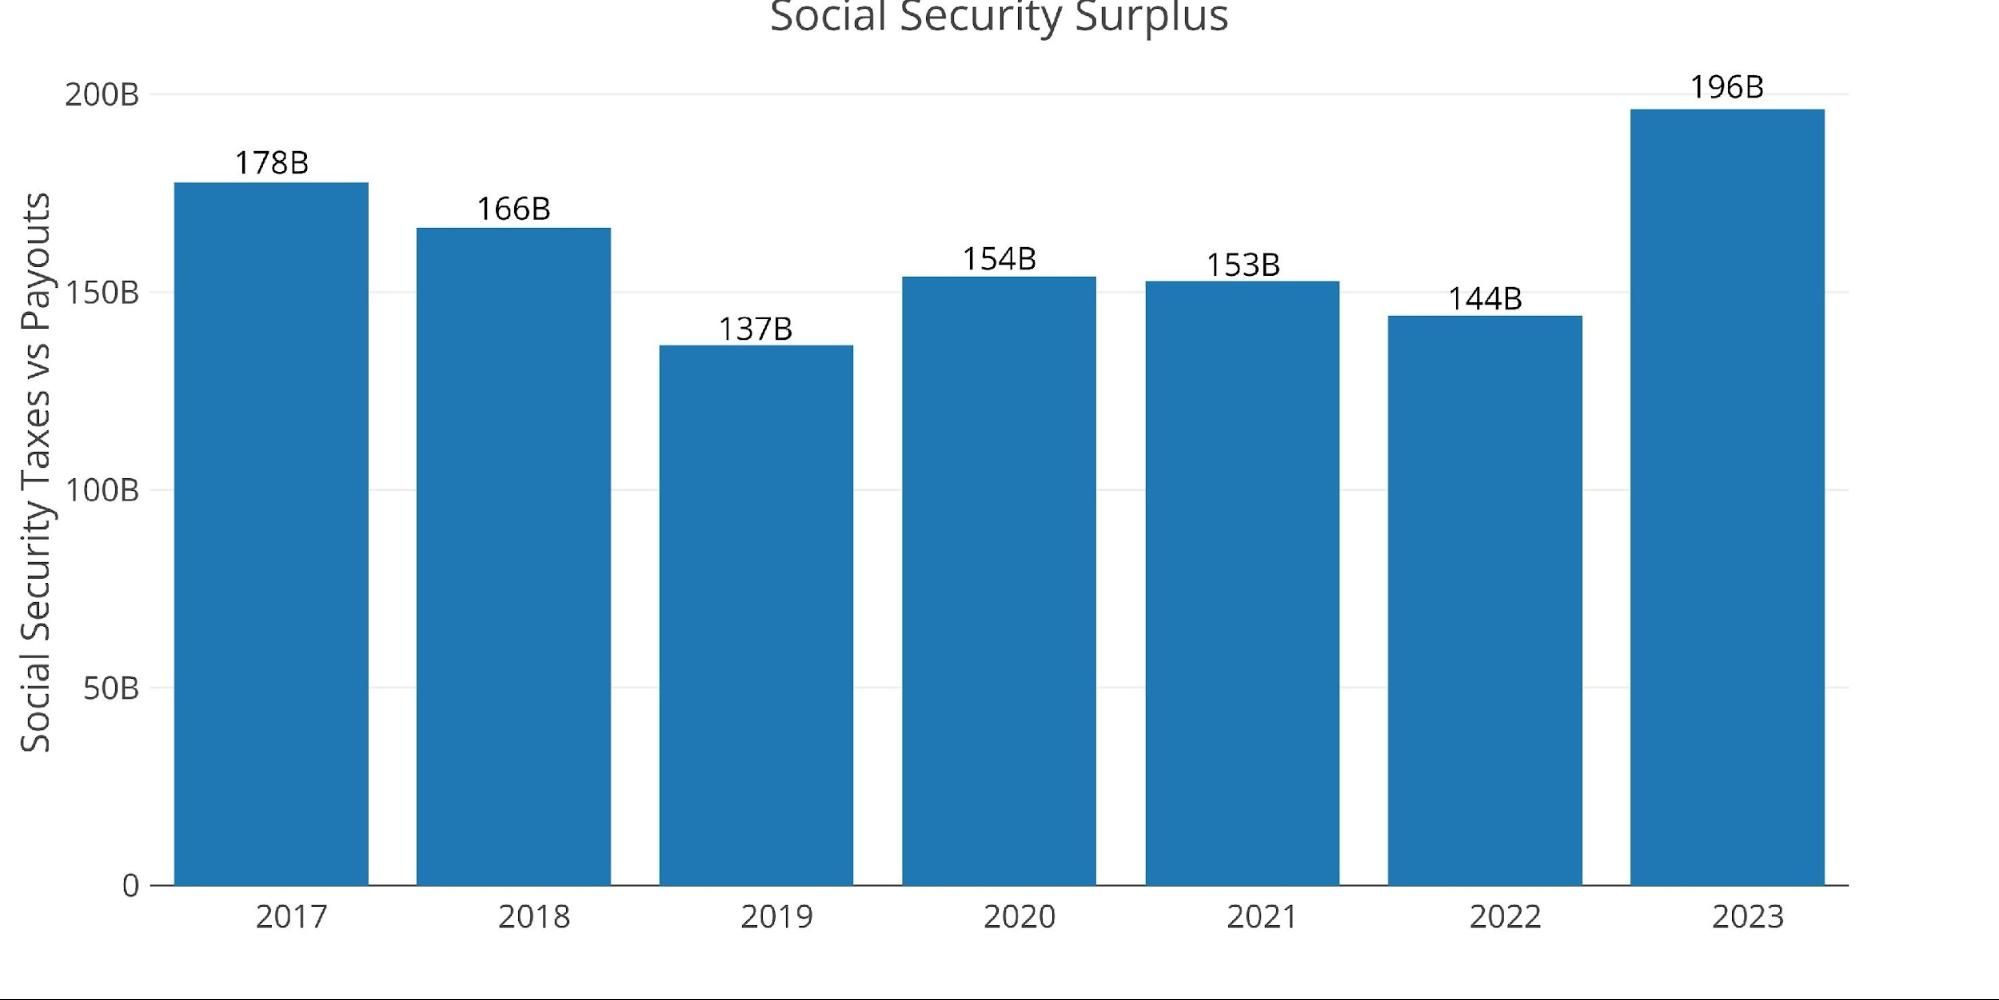
Figure: 13 Social Security
Despite massive expenditures driving huge deficits, the Deficit is down YoY as mentioned above. This has brought the TTM Deficit compared to GDP down to pre-Covid levels. It has moved back up in recent months and is now at 5.5% of GDP, up from 3.9% as recently as August.
Note: GDP Axis is set to log scale
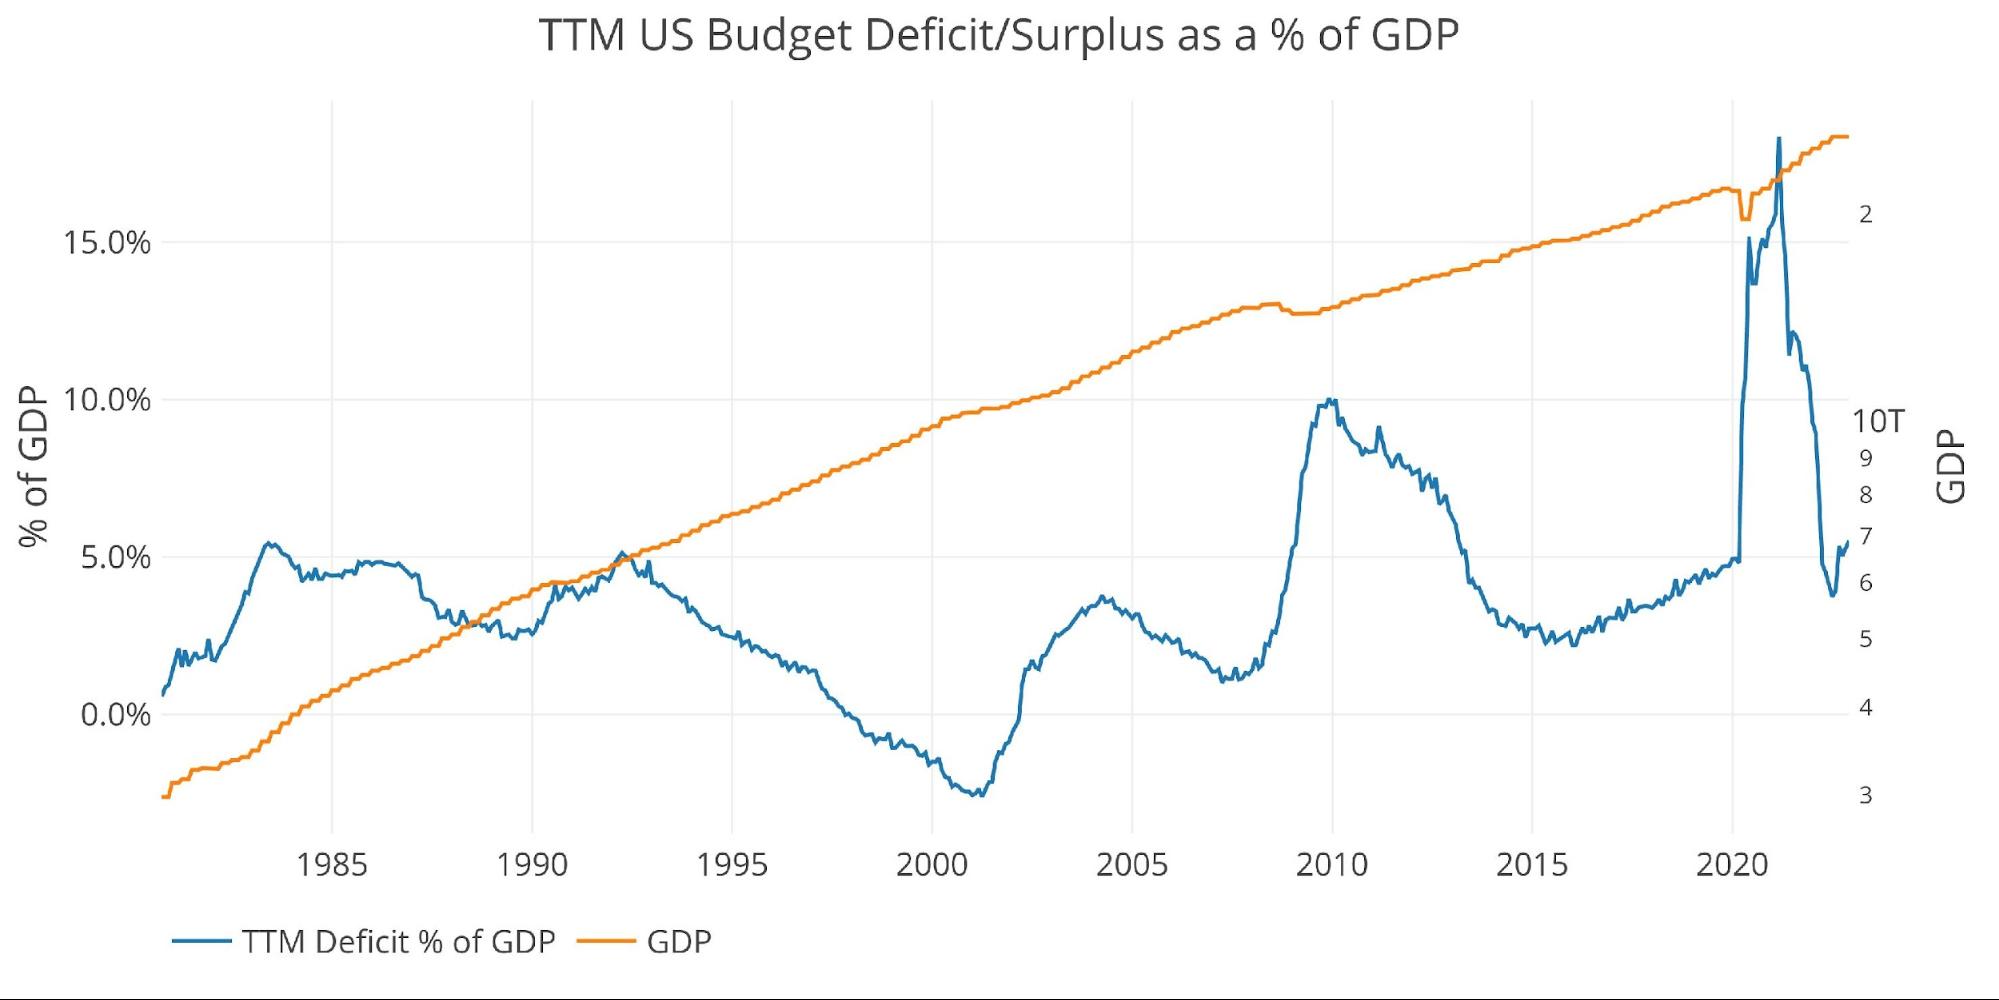
Figure: 14 TTM vs GDP
Wrapping Up
The Treasury is in trouble. Revenues have flatlined while expenses have started moving up. This led to a budget deficit in 2022 of $1.4T with no stimulus payments. There was the payout for college loan forgiveness (which could end up being reversed), but not much else. This is the new normal for the Federal government: +$6T in annual spending.
As bad as things seem, it may get worse. As interest expenses continue moving upward and revenues move down due to a recession and other temporary drivers, the budget could explode higher again very soon. With the Treasury set to issue more debt, either interest rates will have to go up or another big buyer will need to step in. That buyer will be the Fed.
This is why any relief in inflation is transitory. When the Fed pivots and inflation surge back, the markets will re-price in a hurry. Precious metals have entered 2023 with a bang, but once a pivot becomes clear, prices will likely move even higher.
Data Source: Monthly Treasury Statement
Data Updated: Monthly on eighth business day
Last Updated: Period ending Dec 2022
US Debt interactive charts and graphs can always be found on the Exploring Finance dashboard: https://exploringfinance.shinyapps.io/USDebt/

Call 1-888-GOLD-160 and speak with a Precious Metals Specialist today!
Buka akaun dagangan patuh syariah anda di Weltrade.
Source link