Forecast for XAUUSD 4 NOV 2022 for Fundamental Analysis and Technical Analysis

Gold : Fundamental Factors
1) Focus now turns to U.S. nonfarm payrolls data due later in the day, which is expected
to show resilience in the jobs market. This is likely to give the Fed enough economic headroom to keep raising interest rates, as the bank signaled this week.
2) Average Hourly Earnings m/m is expected to be the same as previously at 0.3%.
3) Traders are split 50/50 between expecting another 75bps rate hike and a downshift to 50bps, so we’re likely to see some market volatility regardless of how this month’s jobs report prints.
Trend is Bearish
Fundamental Range : 1,628.67 – 1,632.33

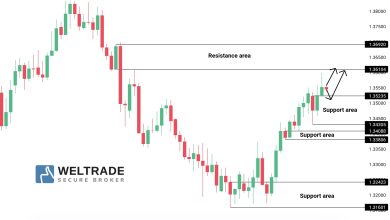
Gold : Technical Analysis
Check at Daily Timeframe Support and Resistance for Fibonacci.
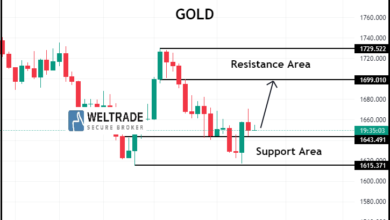
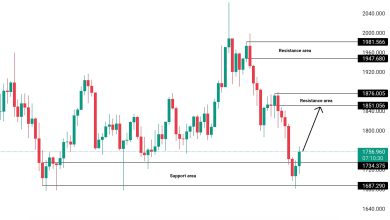
Resistance area : 1638.48,1644.22,1654.03
Support area: 1619.27,1613.34,1603.73
Pivot Point : 1629.19
Confirm with technical indicators and based on your own technical analysis for the trend.
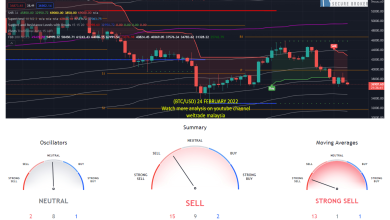
Check investing.com to get more info on what most indicator would display
Check higher timeframe also for more confirmation for entry in Daily timeframe.
The technical indicator display strong sell in Daily and strong sell in weekly and monthly timeframe, where we can entry sell for higher timeframe by following the resistance area given and vice versa
Use linear regression to get confirmation trend at daily as they are not available in investing.com
Linear regression shows a downward trend at the daily timeframe .Can check linear regression trend in weekly and monthly for more confirmation.For weekly, it is downtrend and for monthly,it is showing uptrend.
Use Bolinger Band Strategy Tester and RSI Strategy Tester to get more confirmation for the trend and percent profitable.Check at bigger timeframe also such as weekly and monthly.
Ensure that both RSI strategy and Bolinger Band Strategy gives above 50%. for the percent profitable.
RSI strategy tester and Bolinger Band Strategy Tester at the daily has percentage higher than 50% , supporting towards downtrend compare to the other timeframe such as Weekly and Monthly.
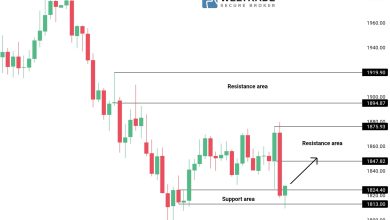
Gold : Find Sell at the daily chart by using the first resistance point, 1638.48 and take profit will be at the pivot point, 1629.19 , stop loss at resistance 2, 1644.22 (SEE CURRENT MARKET PRICE)
See current market and find the nearest resistance point for entry and take profit at the pivot point.
Gold : Fundamental and Technical analysis are aligned.
For further information, contact me ,Gurmit at +60142584067,I will guide anyone that would like to register with Weltrade. Can register at the below link. Thank you.
https://my.weltrade.com/?r1=ipartner&r2=49989
Disclaimer : This analysis is based on Investing.com and Forexfactory.com. You may follow based on your own discreetion.
Can join at our telegram group at https://t.me/weltrade_my
For traders who want to trade on their own can join Weltrade, we provide benefits for traders out there, learn to trade and follow free signals such as free paid signal providers, bookmap gold and tradingview premium live.
Free Bookmap Education t.me/+JetSe33YA0U2ZDk1
Join us at our zoom for online learning from 10.30am to 11.30am by the Financial Markets Research Center (FMRC) team. With Cikgu Hafiz and Cikgu Gurmit
Link: https://us06web.zoom.us/j/81843968428?pwd=VkZ3L2UrcXh2WlZsZHU3ZFFGUmJMQT09
Komen anda
Source link