Breaking Down the Balance Sheet
The Fed is supposed to be reducing the balance sheet by $95B a month. This is up from $47.5B before September. As the chart below shows, the Fed has only succeeded in meeting or exceeding its goal a single time (August) in 6 months.
In the latest month, the Fed came up 25% short with a taper of only $72B. Even when removing the $10B increase of “Other”, which is a range of other instruments not related to MBS or Treasury, the Fed was still over $12B short of target.
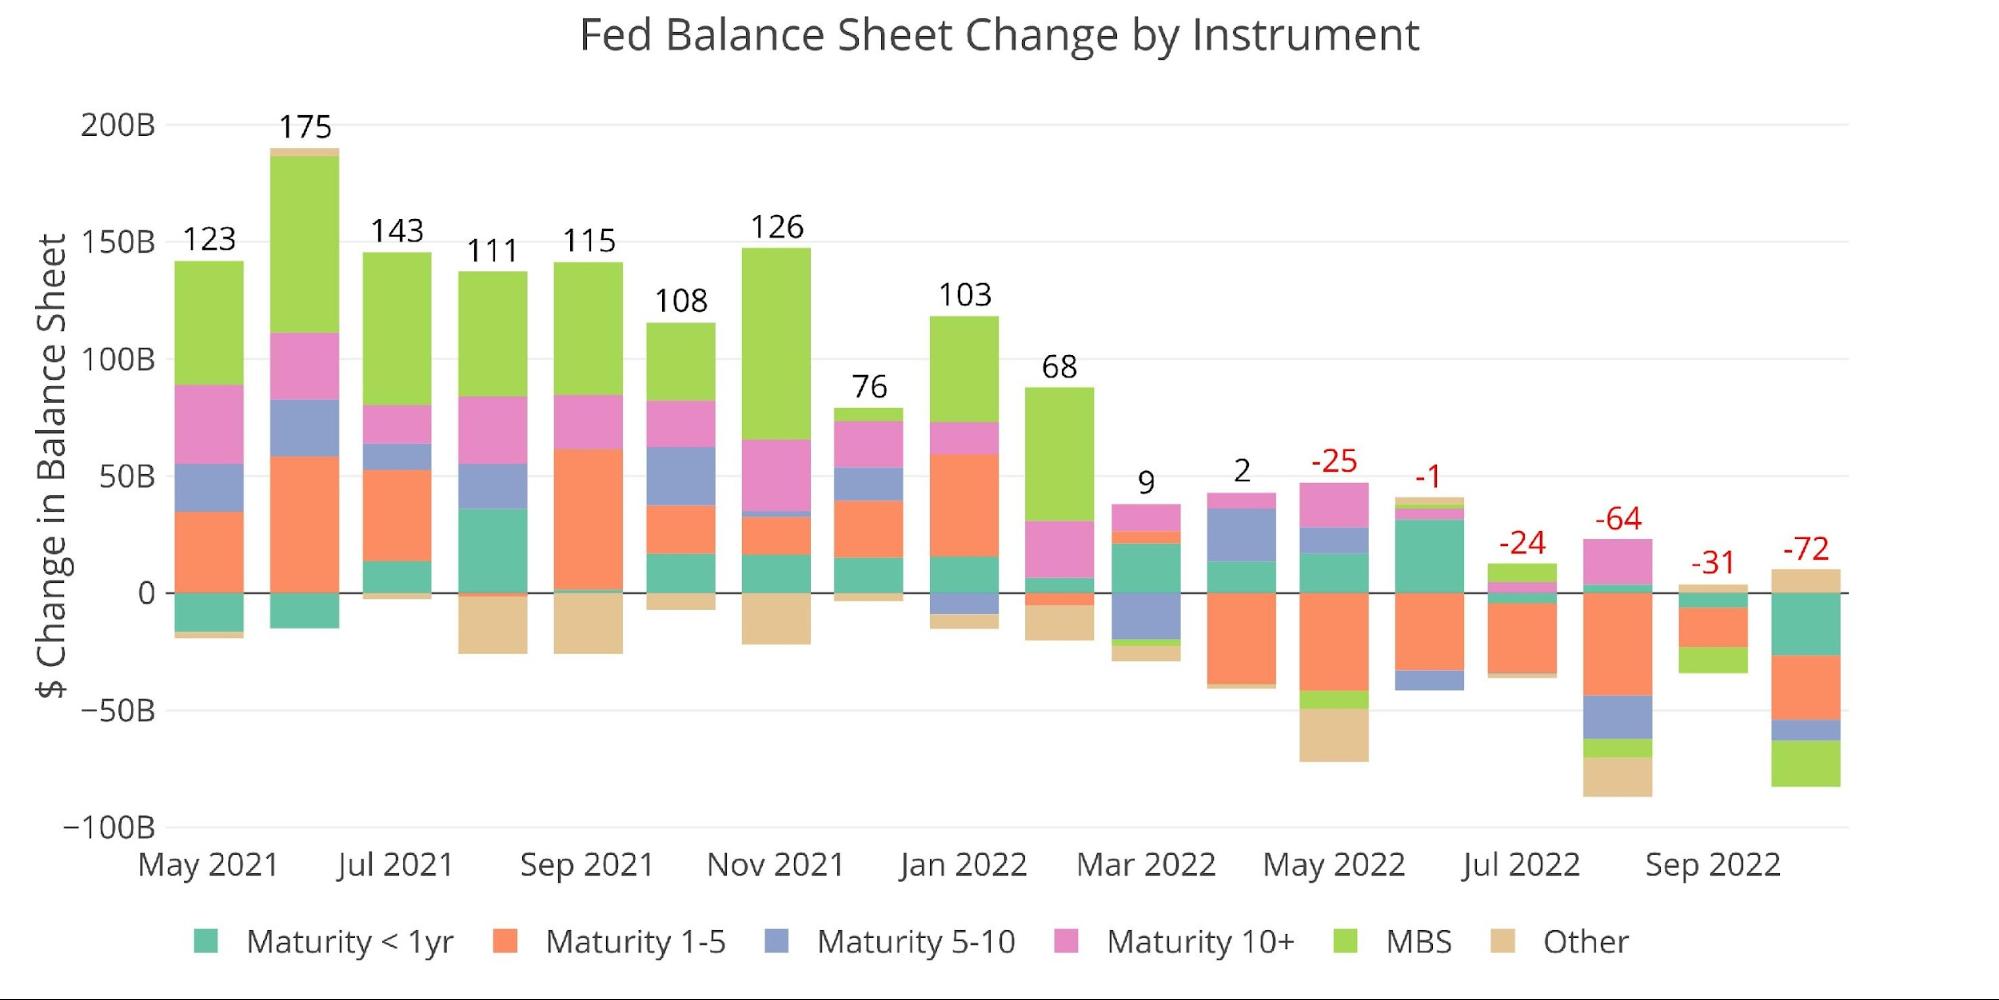
Figure: 1 Monthly Change by Instrument
The table below details the movement for the month:
-
- The Treasury market saw reductions across all maturities totaling $59.1B
-
- This is almost 10% below the $65B target
-
- MBS missed by a much bigger amount: 42% or $14.8B
-
- The Fed has much more trouble reducing MBS and has not come close to its target for a single month
-
- The Treasury market saw reductions across all maturities totaling $59.1B

Figure: 2 Balance Sheet Breakdown
Looking at the weekly data shows that the last four weeks have shown a more consistent drawdown, even compared to the four weeks prior in September. MBS only saw a reduction in the latest week and had been flat for October leading up to the report yesterday.

Figure: 3 Fed Balance Sheet Weekly Changes
The Fed is in an uphill battle. The bond market has reacted very quickly to the moves by the Fed to raise interest rates this year. The long side of the curve has not yet felt the implications of QT, as longer rates are still below short-term rates. This could be by design and explain why the Fed is not able to reach its QT objectives. Higher rates are already wreaking havoc on the Federal budget.
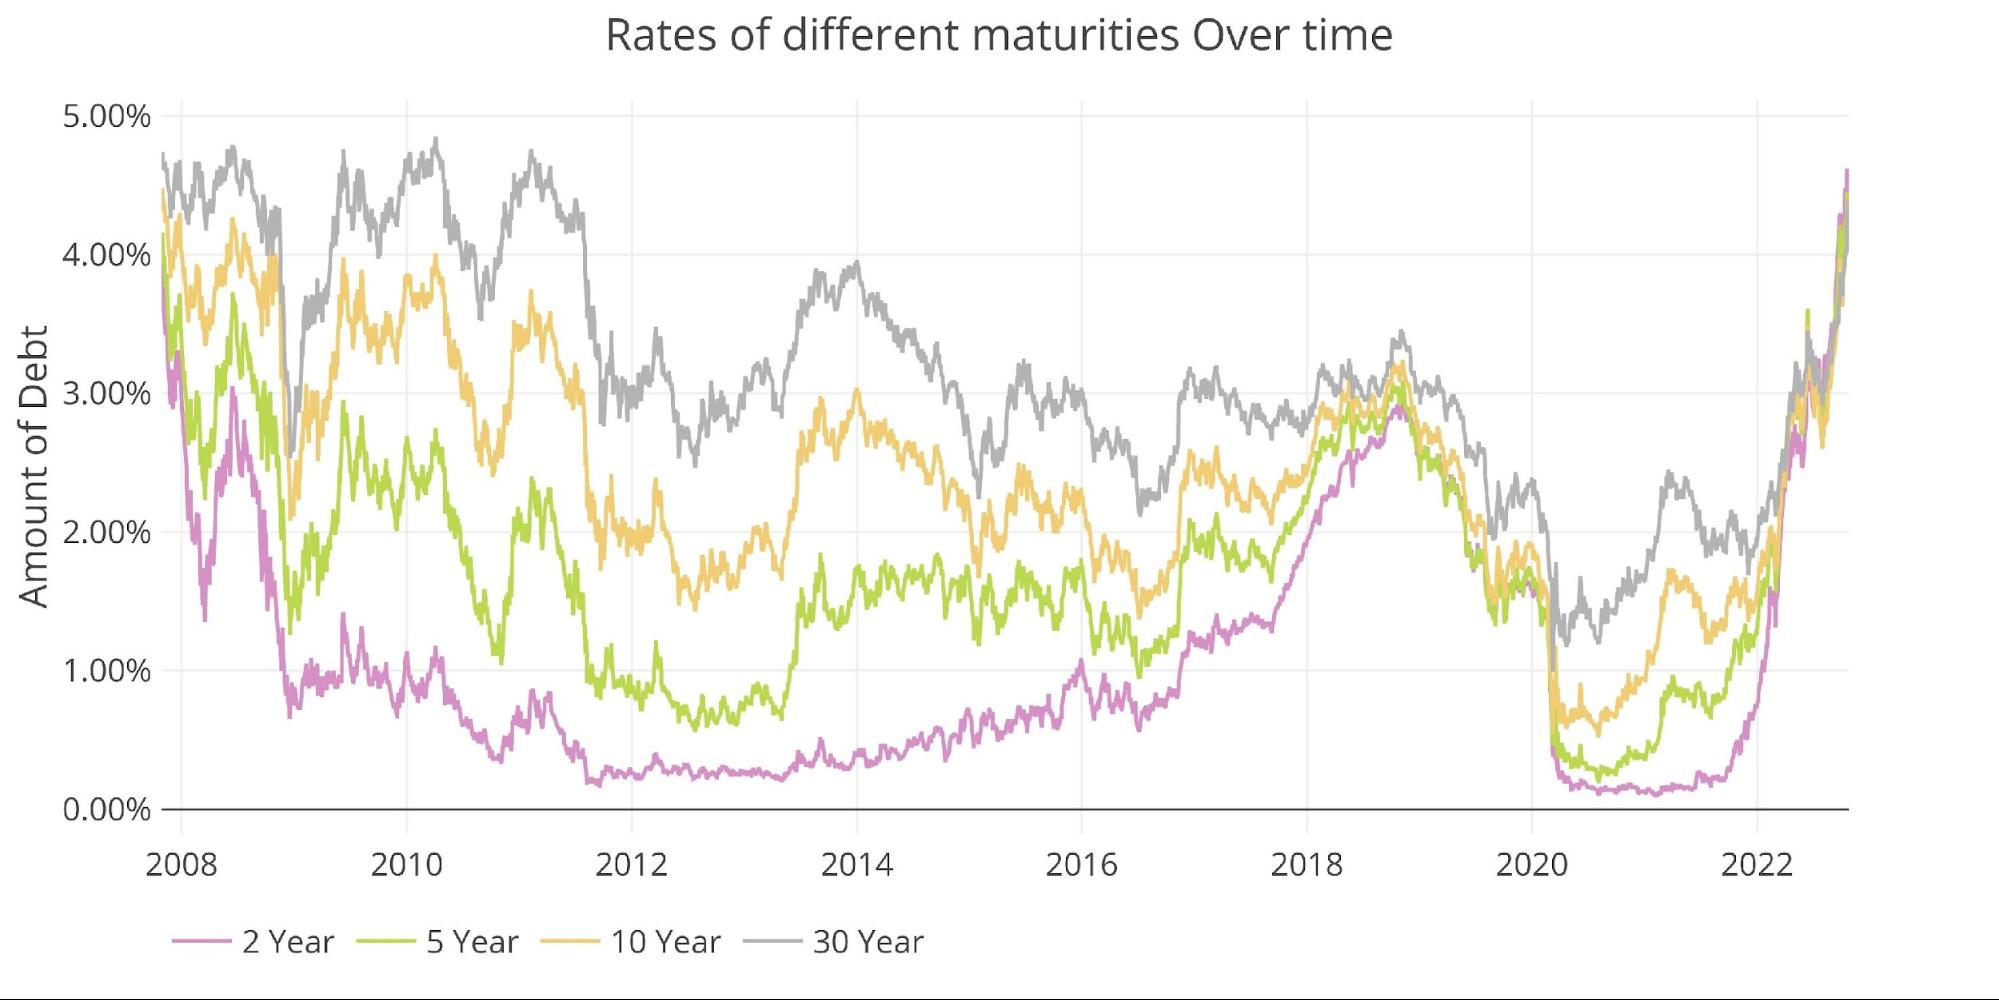
Figure: 4 Interest Rates Across Maturities
The inverted yield curve continues to flash warning signs of market turmoil ahead.
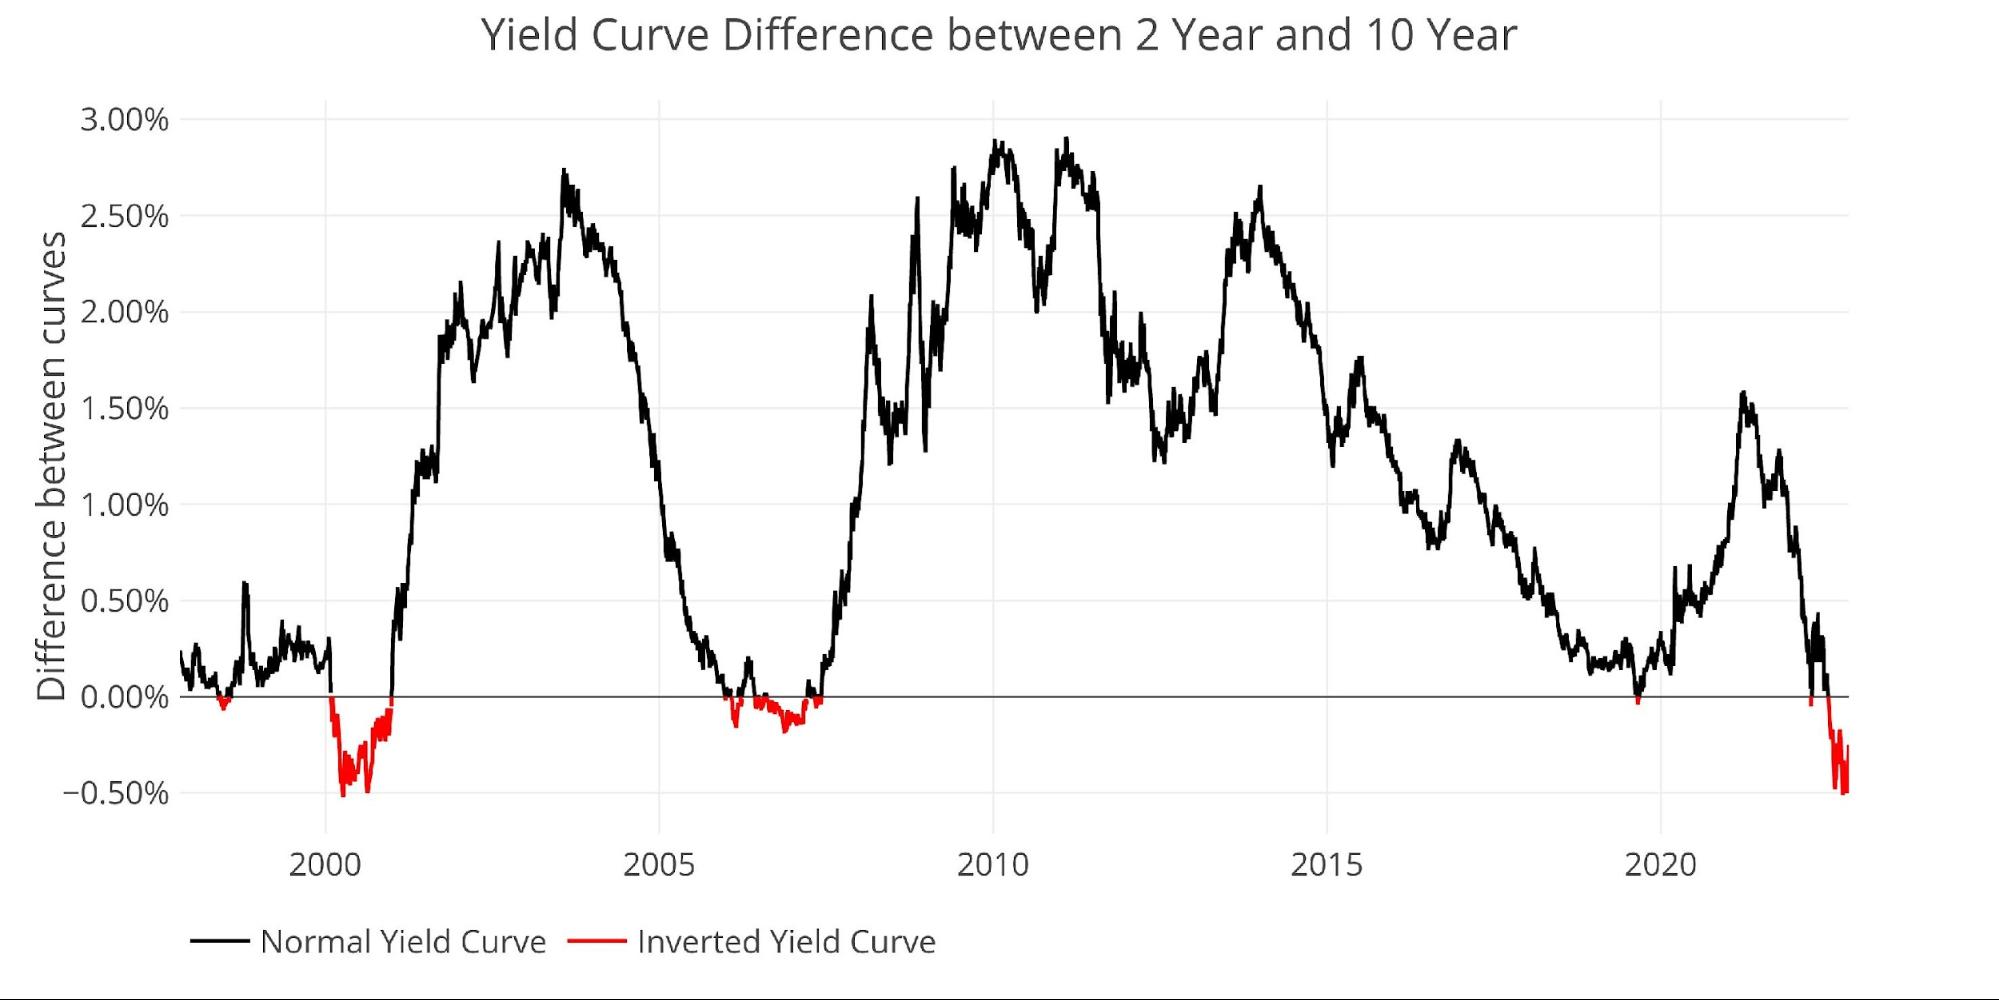
Figure: 5 Tracking Yield Curve Inversion
Despite a pullback in rates this week, the entire yield curve is above where it was one month ago. It is also even more inverted as shown by the red line being higher than the blue line on the shorter end of the curve.

Figure: 6 Tracking Yield Curve Inversion
Who Will Fill the Gap?
Bloomberg recently published an article that shows how the typical Treasury buyers have all stepped back from the market. First and foremost, this includes the Fed which has been the biggest buyer in the market for two years. It also includes institutional investors and foreign countries.
As shown below, international holders have completely stopped buying and have even reduced holdings. It’s hard to tell if some of the drop is due to market price fluctuations (as rates go up, prices go down) or actually a reduction in holdings. One thing is for sure though, foreign governments are no longer accumulating Treasuries.
Note: data was last published in August when rates were lower and bond prices were higher
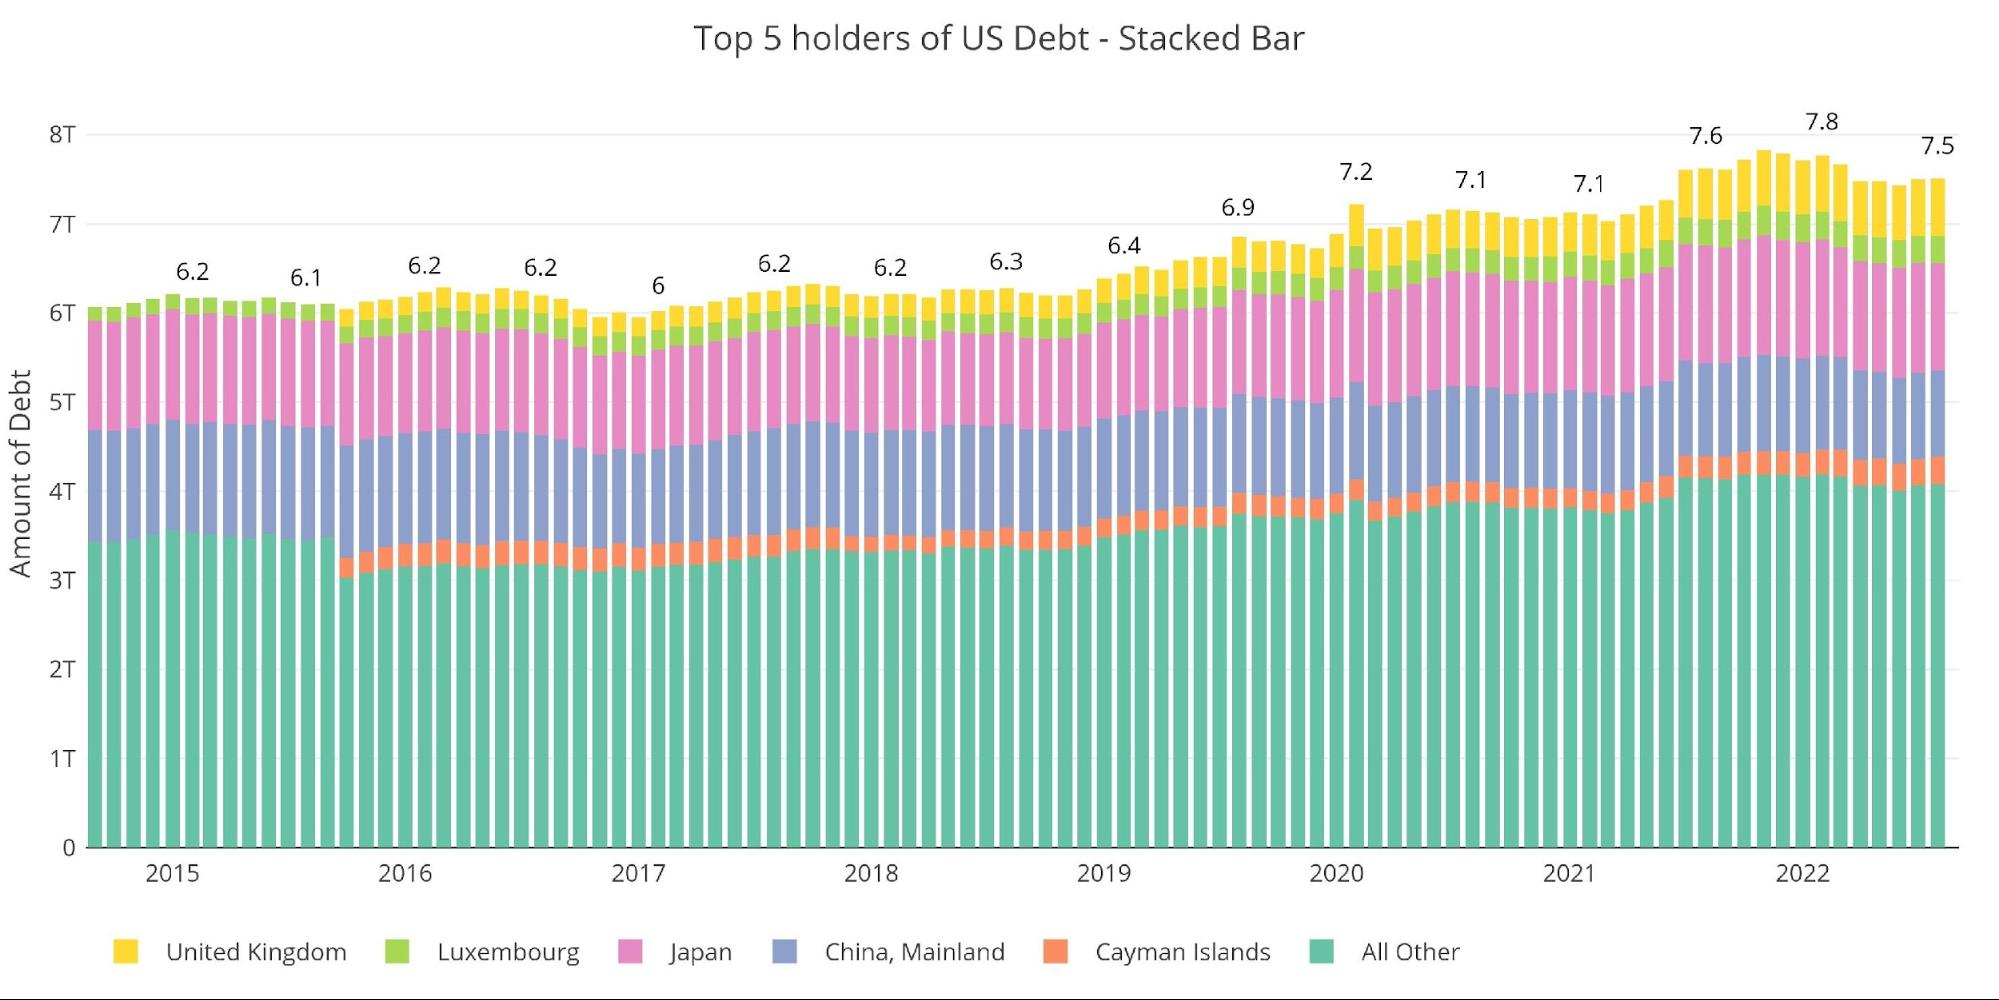
Figure: 7 International Holders
The table below shows how debt holding has changed since 2015 across different borrowers. The net change over the last year is a reduction of $110B. The bigger area of concern though is that China and Japan are down a combined $200B. Behind the Fed, China and Japan had been some of the biggest buyers. Not anymore!
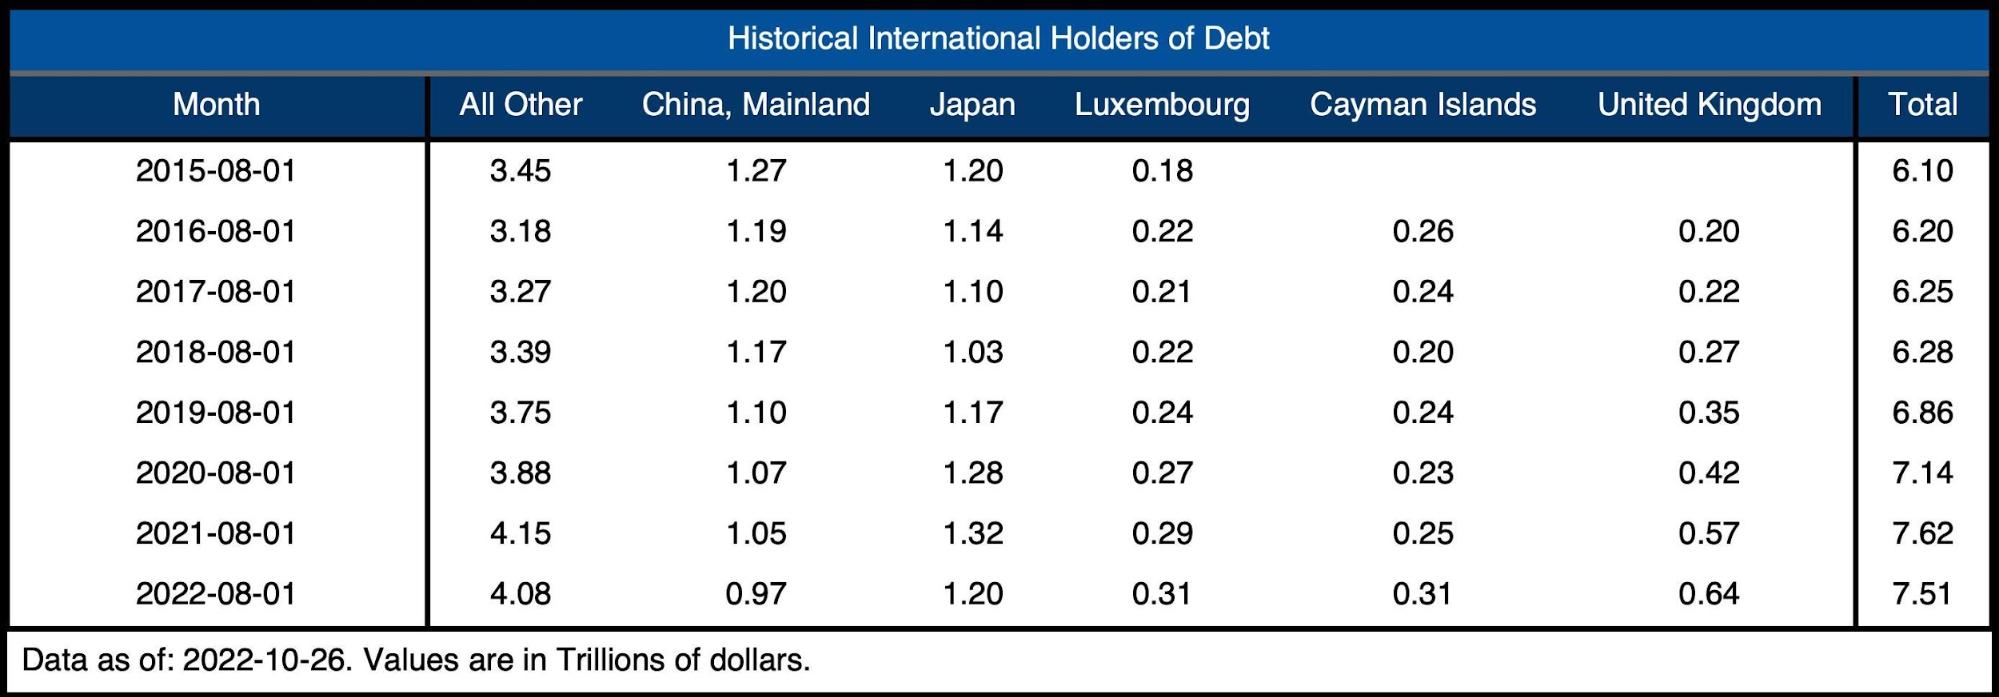
Figure: 8 Average Weekly Change in the Balance Sheet
Historical Perspective
The final plot below takes a larger view of the balance sheet. It is clear to see how the usage of the balance sheet has changed since the Global Financial Crisis. The tapering from 2017-2019 can be seen in the slight dip before the massive surge due to Covid. It’s highly unlikely the new round of QT will last as long or shrink the balance sheet as much as it did in 2018.
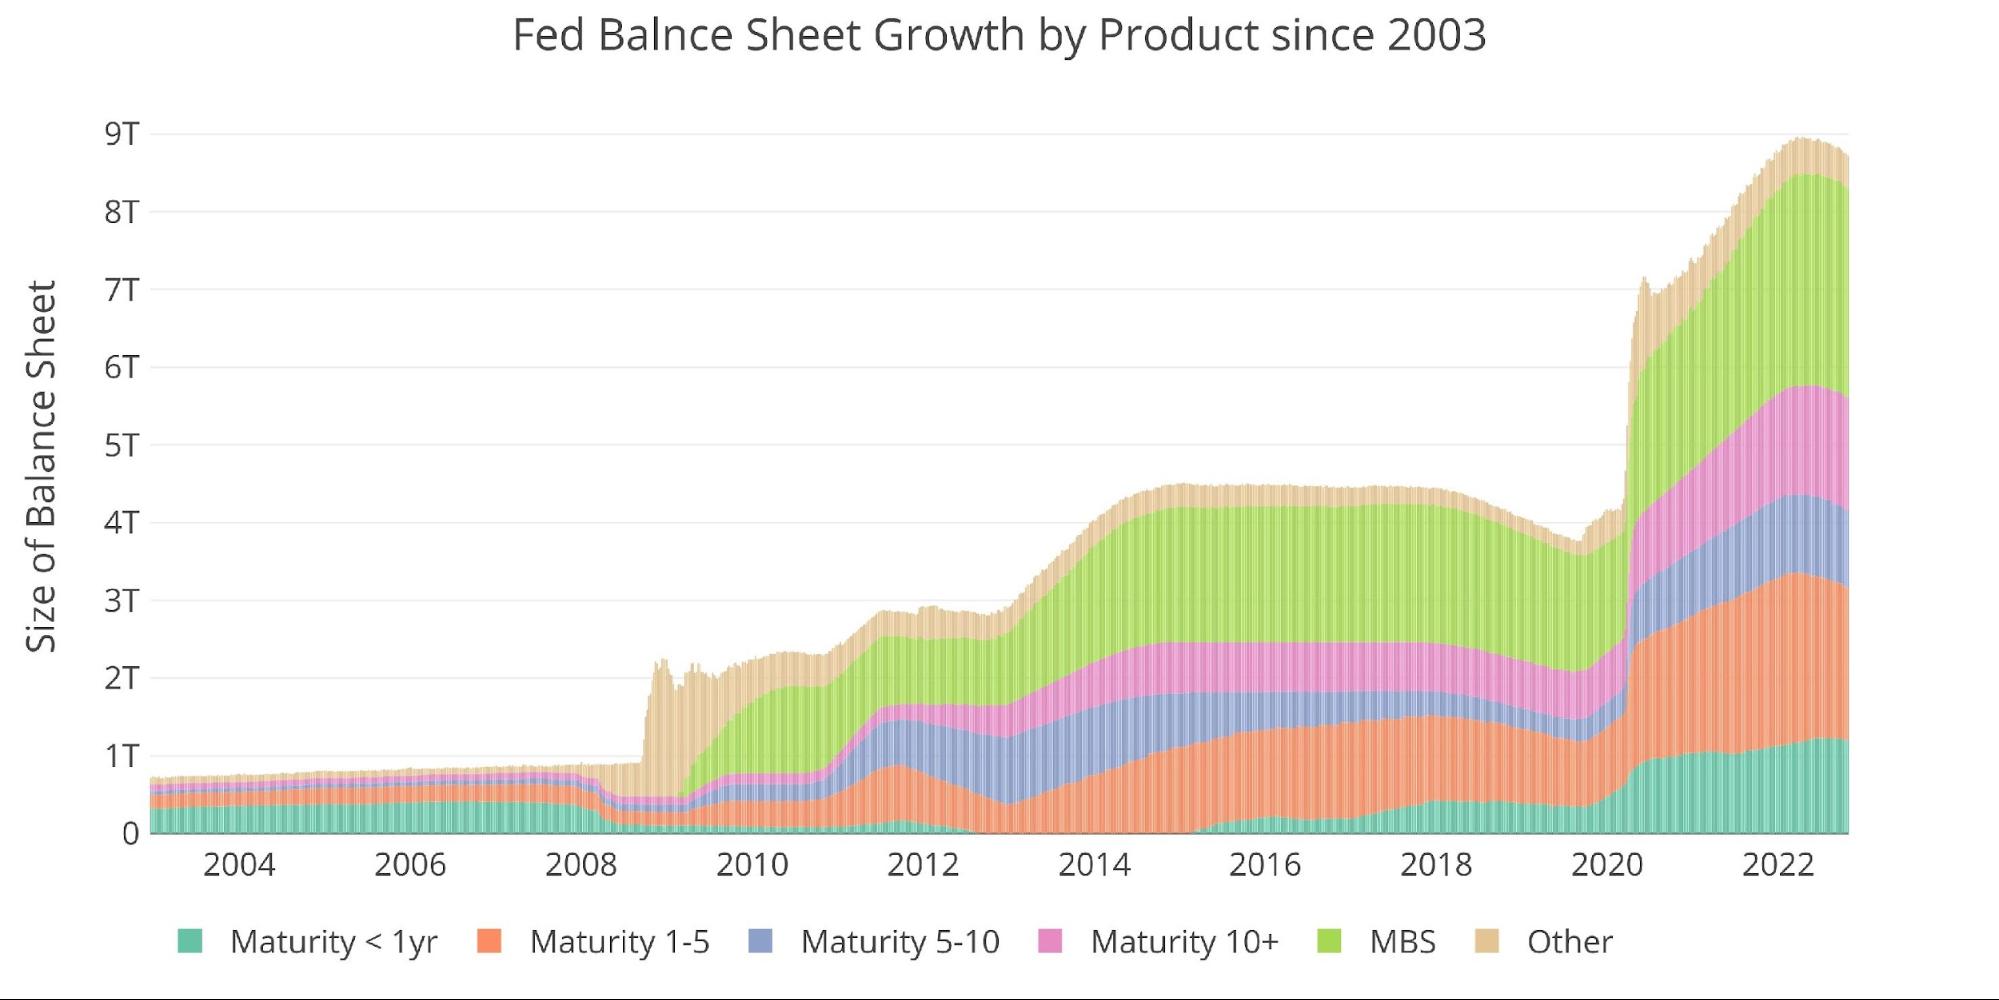
Figure: 9 Historical Fed Balance Sheet
What it means for Gold and Silver
The housing market is under incredible strain even with the Fed holding off on reducing its MBS holdings. The Treasury market has been a nightmare for investors. It finally got some relief this week as talks of a soft pivot emerged.
It’s highly unlikely the tightening will continue given the strain on the economy and financial markets. UBS is already predicting the Fed to end QT in 2023, which will leave the balance sheet north of $8B. When the next crisis hits (or the current one worsens), the Fed will go back to QE and likely see the balance sheet balloon north of $10B.
Make no mistake. This is debt monetization that was kicked into high gear by the latest Nobel Prize winner (Bernanke). When the Fed returns to the Bernanke playbook, inflation will be above 2%. This will be the final reveal to the markets that the Fed has been bluffing all along.
When the Fed folds, the temporary surge in the USD will reverse. This will likely send precious metals skyrocketing. Smart investors are ahead of the game and have been quietly and strategically emptying the Comex vaults. Purchasing some physical now is a great insurance hedge against the turmoil that lies ahead.
Data Source: https://fred.stlouisfed.org/series/WALCL and https://fred.stlouisfed.org/release/tables?rid=20&eid=840849#snid=840941
Data Updated: Weekly, Thursday at 4:30 PM Eastern
Last Updated: Oct 26, 2022
Interactive charts and graphs can always be found on the Exploring Finance dashboard: https://exploringfinance.shinyapps.io/USDebt/

Call 1-888-GOLD-160 and speak with a Precious Metals Specialist today!
Buka akaun dagangan patuh syariah anda di Weltrade.
Source link