
According to the BLS, the economy added 263k jobs in September, which was slightly below analyst estimates. Education and Health led the way with strong hiring along with Leisure and Hospitality.
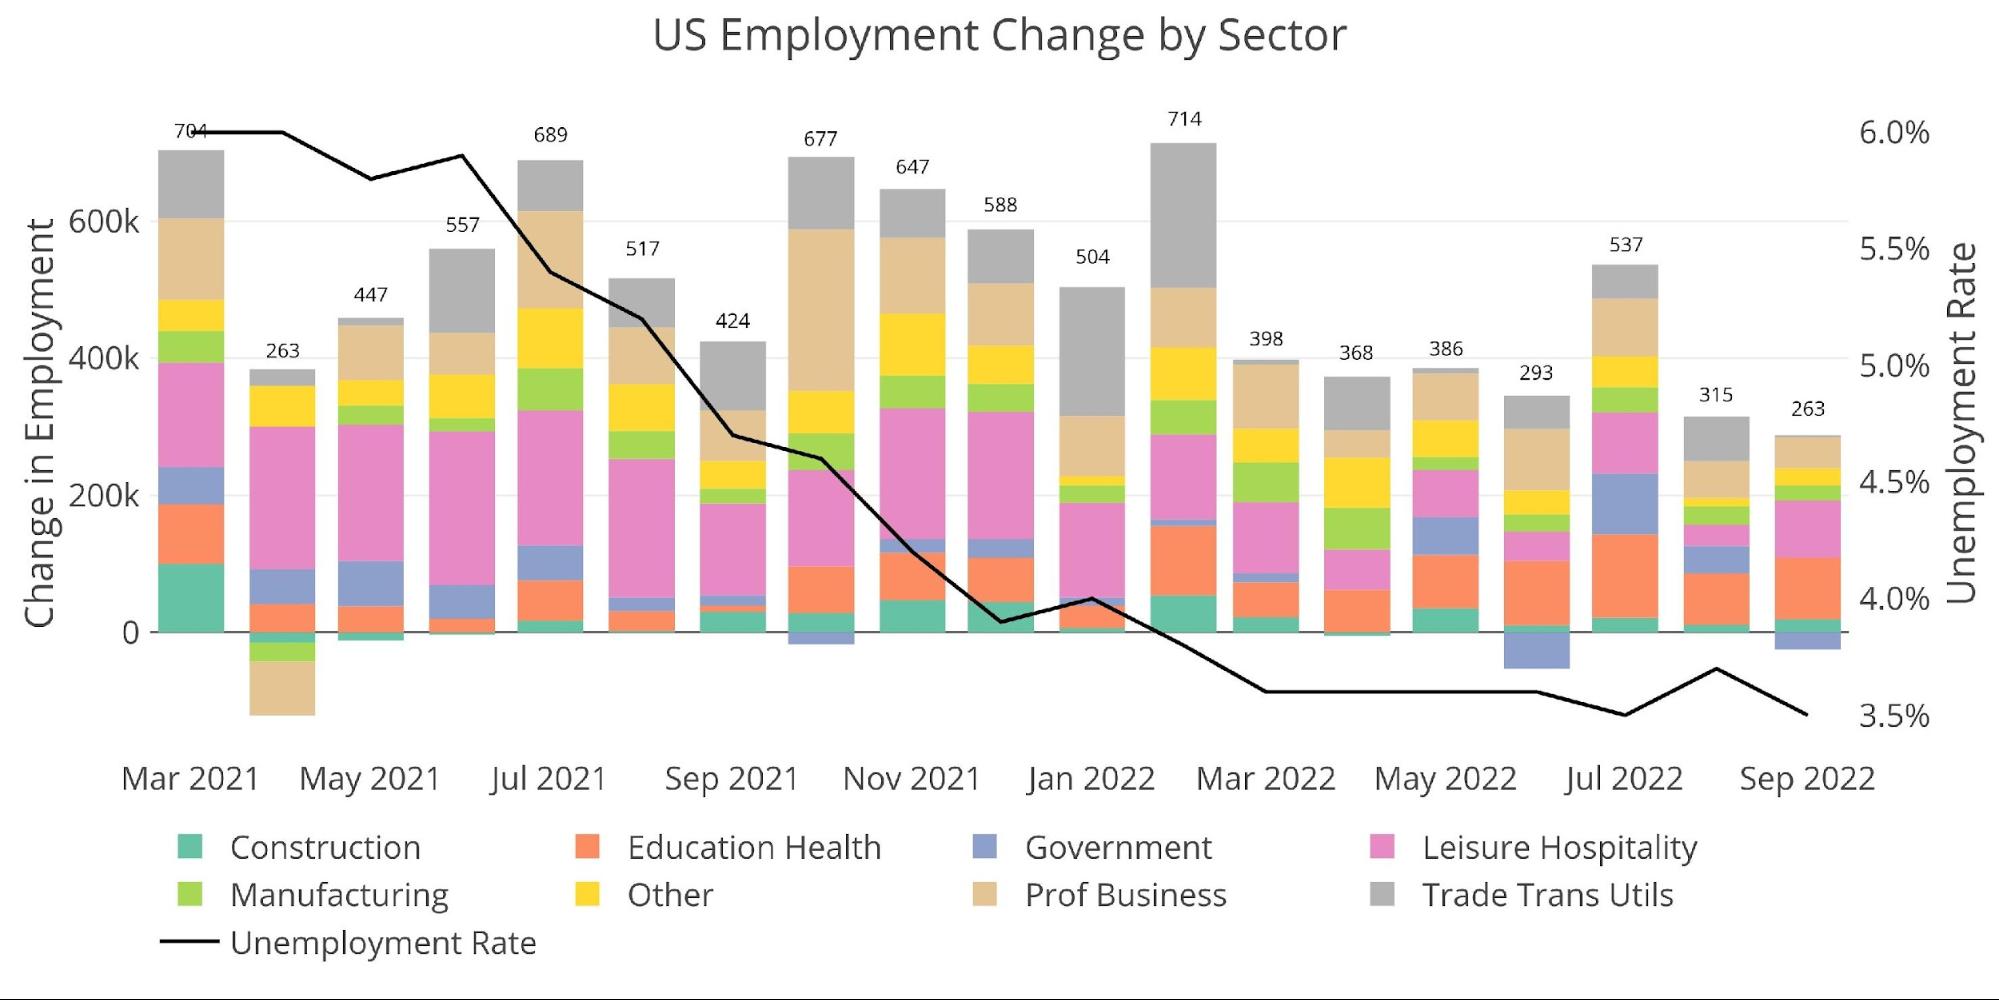
Figure: 1 Change by sector
The number of people with multiple jobs has reached a post-pandemic high at 7.7M but stayed flat MoM. This value is back in-line with pre-Covid levels. As inflation continues to crush middle and lower-class workers, it will be interesting to see if this number keeps moving up.
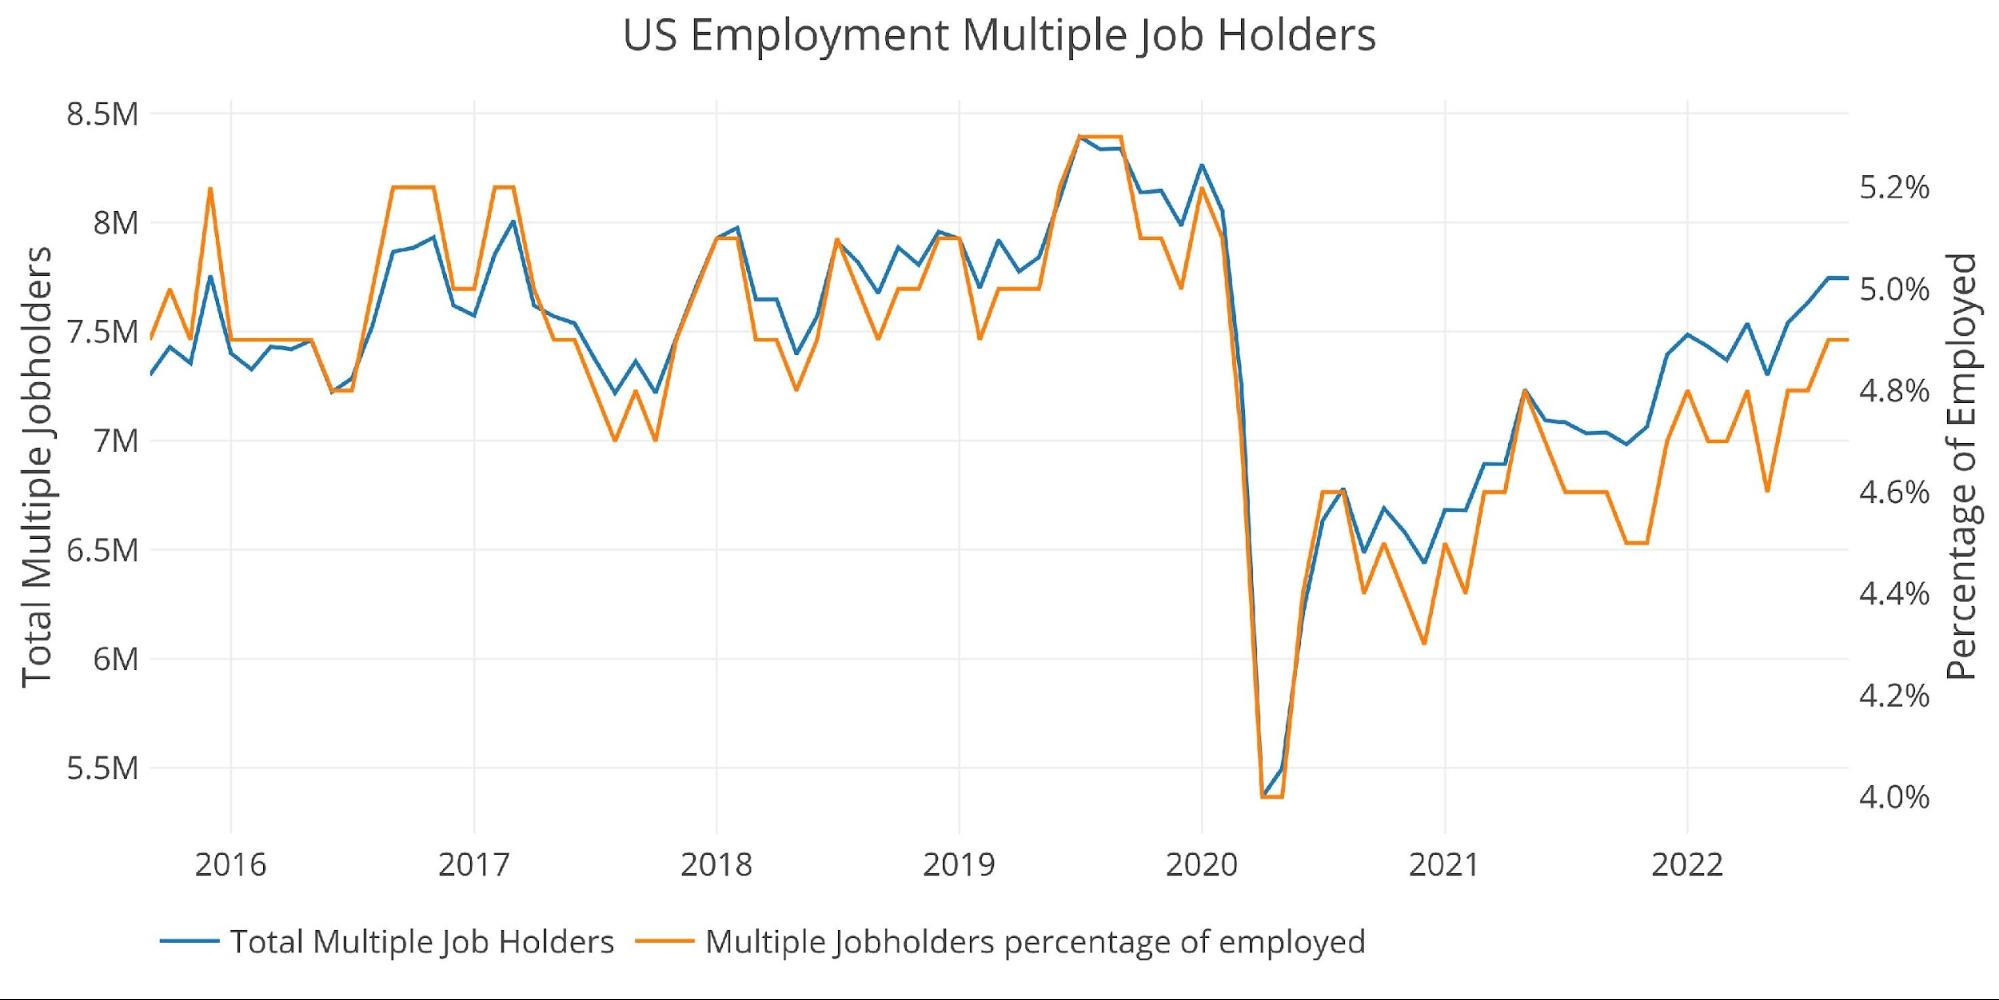
Figure: 2 Multiple Full-Time Employees
An even bigger signal of the challenging economy is the number of people who have multiple full-time jobs. These are individuals who are working 80 hours a week at two different jobs to make ends meet. This figure reached 440k workers last month but has come down slightly from that record high to 420k.
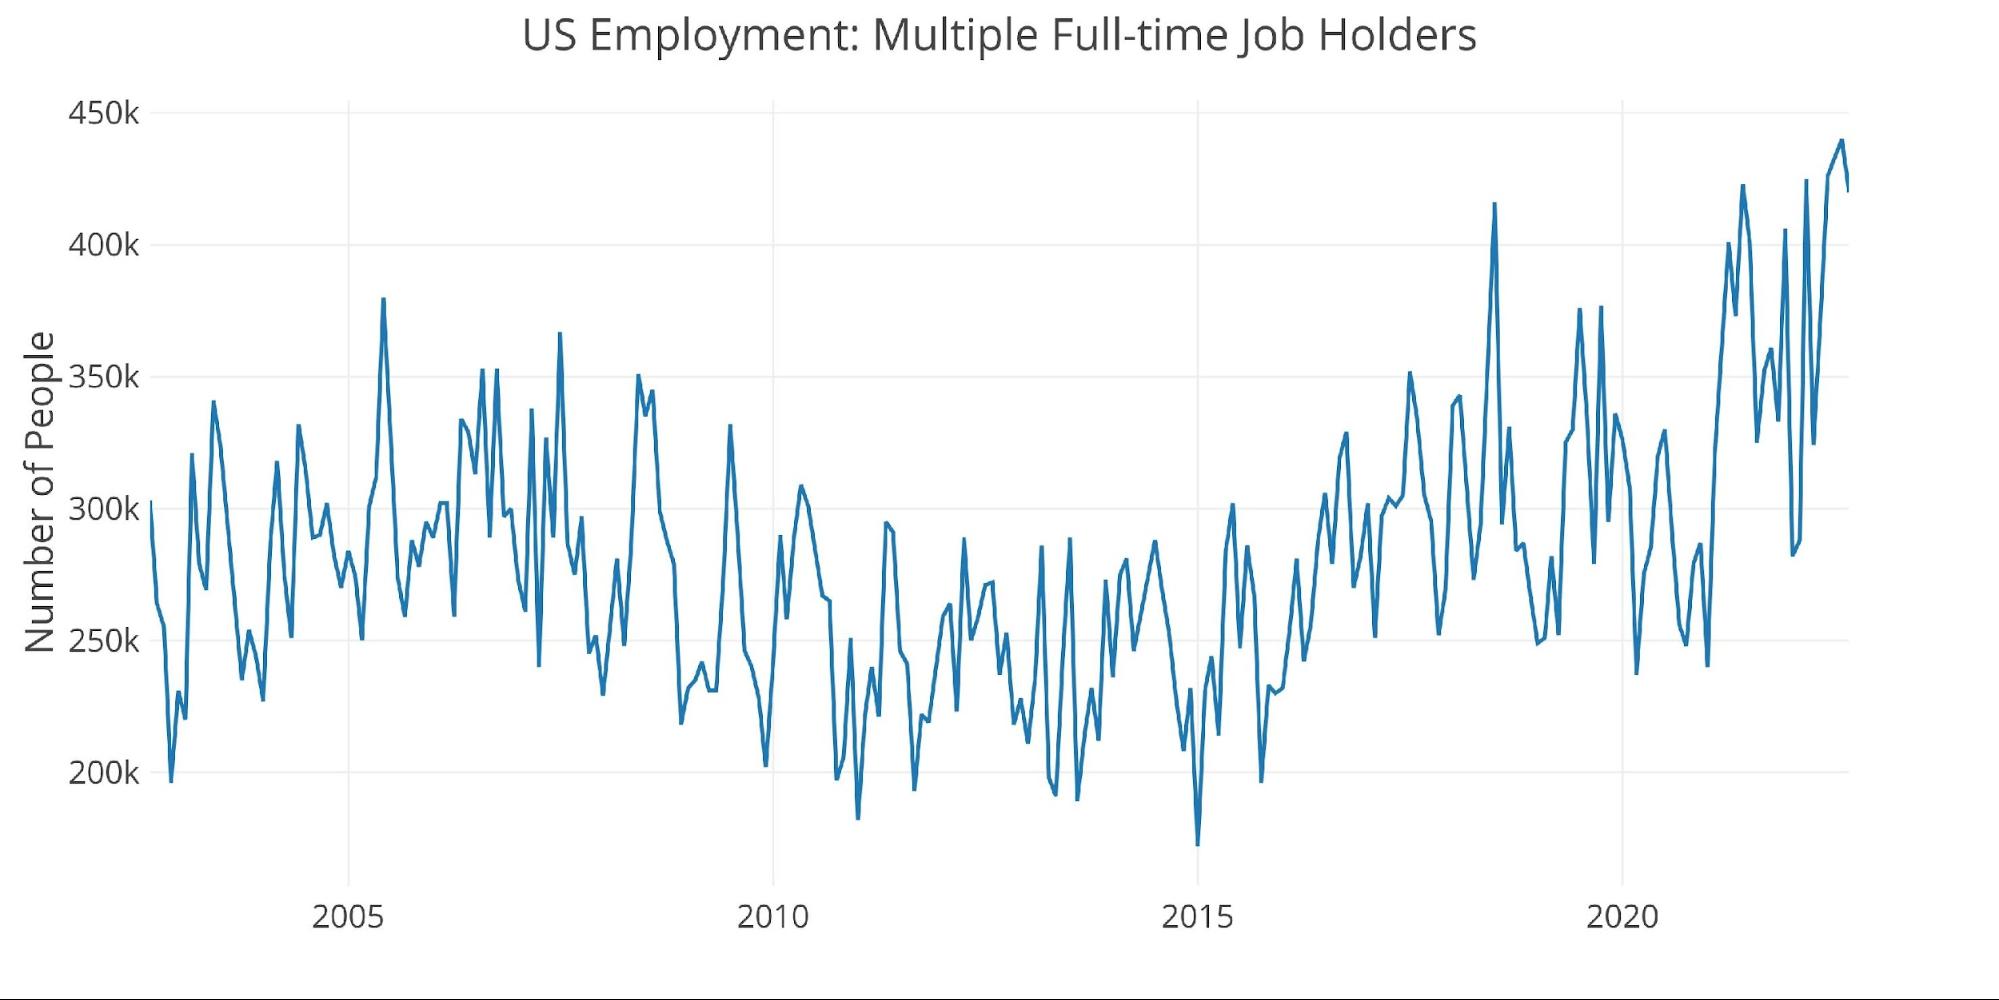
Figure: 3 Multiple Full-Time Employees
Breaking Down the Numbers
The job market is clearly slowing as illustrated by the chart below. 7 of 8 categories are below the 12-month average with Education and Health being the lone exception. Even with the big surge in Leisure Hospitality, it is below the current average trend.
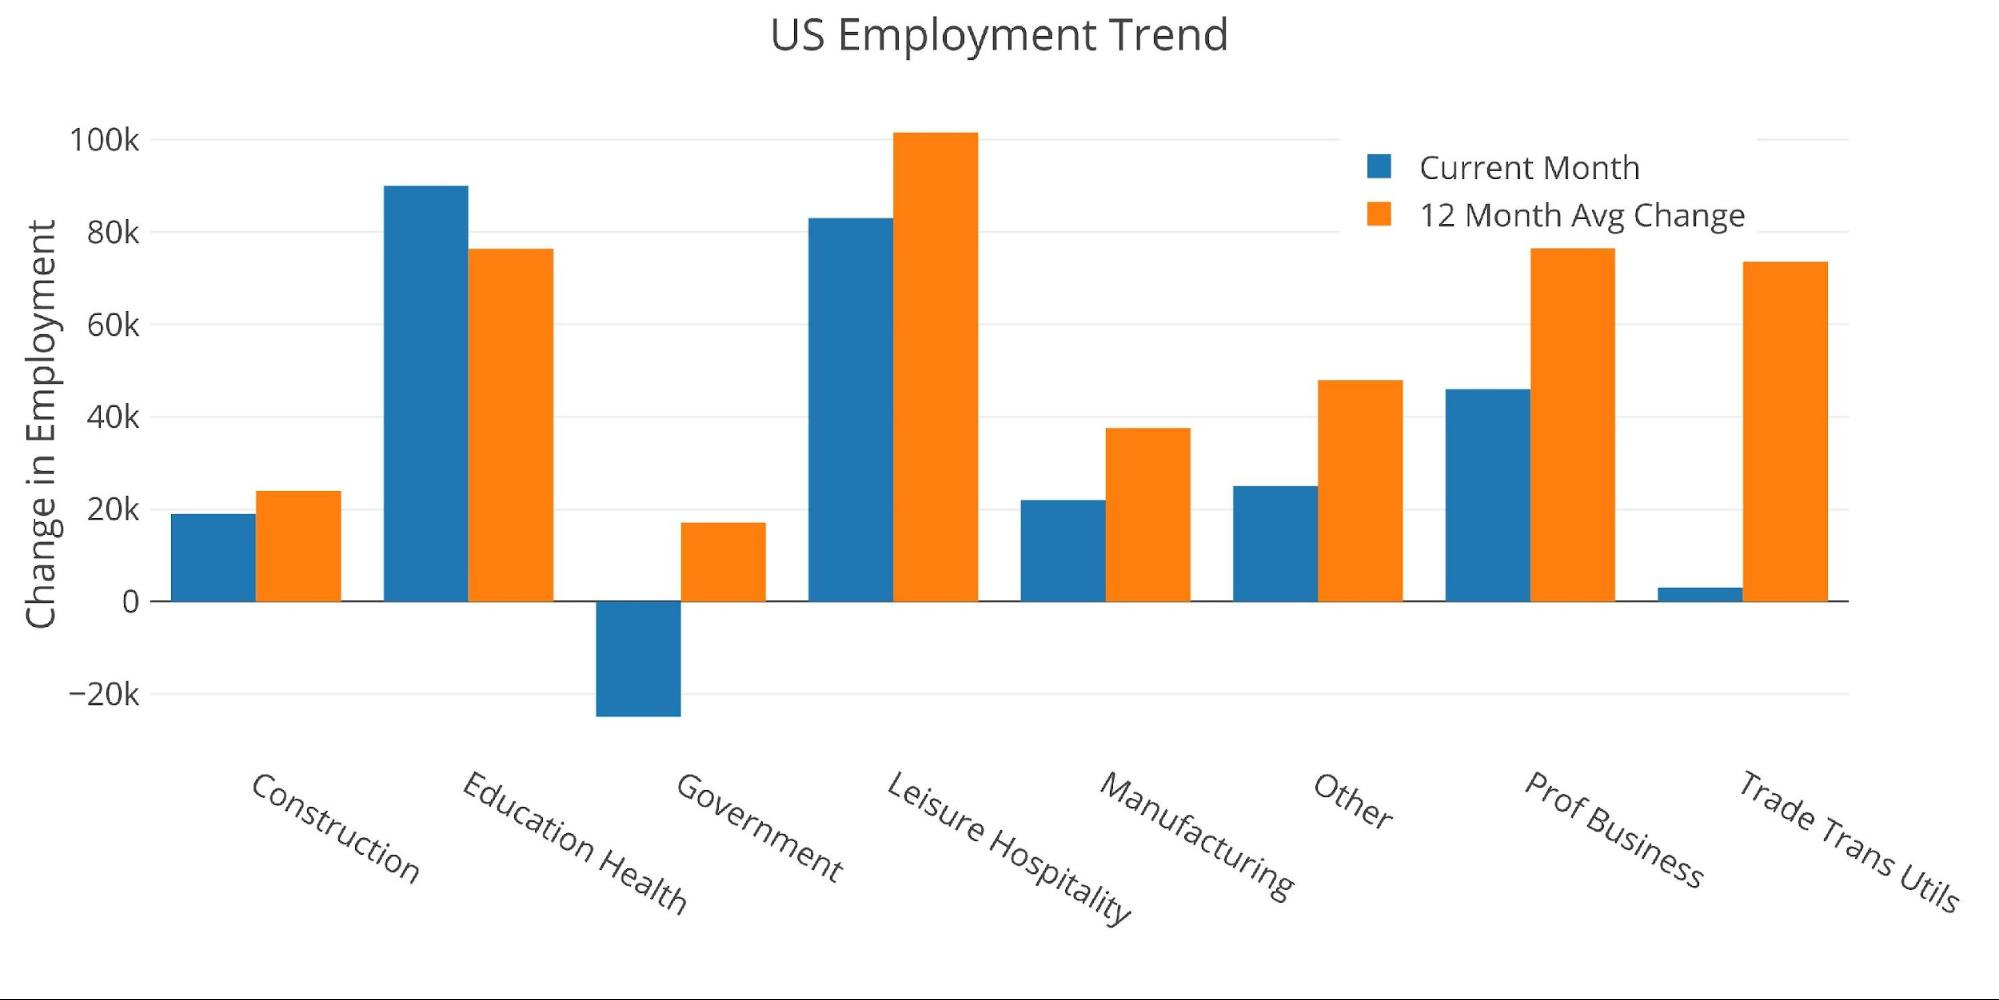
Figure: 4 Current vs TTM
The table below shows a detailed breakdown of the numbers. The aggregate 12-month average is 474k, which is well above the most recent month of 263k.
Key takeaways:
-
- Several categories were able to rise above the three-month average such as Construction, Information, Hospitality, and Other Services
- On the flip side, Education was actually below the three-month average along with Financial, Professional Business, and Trade/Transport/Utilities
- All three government categories were below the three-month average
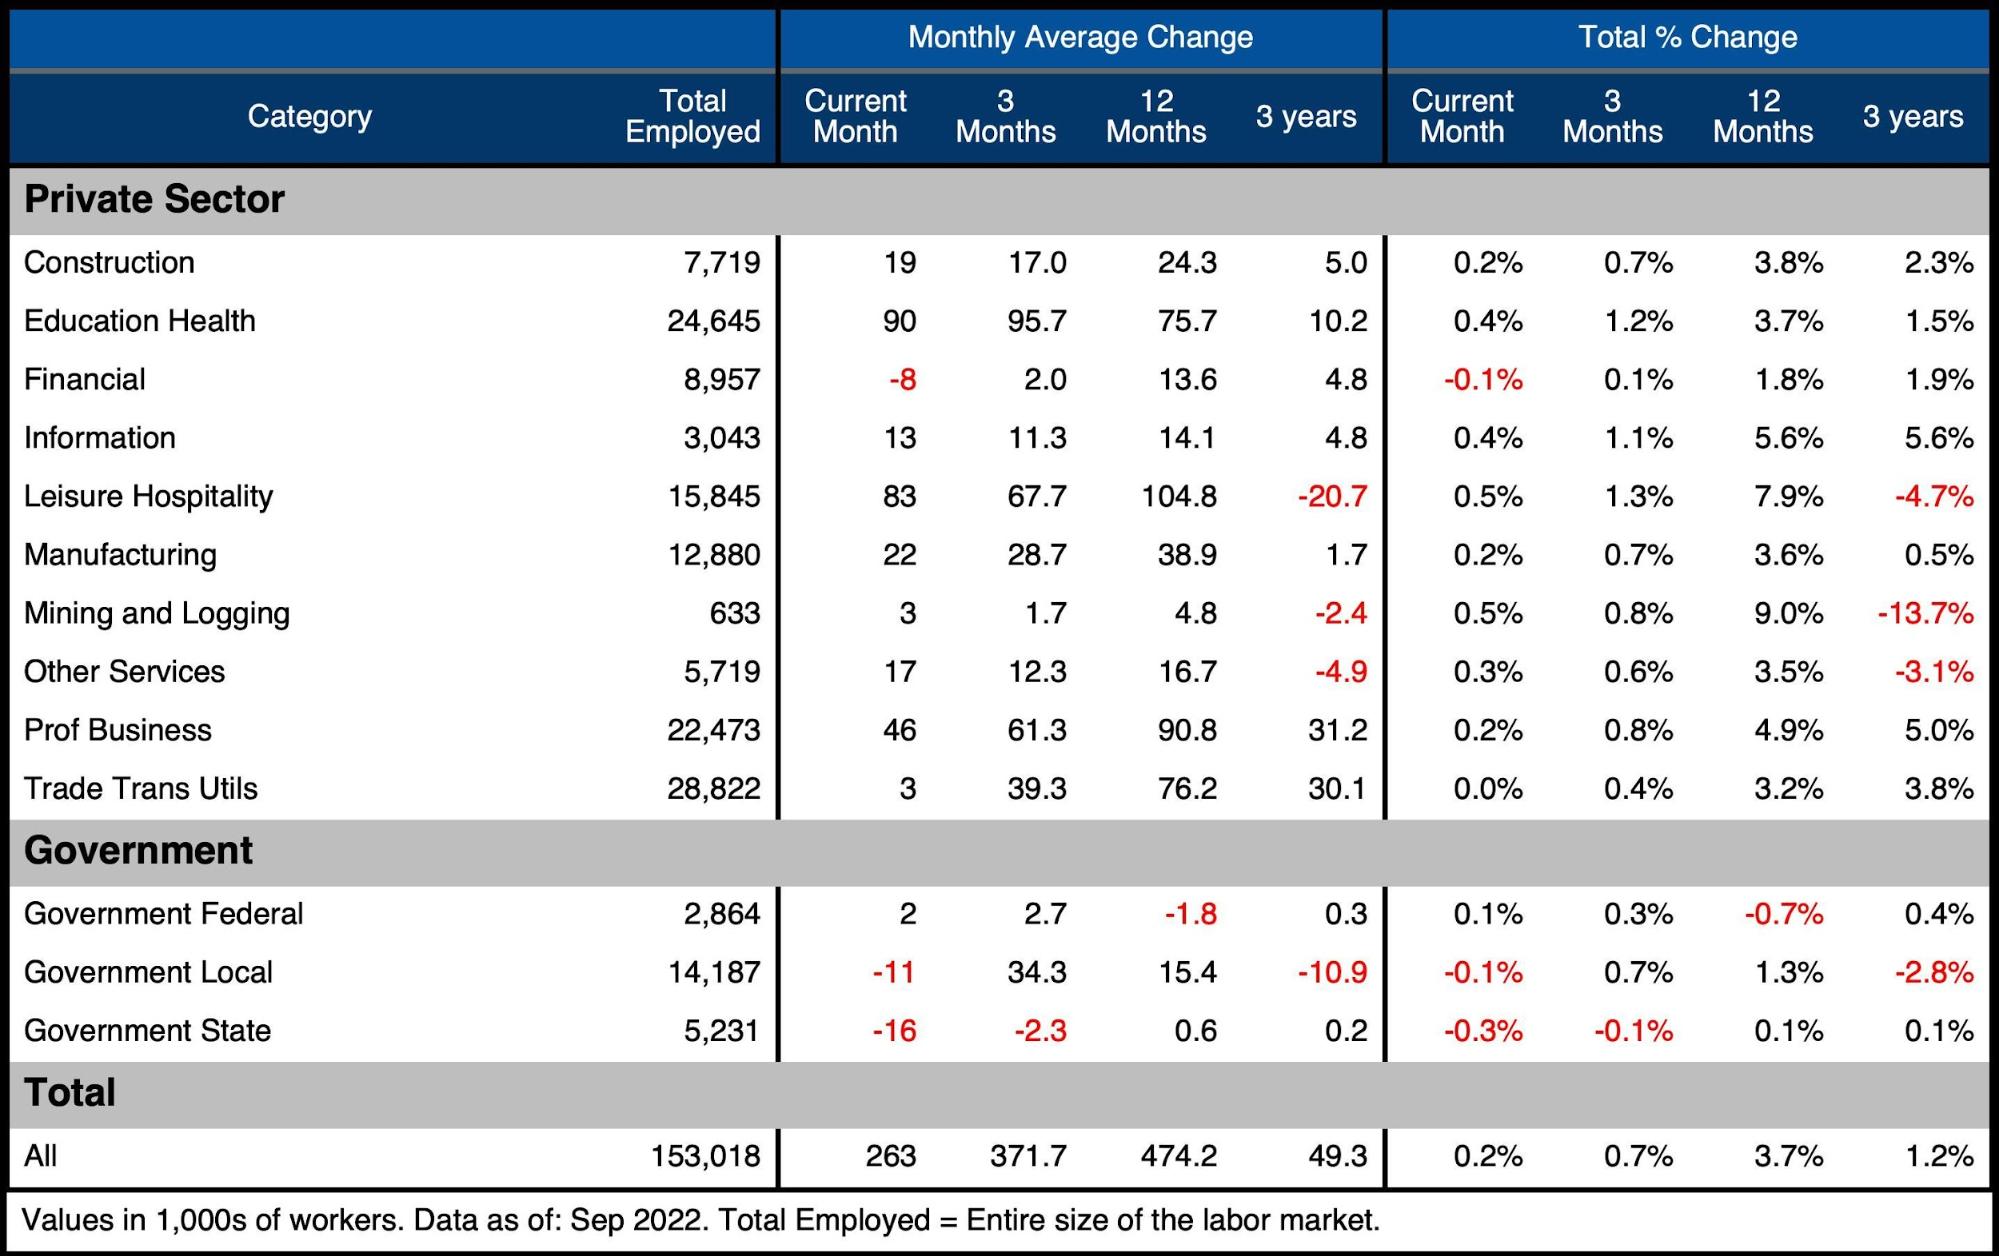
Figure: 5 Labor Market Detail
Revisions
While the headline number gets all the attention, the number is typically revised several times. Revisions over the last three months were net negative again for the fourth month in a row. This is a big change from a few months ago. The 12-month average revision is +92k vs a 3-month average revision of -23.3k.
This means the more recent job numbers are weaker than the initial headline announcement. The job market is weaker than BLS’ initial estimates!
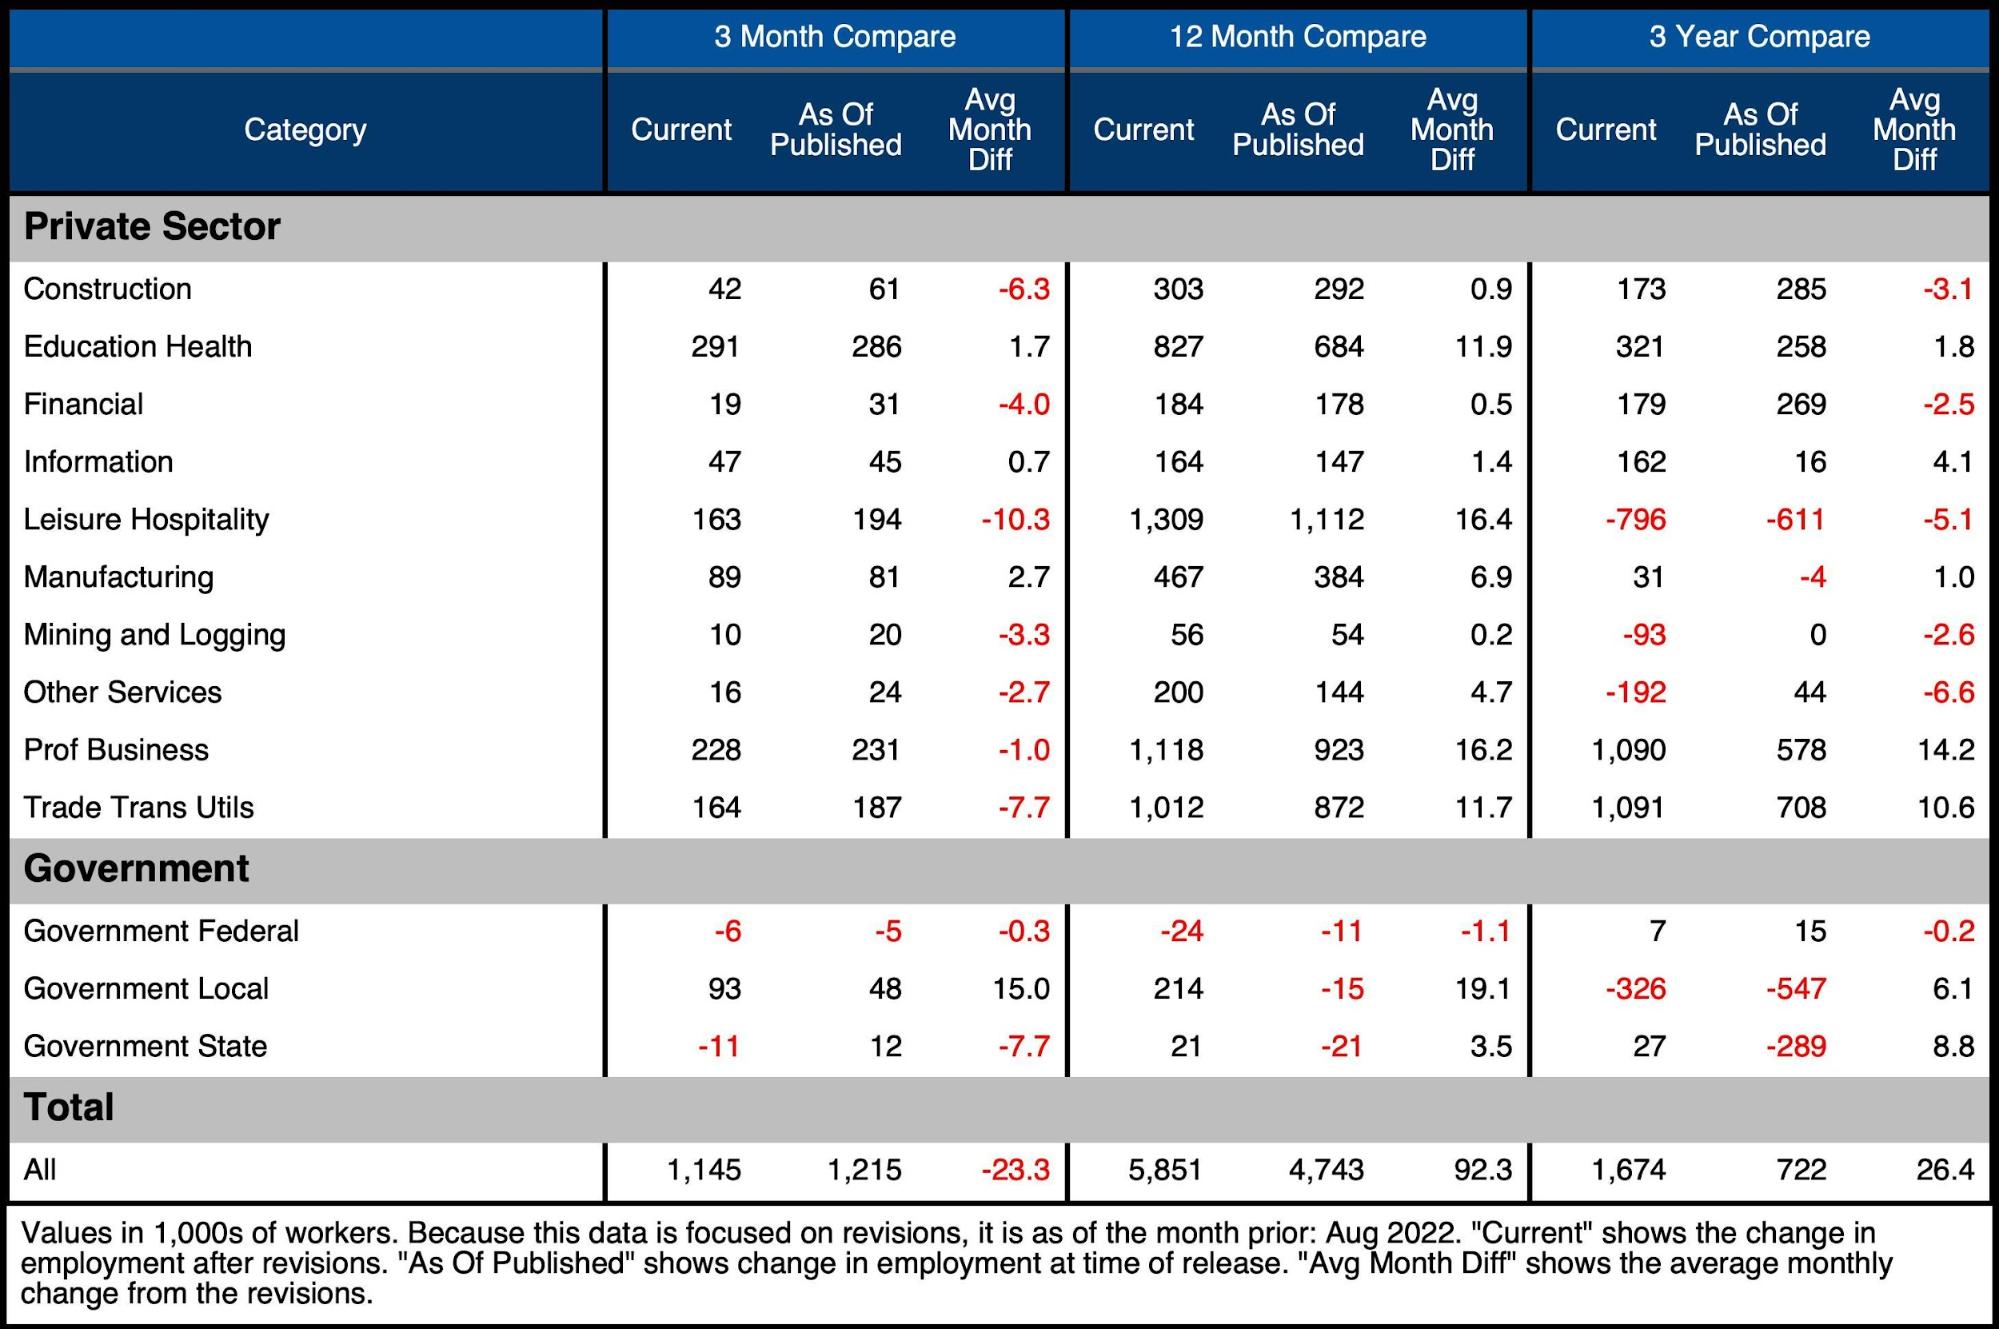
Figure: 6 Revisions
Historical Perspective
The chart below shows data going back to 1955. The Covid recession can be seen as the greatest job market loss ever.
The current unemployment rate ticked back down to 3.5% after briefly going up to 3.7% last month.
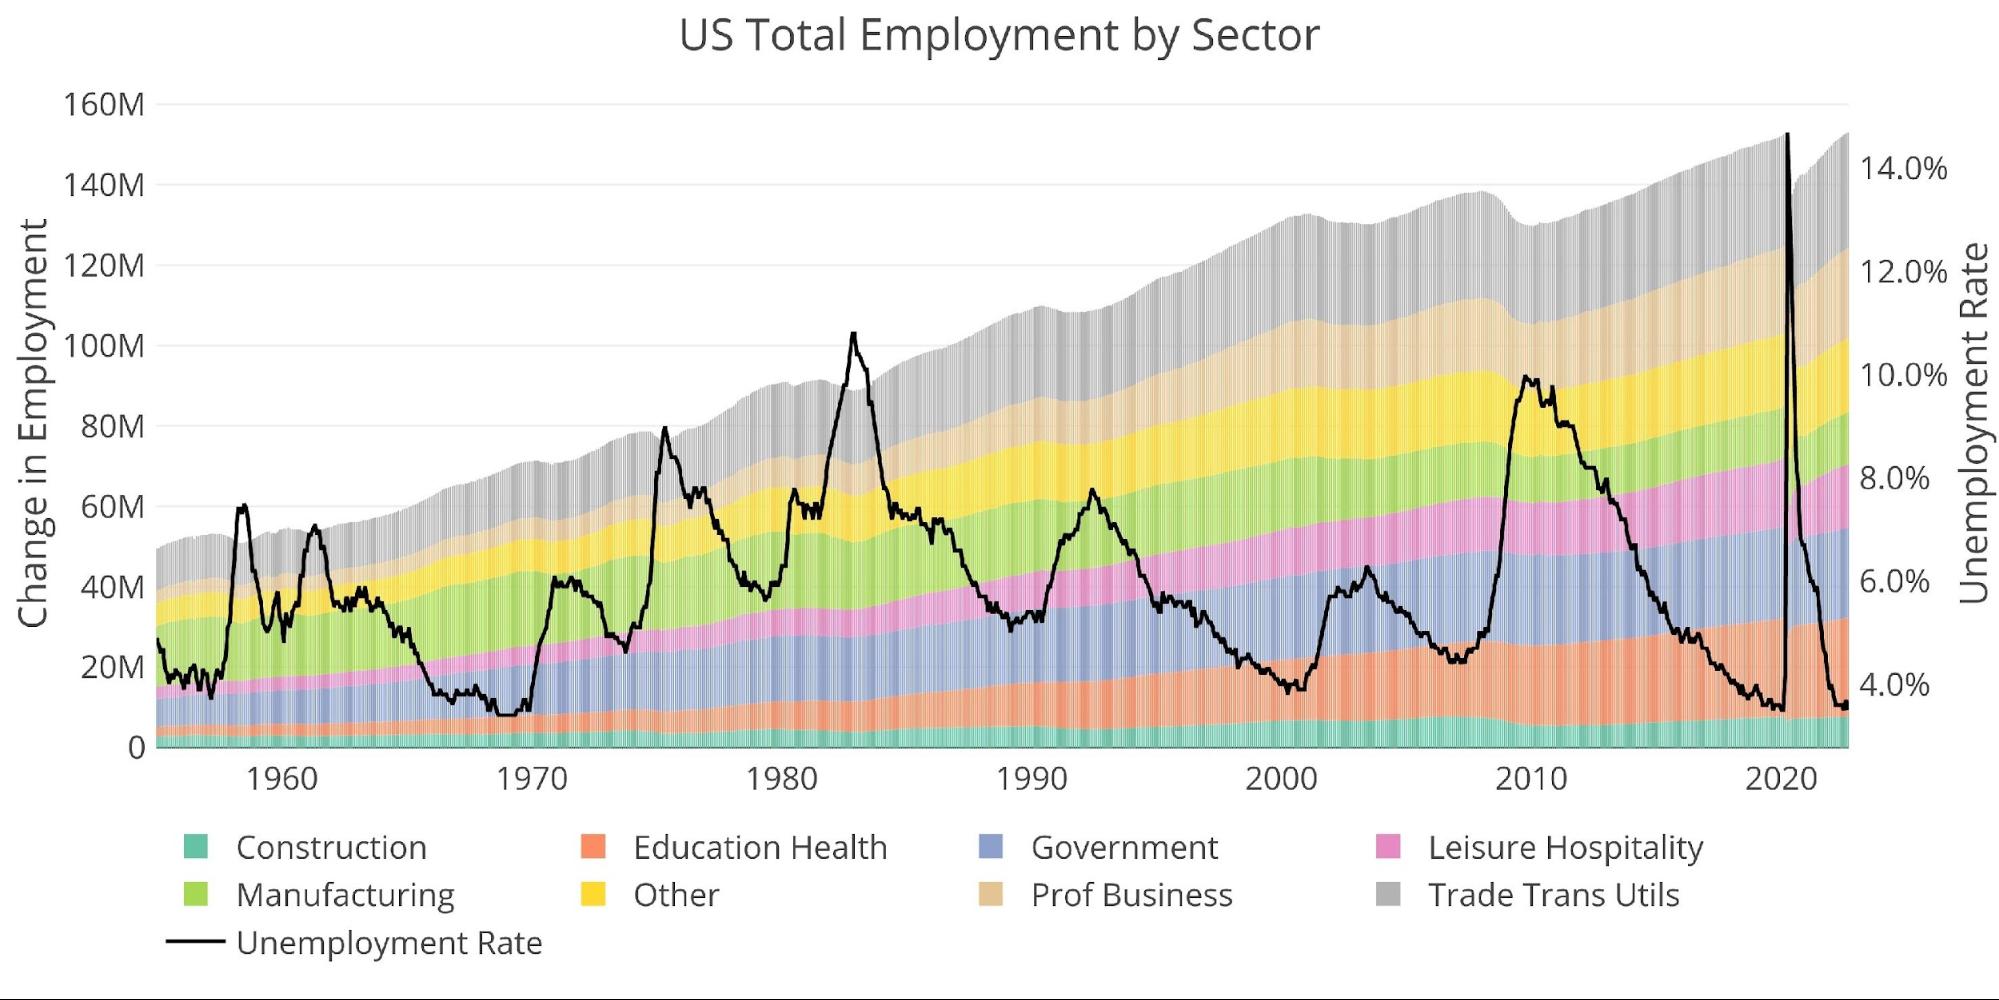
Figure: 7 Historical Labor Market
The labor force participation decreased this month, falling from 62.4% to 62.3%. It still sits a full percentage point below the pre-Covid levels of 63.4% and well below the 66% pre-Financial Crisis. The drop in labor force participation could be the main reason the unemployment rate fell.
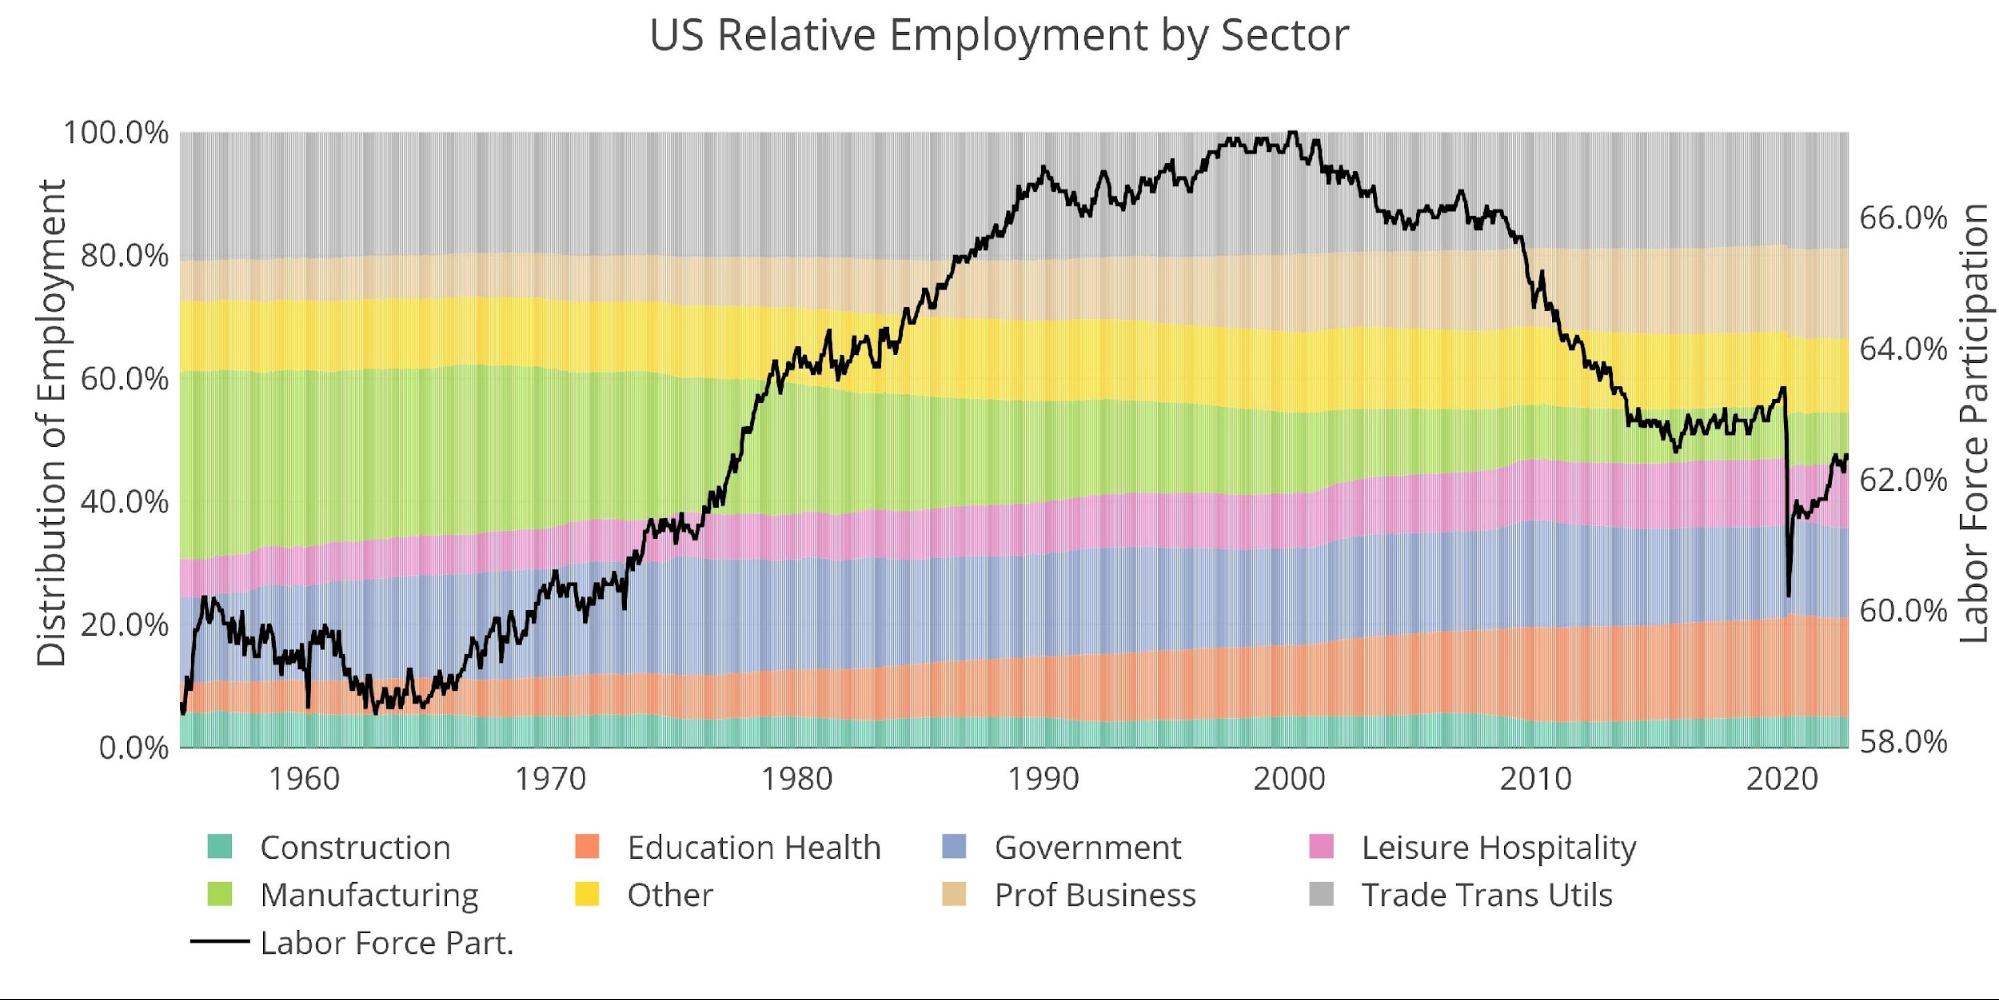
Figure: 8 Labor Market Distribution
What it means for Gold and Silver
The jobs number was neither weak nor strong. It’s unsure if the Fed wants to see a weaker job market so that it has an excuse to slow rate hikes or whether it truly does not care about the economy. The Atlanta Fed has raised its Q3 GDP forecast to 2.7%. A positive GDP print with a modest job market will give the Fed and Biden administration all the ammunition they need to tout a resilient economy.
Unfortunately for the Fed, both time and math are working against them. If they stay on the current path, the Treasury is going to be in a world of pain within 6-12 months. Even if the job market stays modestly strong, the Fed is going to break something else in the economy. They have simply moved too fast to see what is going to break first.
The Fed can keep cruising along, but eventually, they will be forced to pivot. When this happens, gold and silver are going to take-off. The modest jobs figure today caused the market to forecast a pivot later than expected, but in actuality, the pivot will come much sooner. When something breaks, the Fed will come to the rescue.
Data Source: https://fred.stlouisfed.org/series/PAYEMS and also series CIVPART
Data Updated: Monthly on the first Friday of the month
Last Updated: Sep 2022
Interactive charts and graphs can always be found on the Exploring Finance dashboard: https://exploringfinance.shinyapps.io/USDebt/

Call 1-888-GOLD-160 and speak with a Precious Metals Specialist today!
Buka akaun dagangan patuh syariah anda di Weltrade.
Source link