Forecast for XAUUSD 3 oct 2022 for Fundamental Analysis and Technical Analysis

Gold : Fundamental Factors
1) Prices of the yellow metal were steady even as U.S. data on Friday showed inflationary pressures remained elevated and were likely to invite more rate hike pain from the Federal Reserve.But fears that more interest rate hikes could slow economic growth, coupled with a brewing financial crisis in Europe and the UK invited some safe haven buying into gold.
2) Gold has fallen sharply from 2022 highs hit during the onset of the Russia-Ukraine war, as the opportunity cost of holding the metal grew in tandem with rising interest rates across the globe.This trend is widely expected to weigh on bullion prices In the coming months, as several central banks hike rates even further to battle stubborn inflation
3) A survey by the Bank of Japan showed major manufacturers in the country grew less optimistic about their business prospects in the third quarter
, which could signal weakening industrial trends in the world’s third-largest economy.
Gold ; The trend is Bullish ( For Today)
Gold : Fundamental Range : 1630 – 1671

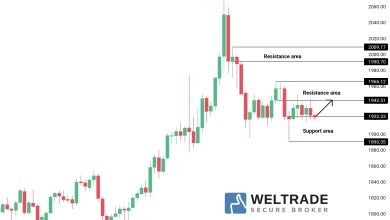
Technical Analysis
Check at Daily Timeframe Support and Resistance for Fibonacci.
Check the timing of trade it might be different for resistance and support at that time.
1) Resistance : 1665.32,1666.49,1668.39
2) Support : 1658.45,1660.35,1661.52
Pivot point : 1663.42
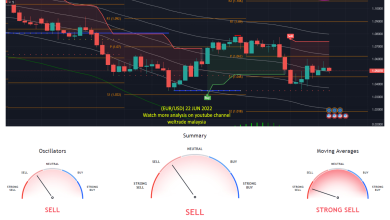
Confirm with technical indicators and based on your own technical analysis.
Check investing.com to get more info on what most indicator would display
Check higher timeframe also for more confirmation for entry in Daily timeframe.
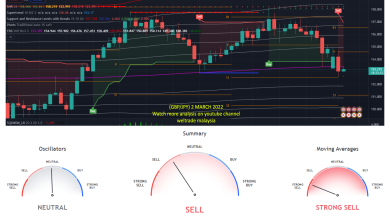
The technical indicator display strong sell at higher timeframe, where we can entry sell for higher timeframe by following the resistance area given and vice versa
If want to go for the lower timeframe ,can see what the timeframe display to see the confirmation of trend and entry
Seek for sell or buy opportunity to enter for confirmation or based on your own technical analysis understanding.
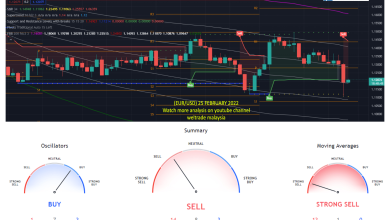
Use linear regression to get confirmation trend at daily as they are not available in investing.com
Linear regression shows a downward trend.
Use Bolinger Band Strategy Tester and RSI Strategy Tester to get more confirmation.
Both strategies show a higher percentage of profit which is higher than 50%
Trend is Bearish
Gold: Find Sell at the daily chart.
For further information, contact me ,Gurmit at +60142584067,I will guide anyone that would like to register with Weltrade. Can register at the below link. Thank you.
https://my.weltrade.com/?r1=ipartner&r2=49989
Disclaimer : This analysis is based on Investing.com and Forexfactory.com. You may follow based on your own discreetion.
Can join at our telegram group at https://t.me/weltrade_my
For traders who want to trade on their own can join Weltrade, we provide benefits for traders out there, learn to trade and follow free signals such as free paid signal providers, bookmap gold and tradingview premium live.
Free Bookmap Education t.me/+JetSe33YA0U2ZDk1
Join us at our zoom for online learning from 10.30am to 11.30am by the Financial Markets Research Center (FMRC) team. With Cikgu Hafiz and Cikgu Gurmit
Link: https://us06web.zoom.us/j/81843968428?pwd=VkZ3L2UrcXh2WlZsZHU3ZFFGUmJMQT09
Komen anda
Source link