
The June trade deficit fell for a fourth straight month to -$79.6B. While the deficit continues to drop from all-time highs, it is still larger than any single month before 2022. June eclipsed December 2021 by $750M. December was a new record at the time, so the current deficit should be put into context of a longer history despite coming off recent highs.
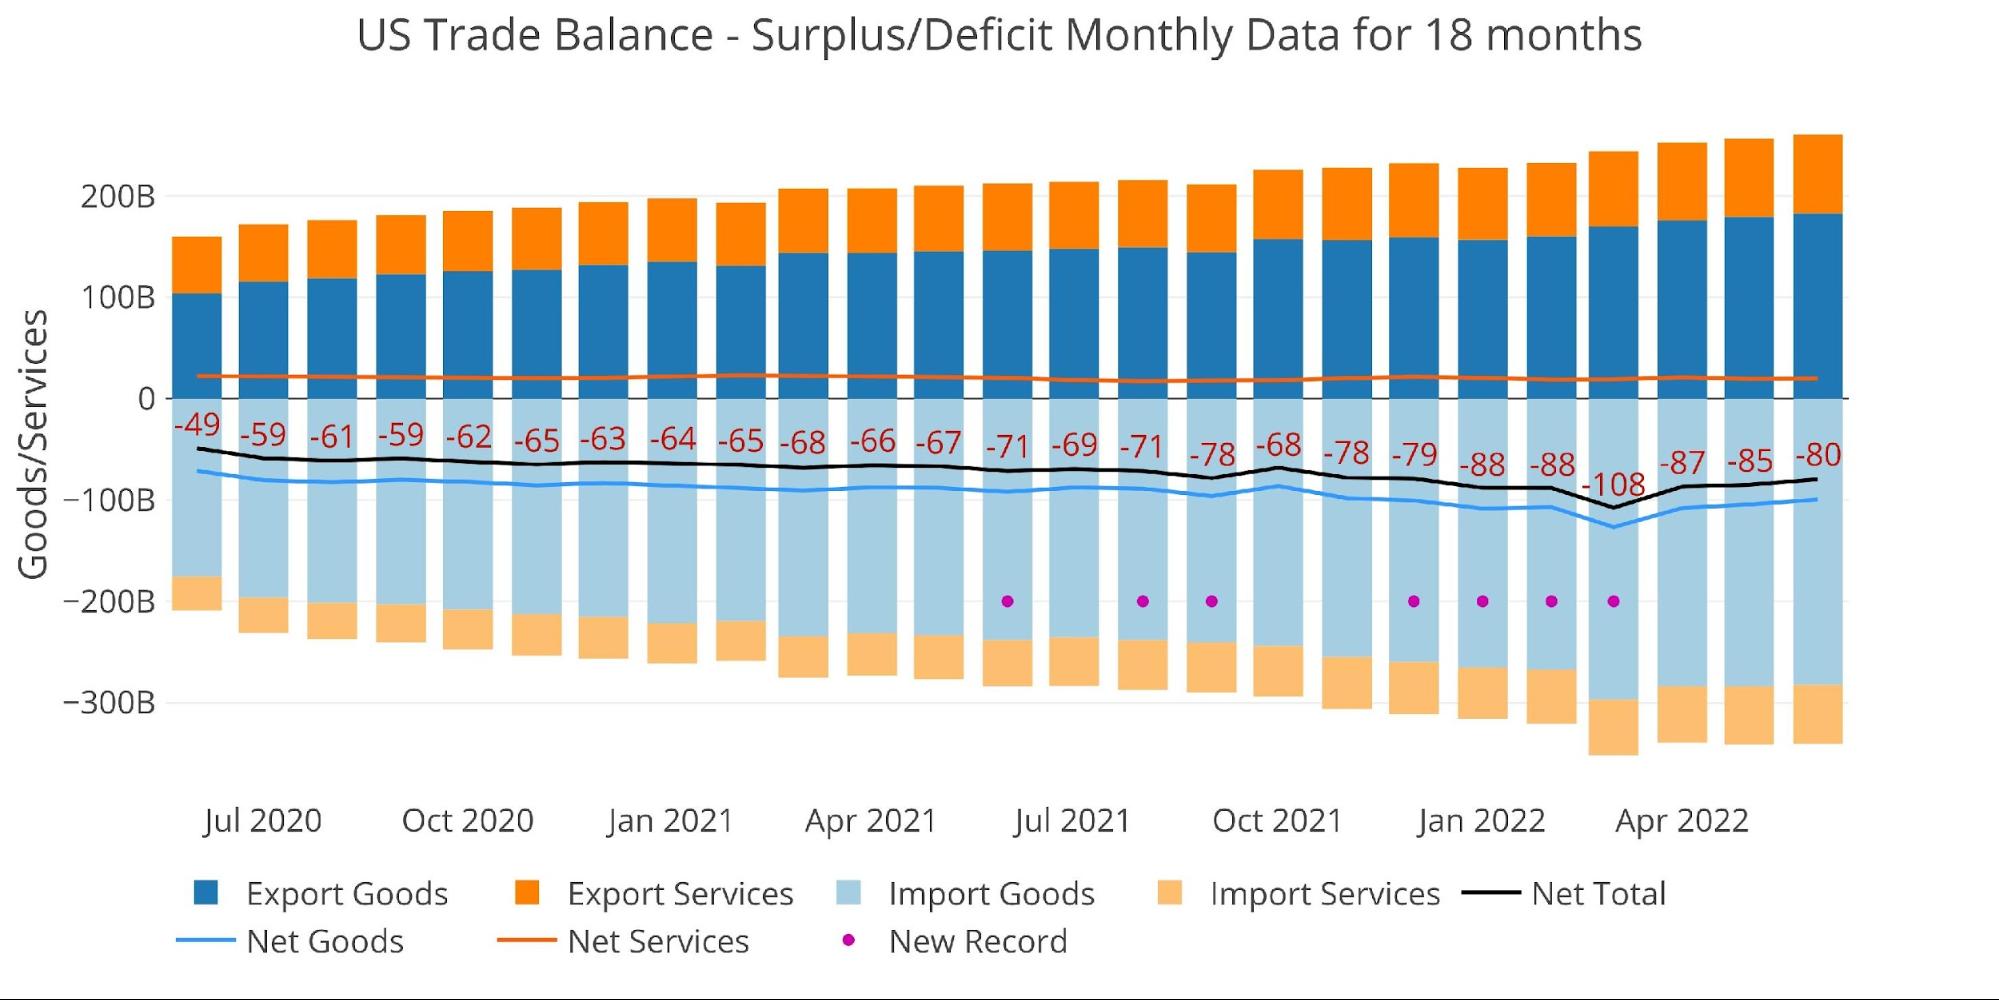
Figure: 1 Monthly Plot Detail
The table below provides detail.
Monthly Trade Deficit
-
- Exports grew in both Goods (+2%) and Services (+1%)
- Imported Goods fell by -0.5% while Imported Services increased +0.7%
- On a Net basis, both categories pushed the deficit smaller
-
- The Goods Net Deficit fell -4.7% while the Services Surplus expanded +1.8%
-
- YoY, the Net Deficit is still greater than last June by 11.6% or $8.2B
Looking at Trailing Twelve Month:
-
- The Total Net Deficit reached a new record of $979B
-
- YoY, the Net Deficit is up 27.2%
- Compared to June 2020, the TTM Deficit is up 77.6%
-
- The TTM Services Surplus continues to shrink and is down almost 10% YoY and almost 20% since June 2020
- The Total Net Deficit reached a new record of $979B
The fall in Imported Goods is very noteworthy. It further evidences that the US economy is weakening.
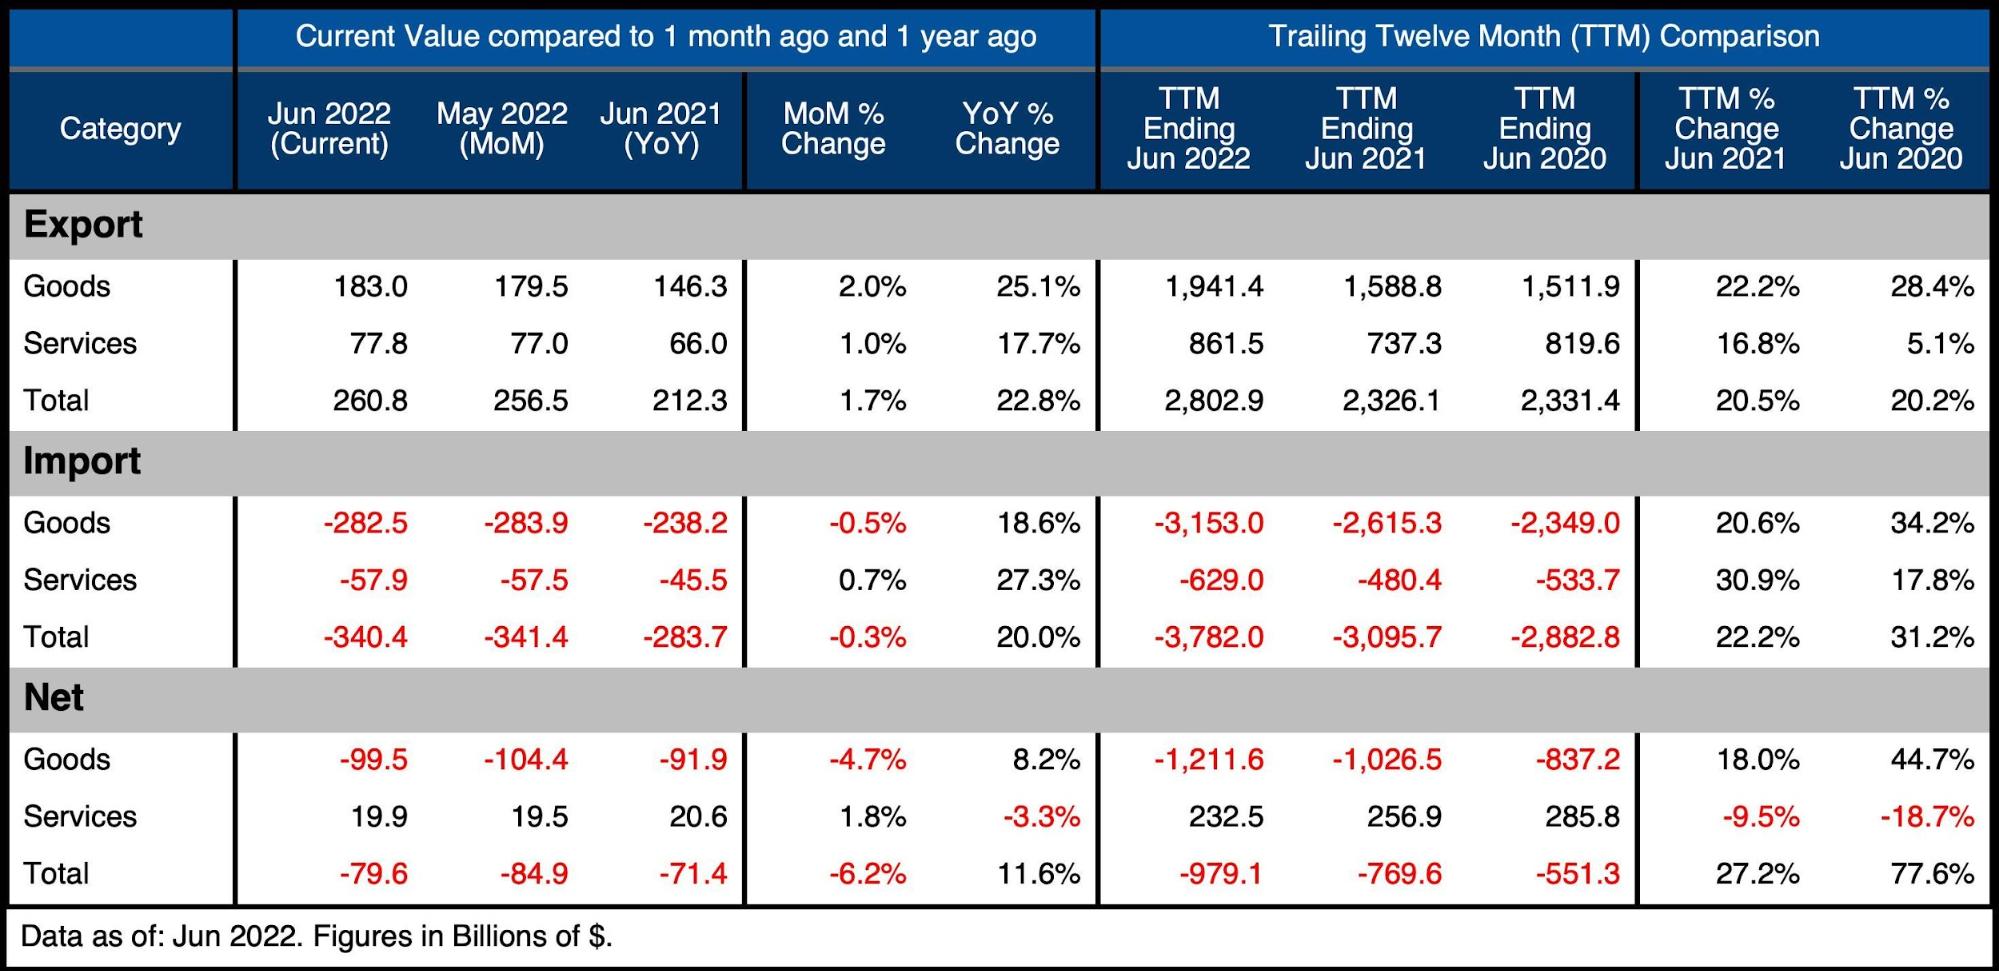
Figure: 2 Trade Balance Detail
Historical Perspective
Zooming out and focusing on the net numbers shows the longer-term trend. The massive deficit spike in March has fully reversed, but the medium trend is still sloping sharply downward. That being said, it’s possible the deficit could be poised to shrink in the months ahead.
The Great Financial Crisis can be clearly seen in the middle of the chart showing a sharp decline in the Goods and Net Deficit (shown by an upward move in the blue and black lines). As the economy collapsed in 2008, the TTM Imported Goods fell from $2.2T in Oct 2008 to $1.57T in Dec 2009 (a decline of almost 30%).
The current drop in Imported Goods may be resulting from a combination of factors related to the weak economy. Higher inflation taking a bite out of disposal income, along with a recession generally bringing demand for imports lower. If the deficit continues to shrink, it will be further evidence of a recession that the government is trying to ignore.
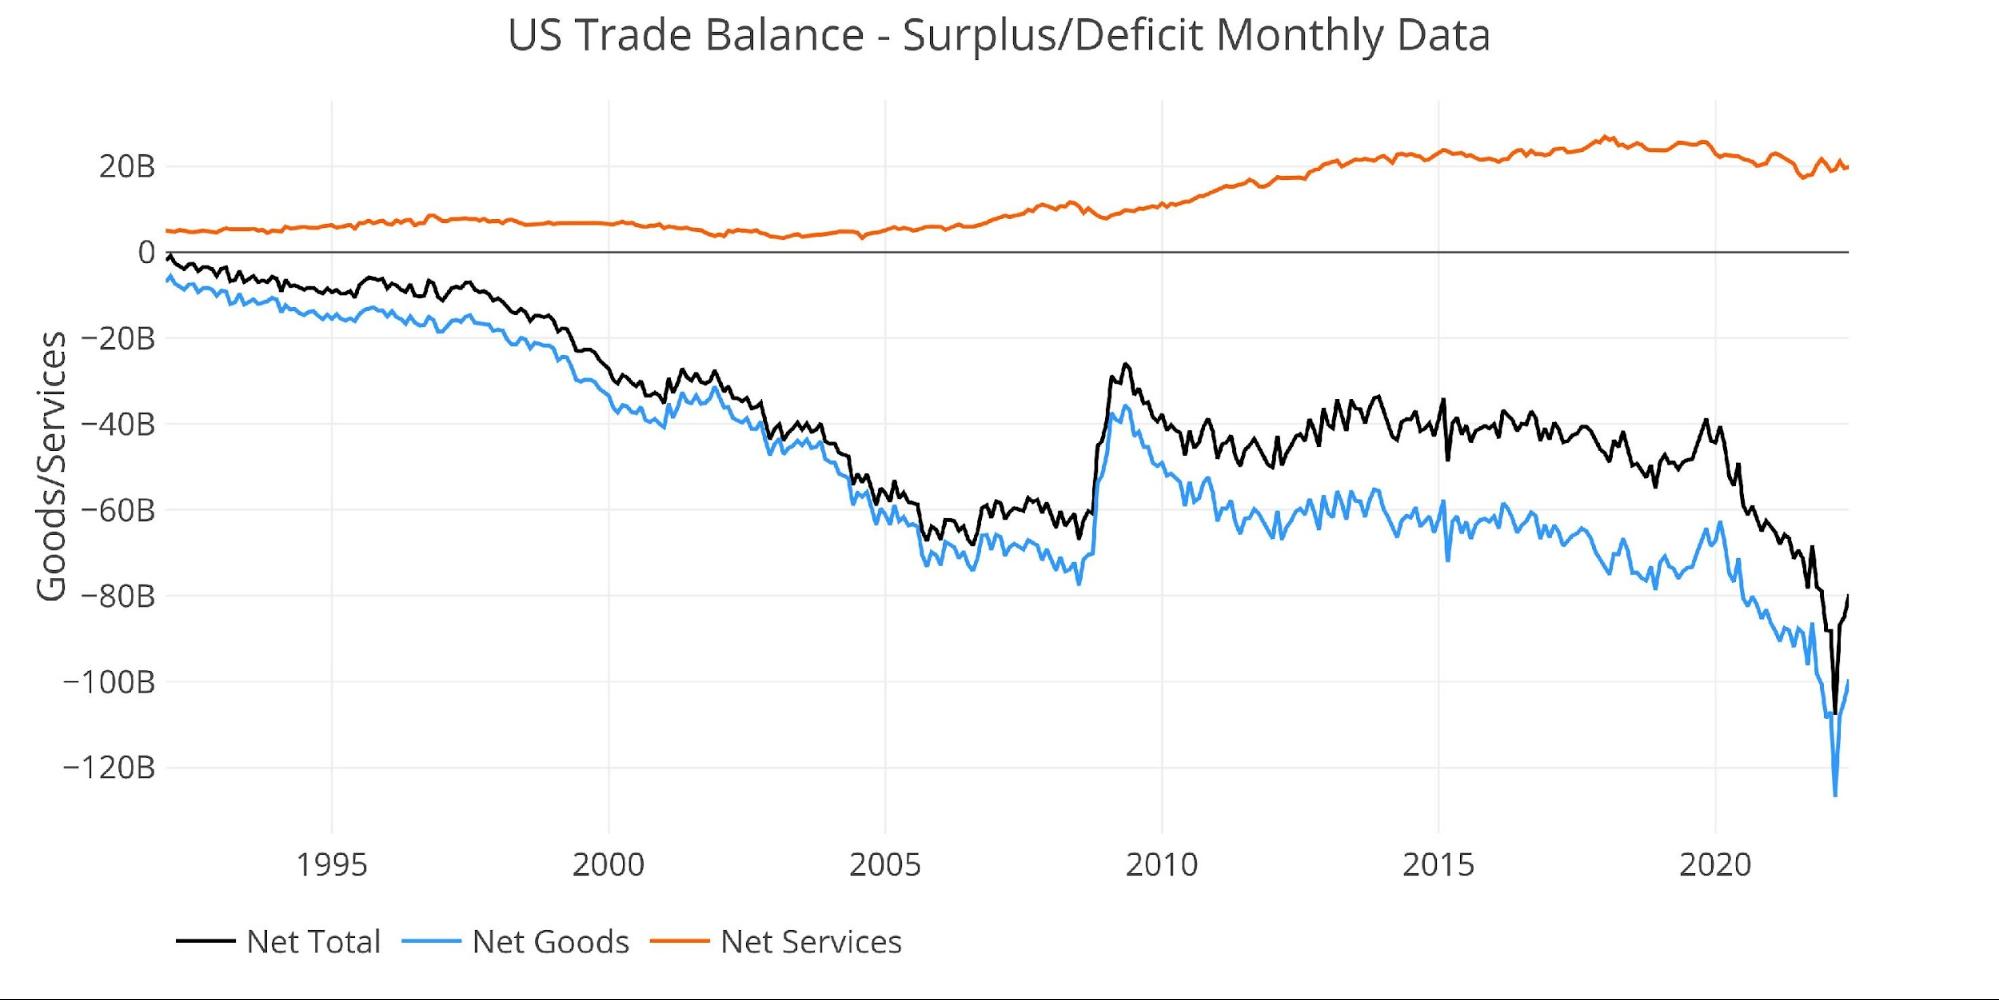
Figure: 3 Historical Net Trade Balance
The chart below zooms in on the Services Surplus to show the wild ride it has been on in recent months. It compares Net Services to Total Exported Services to show relative size. After hovering near 35% since 2013, it dropped to 26% in Aug 2021, recovered to 28.8%, but has fallen back down to 25.6%. If the Services Surplus continues to shrink, this tailwind will become a headwind.
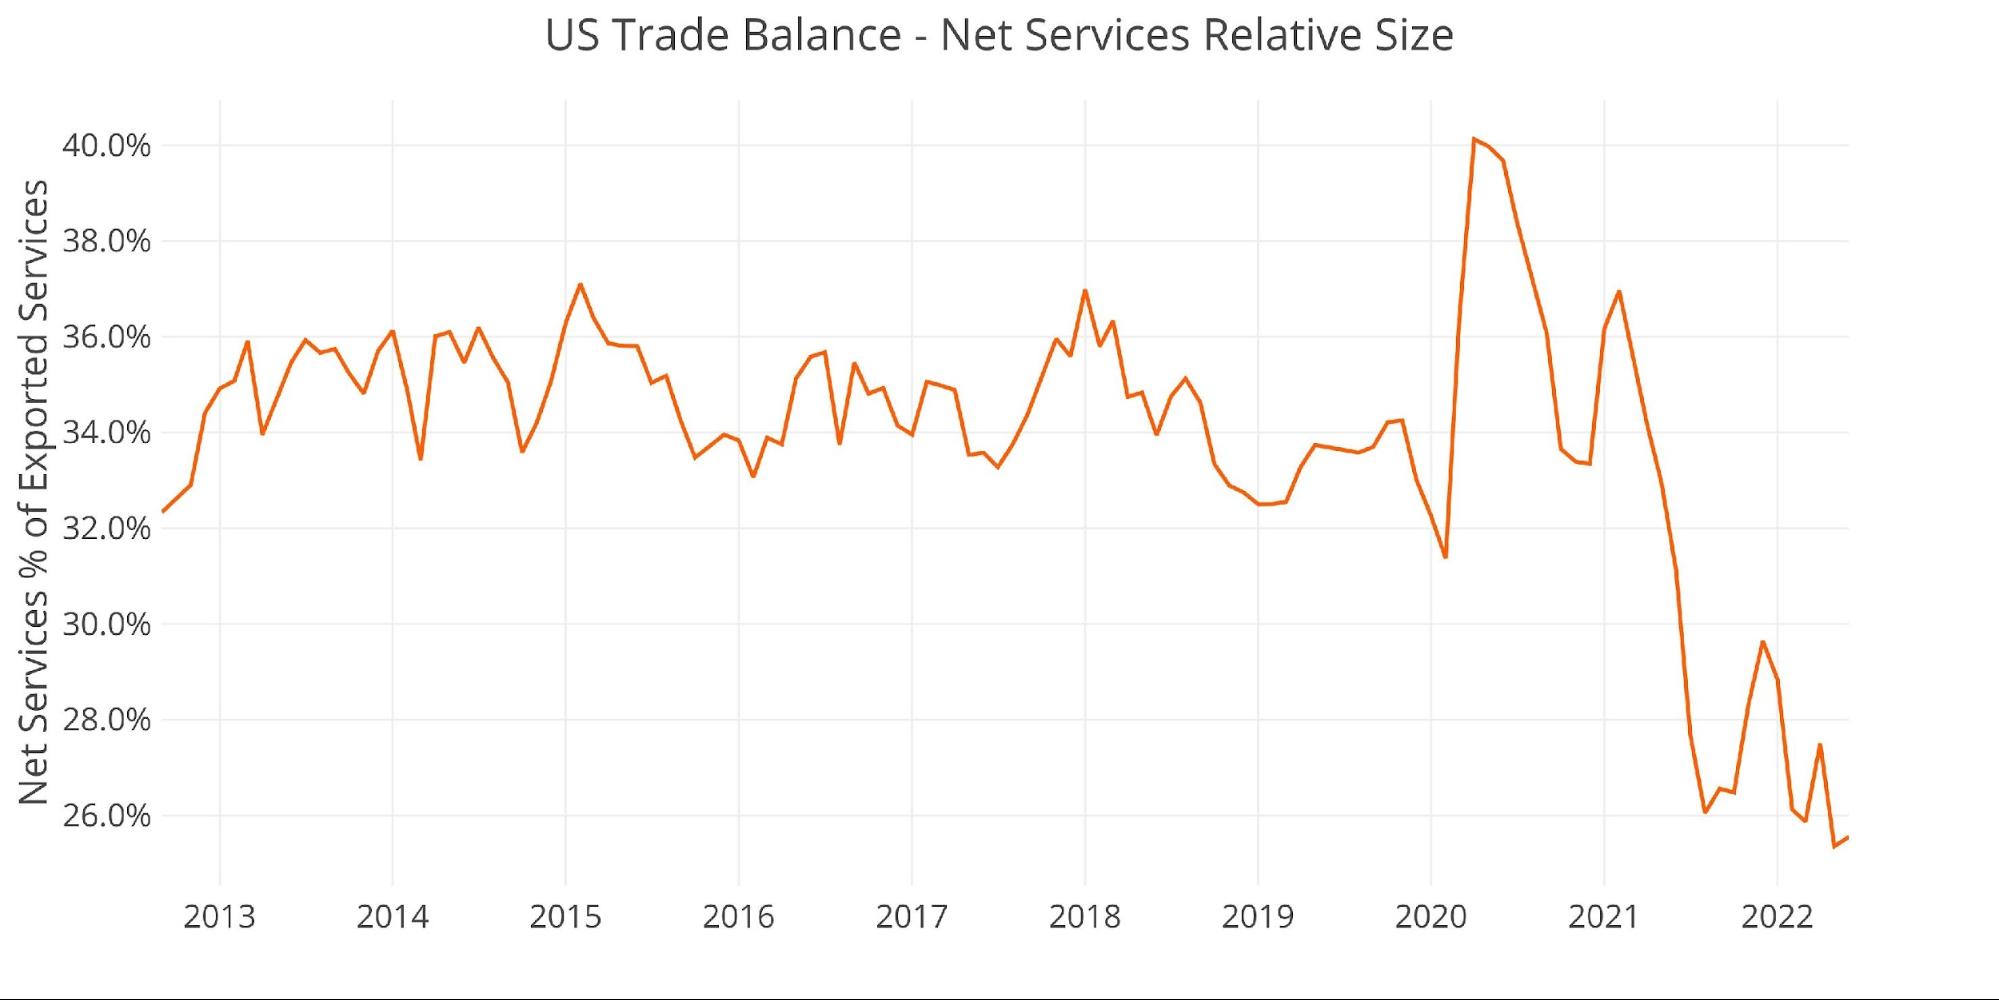
Figure: 4 Historical Services Surplus
To put it all together and remove some of the noise, the next plot below shows the Trailing Twelve Month (TTM) values for each month (i.e., each period represents the summation of the previous 12-months).
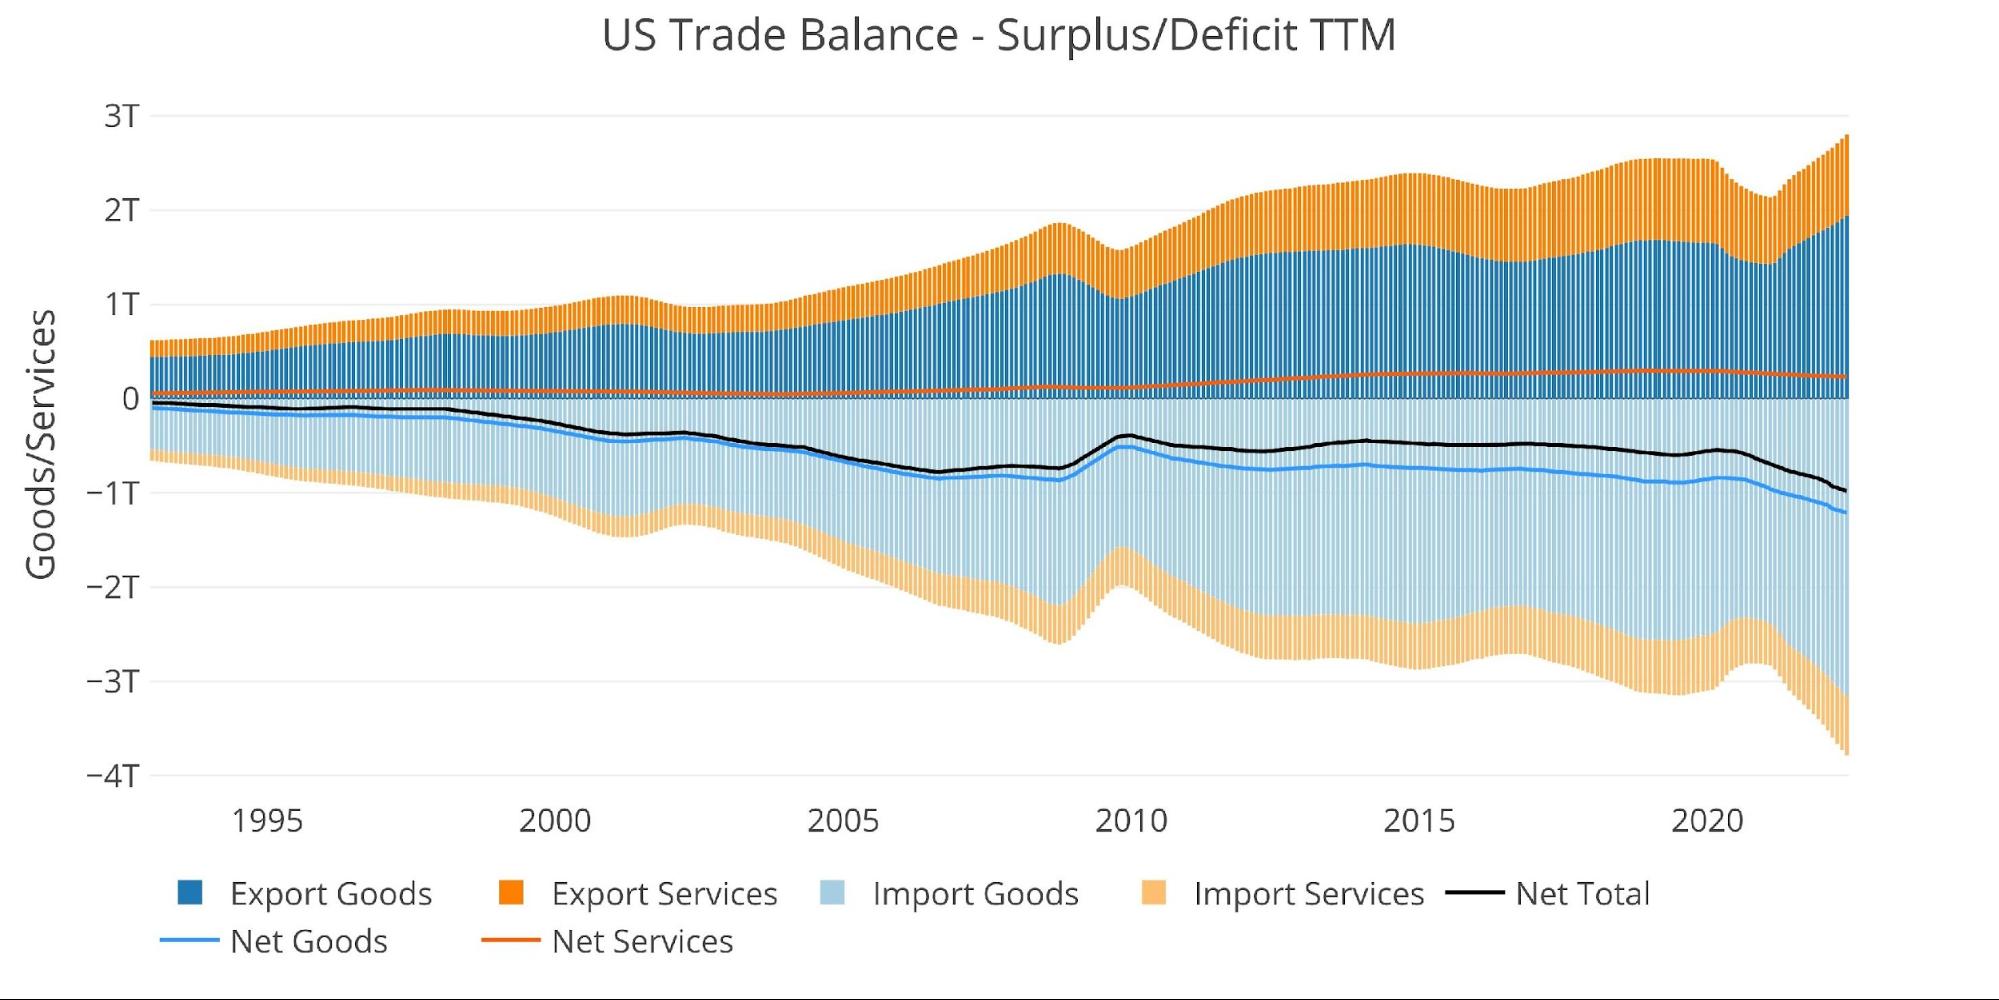
Figure: 5 Trailing 12 Months (TTM)
Although the TTM Net Trade Deficits continue to hit all-time records in dollar terms, it can be put in perspective by comparing the value to US GDP. As the chart below shows, the current records are still below the 2006 highs before the Great Financial Crisis.
That being said, the current 3.94% is the highest since April of 2009 and up from 2.53% in March 2020.
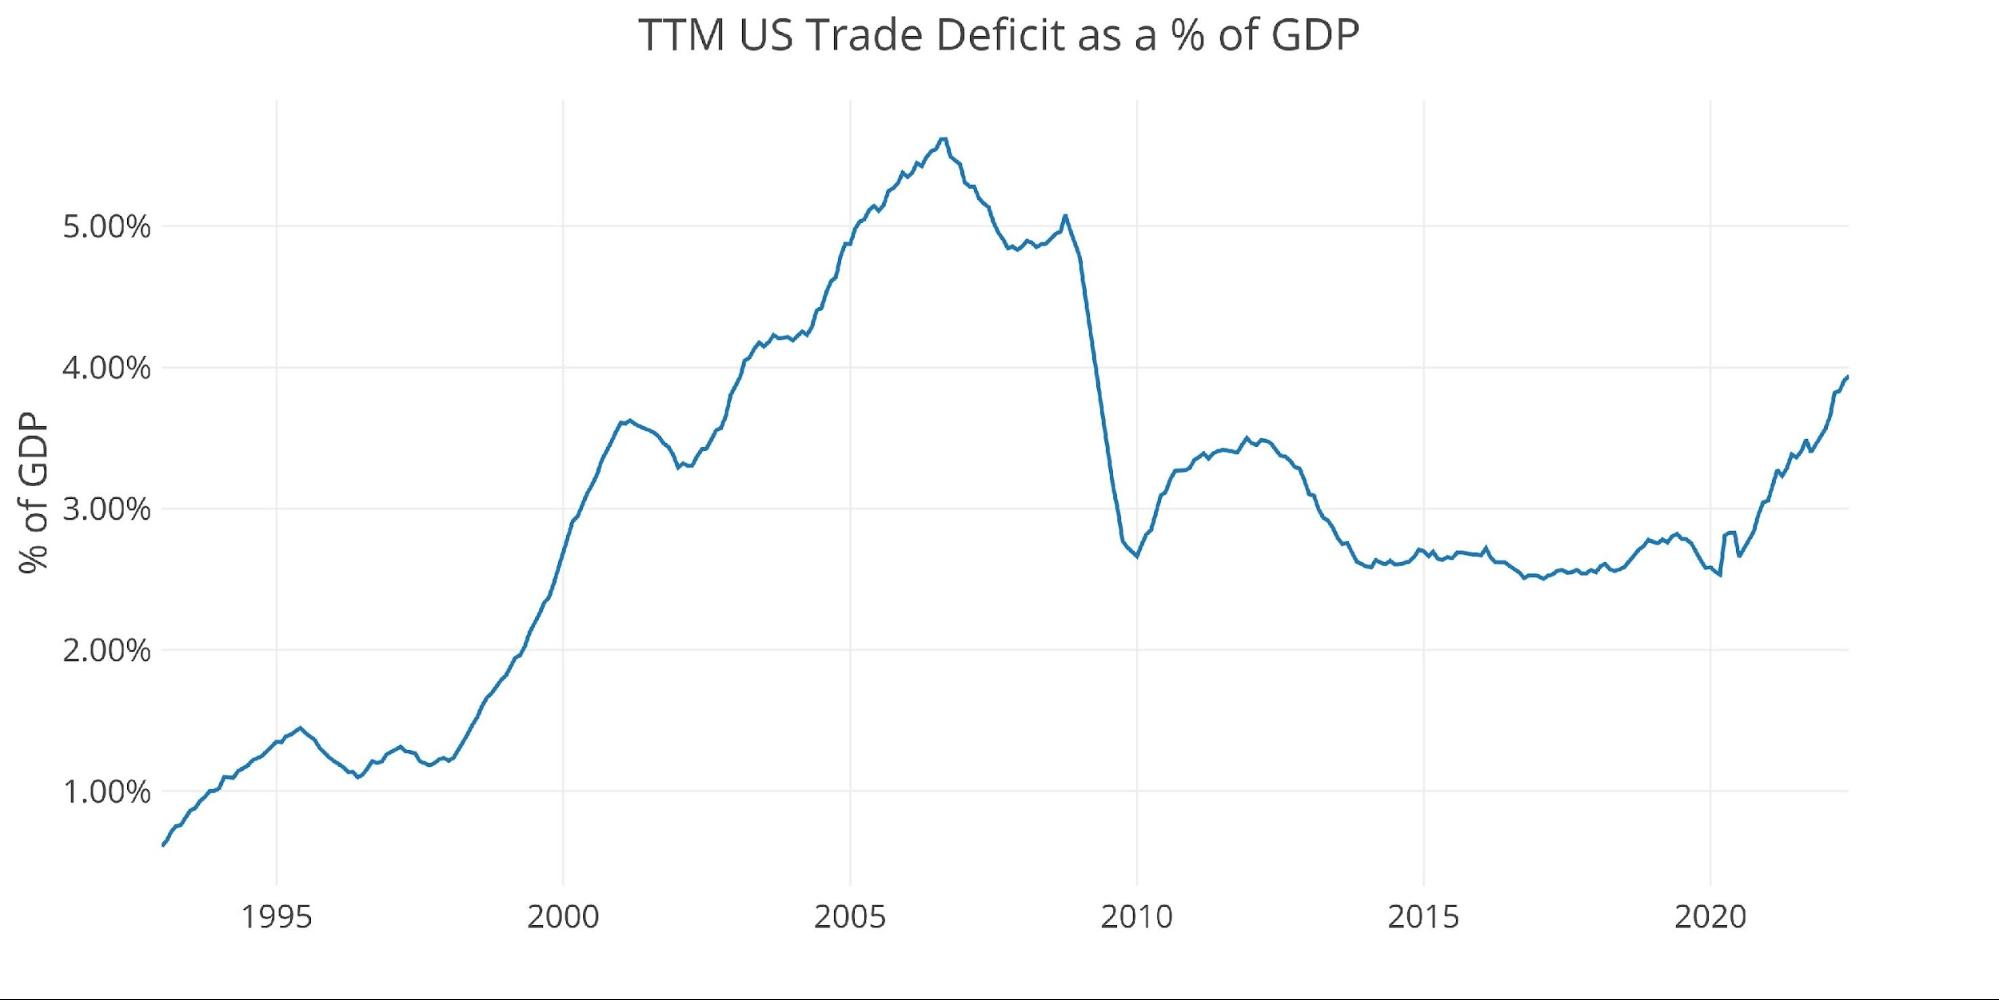
Figure: 6 TTM vs GDP
The chart below shows the YTD values. 2022 is well above prior years by a significant margin. Total 2022 Imported Goods is already larger than the combined Imported Services and Imported Goods from 2021.
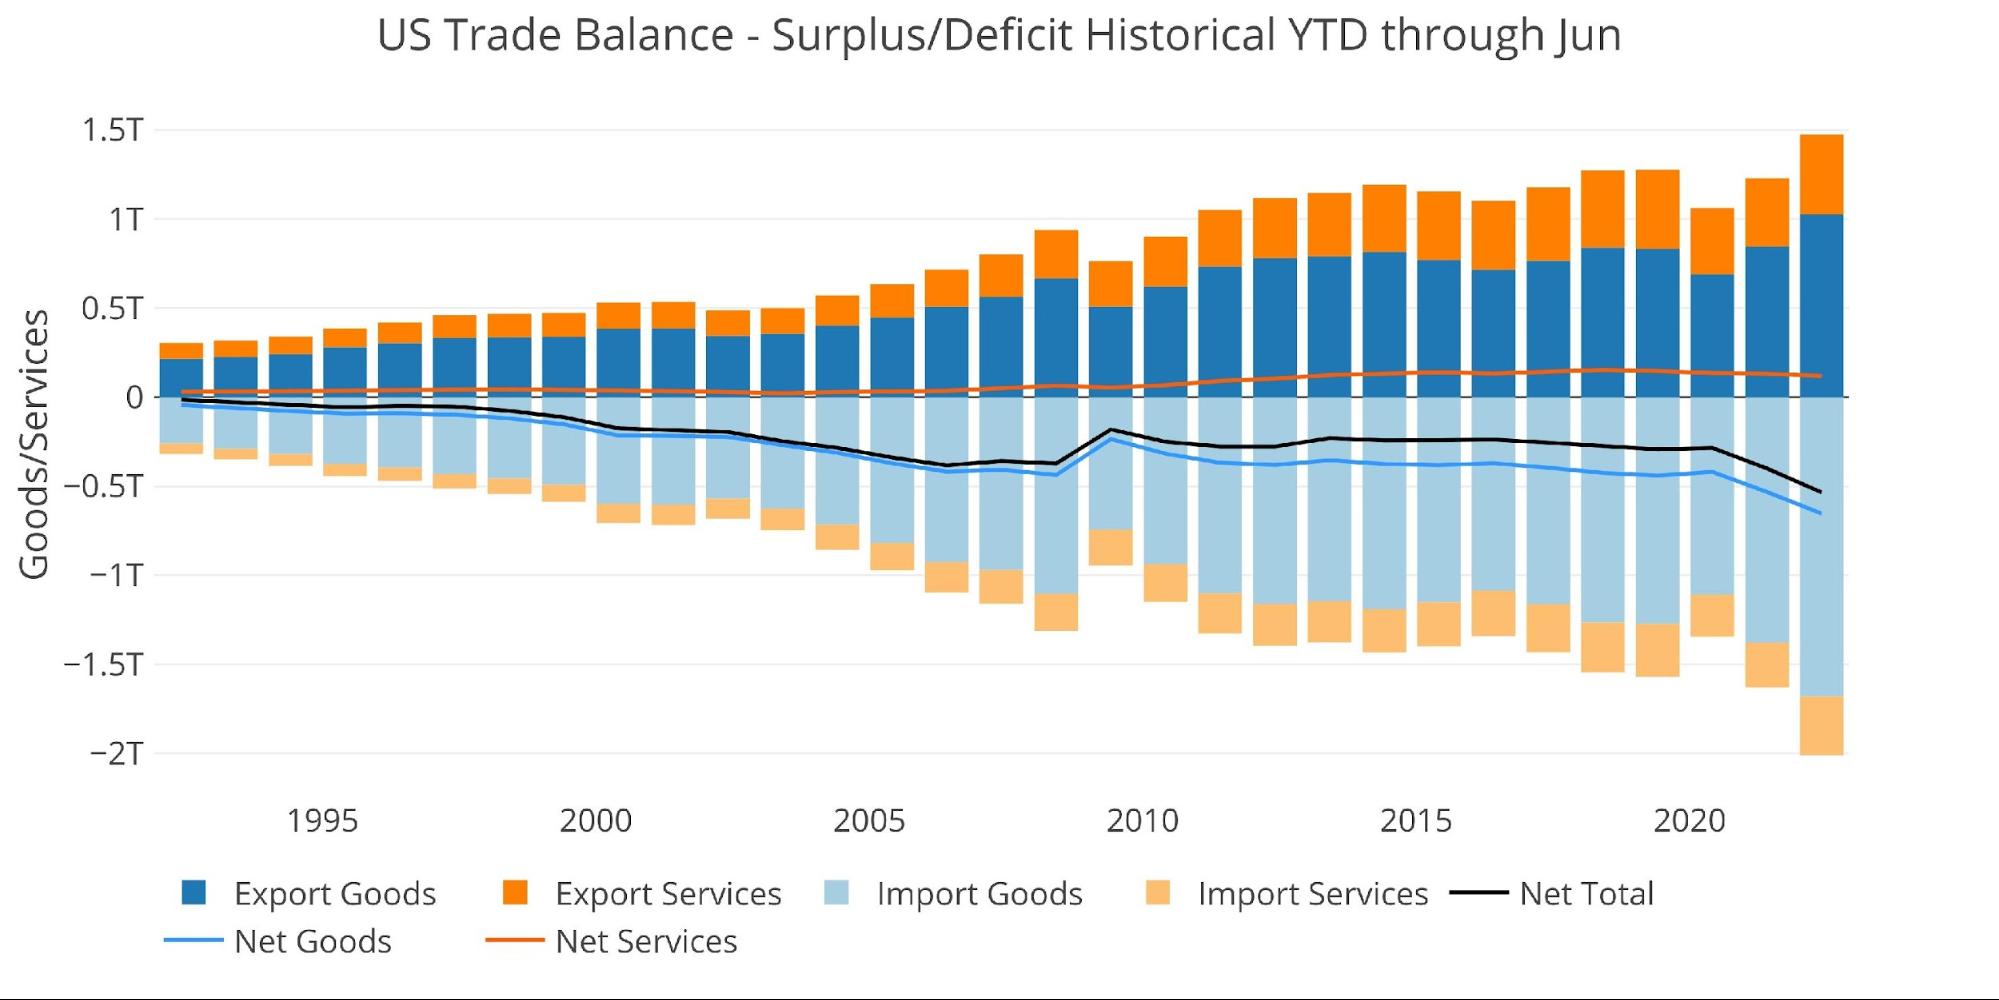
Figure: 7 Year to Date
What it means for Gold and Silver
The deficit can slice both ways. A massive deficit shows a weak economy that is consuming far more than it’s producing. Typically, this is unsustainable, but the US Dollar reserve currency status grants the US economy an exception. The danger is that the US has exported all of its goods-producing capabilities so if/when the world stops accepting dollars, the US could find it much more expensive to import goods.
On the other hand, a shrinking deficit is a good sign of an economy that is producing more. Unfortunately, that is not the case here. The fall is not coming from much larger exports due to expanded goods production. Instead, the fall is coming from a drop in Imported Goods. This is likely due to higher inflation and overall slowing demand similar to 2008.
Despite the fall, everything should still be put into context. The US continues to run massive trade deficits. If the world ever stops accepting dollars this will be an incredible shock to the system. Current US foreign policy is daring the world to dethrone the dollar. For now, there seems to be no alternatives. However, once a currency is backed again by true money (gold and silver), the dethroning could happen quite quickly.
Data Source: https://fred.stlouisfed.org/series/BOPGSTB
Data Updated: Monthly on one-month lag
Last Updated: Aug 04, 2022 for Jun 2022
US Debt interactive charts and graphs can always be found on the Exploring Finance dashboard: https://exploringfinance.shinyapps.io/USDebt/

Call 1-888-GOLD-160 and speak with a Precious Metals Specialist today!
Buka akaun dagangan patuh syariah anda di Weltrade.
Source link