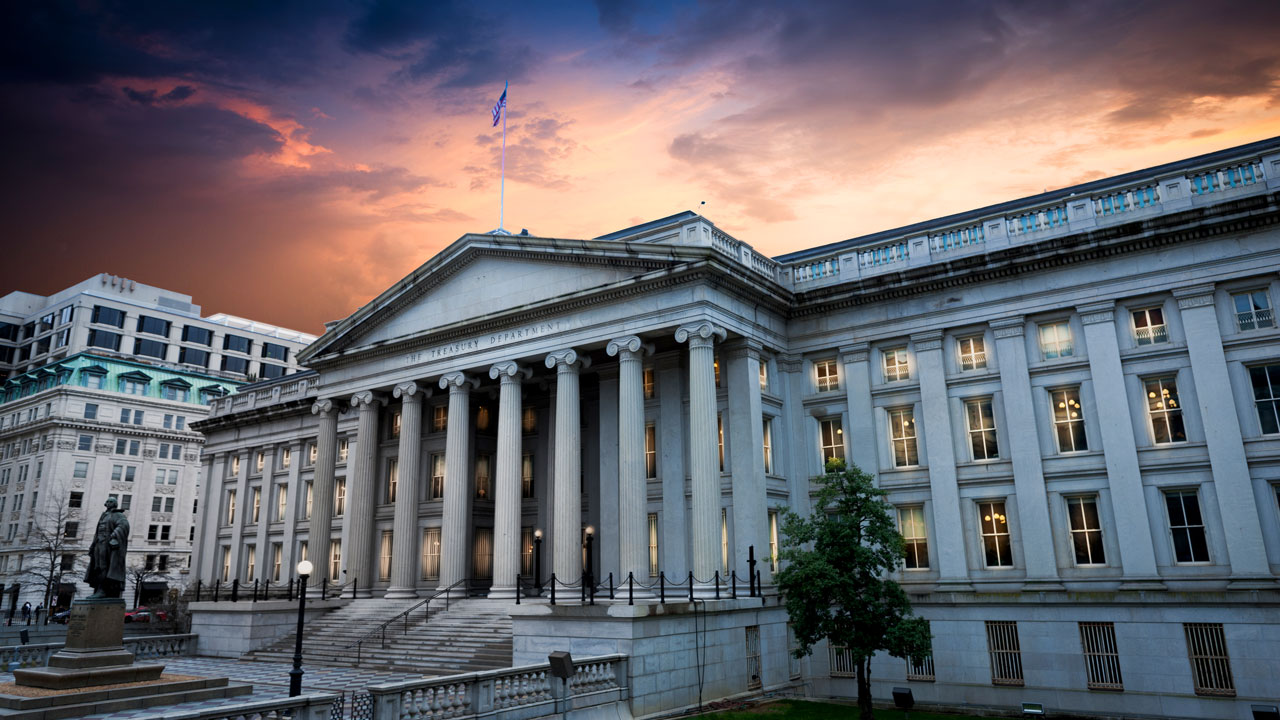
The Treasury increased the total debt by $69B in June. The Treasury continues to roll short-term Treasury Bills into longer-dated securities, allowing $148B in Bills to roll off the debt statement this month.
Note: Non-Marketable consists almost entirely of debt the government owes to itself (e.g., debt owed to Social Security or public retirement)
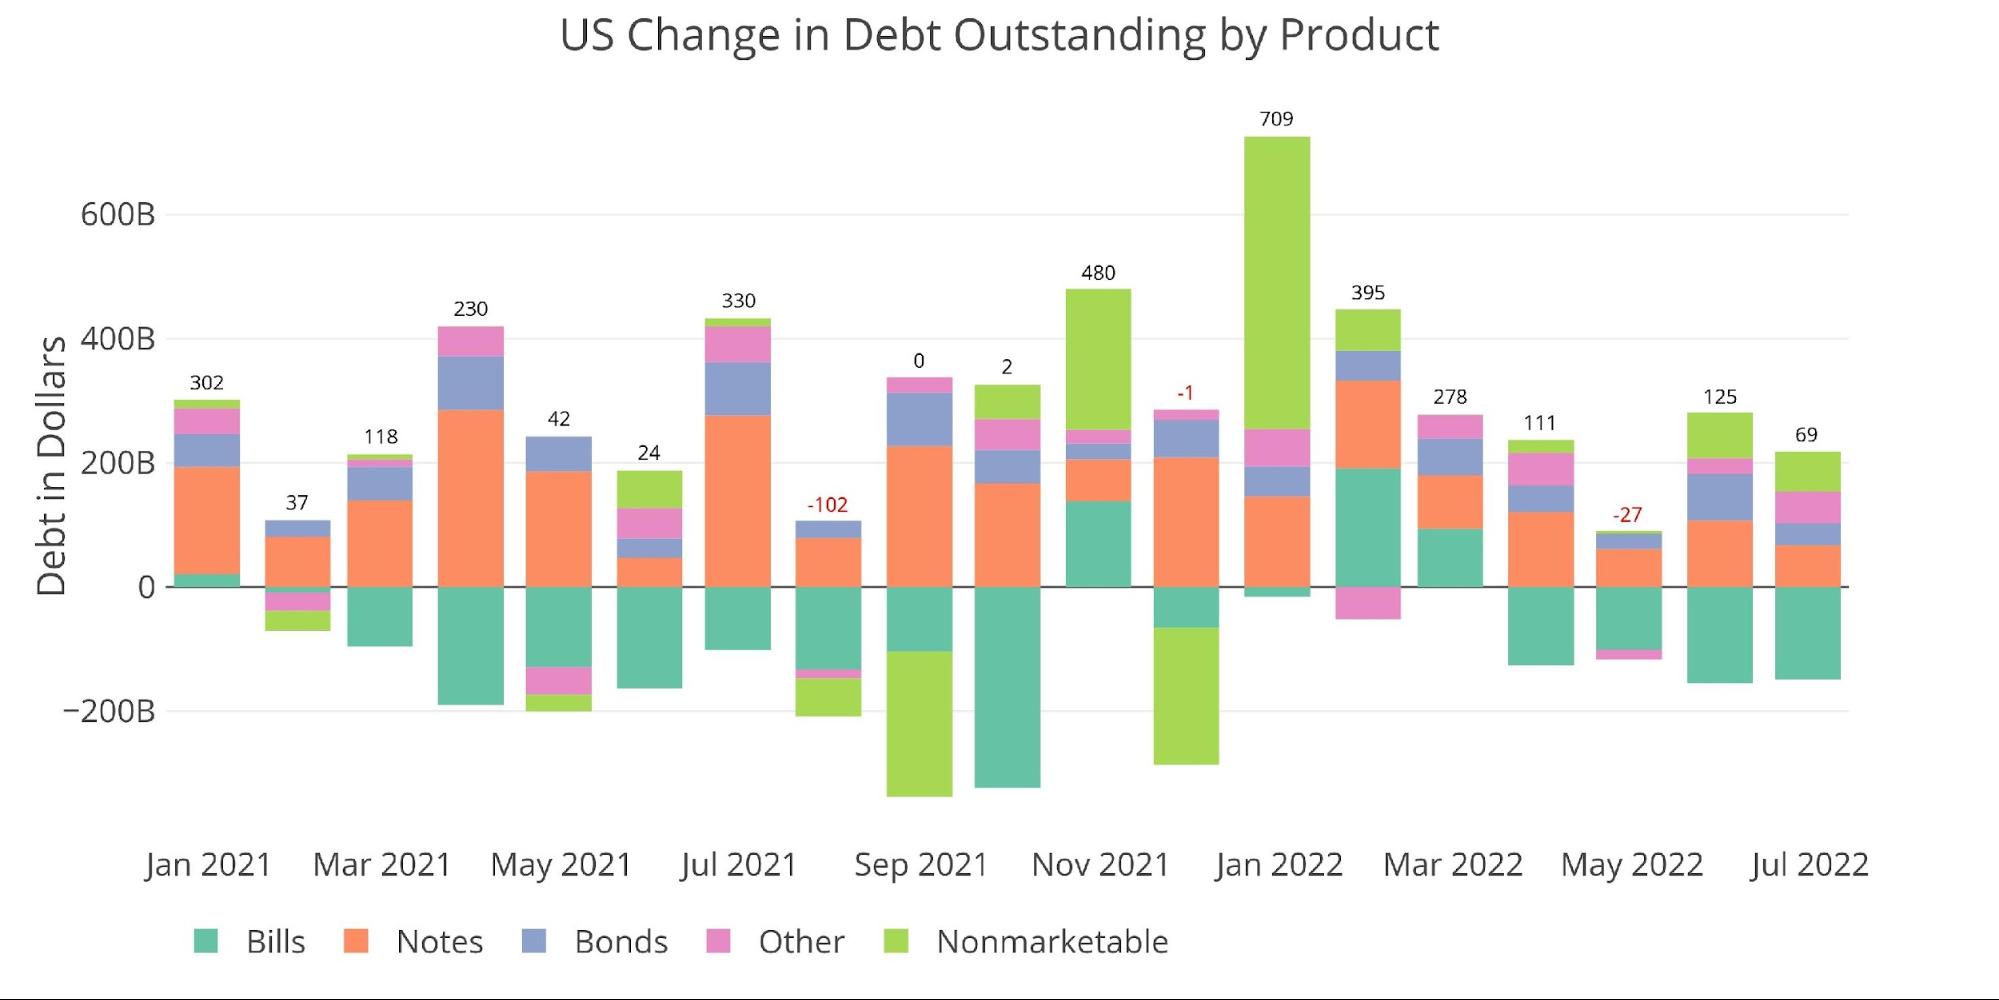
Figure: 1 Month Over Month change in Debt
Total debt has increased in 2022 by $950B. The conversion of short-term to long-term can be seen clearly in the chart below. Last year the Treasury converted $1.2T of short-term to longer-term, averaging $100B a month. Halfway through 2022, that number has fallen to $246B or $41B a month.
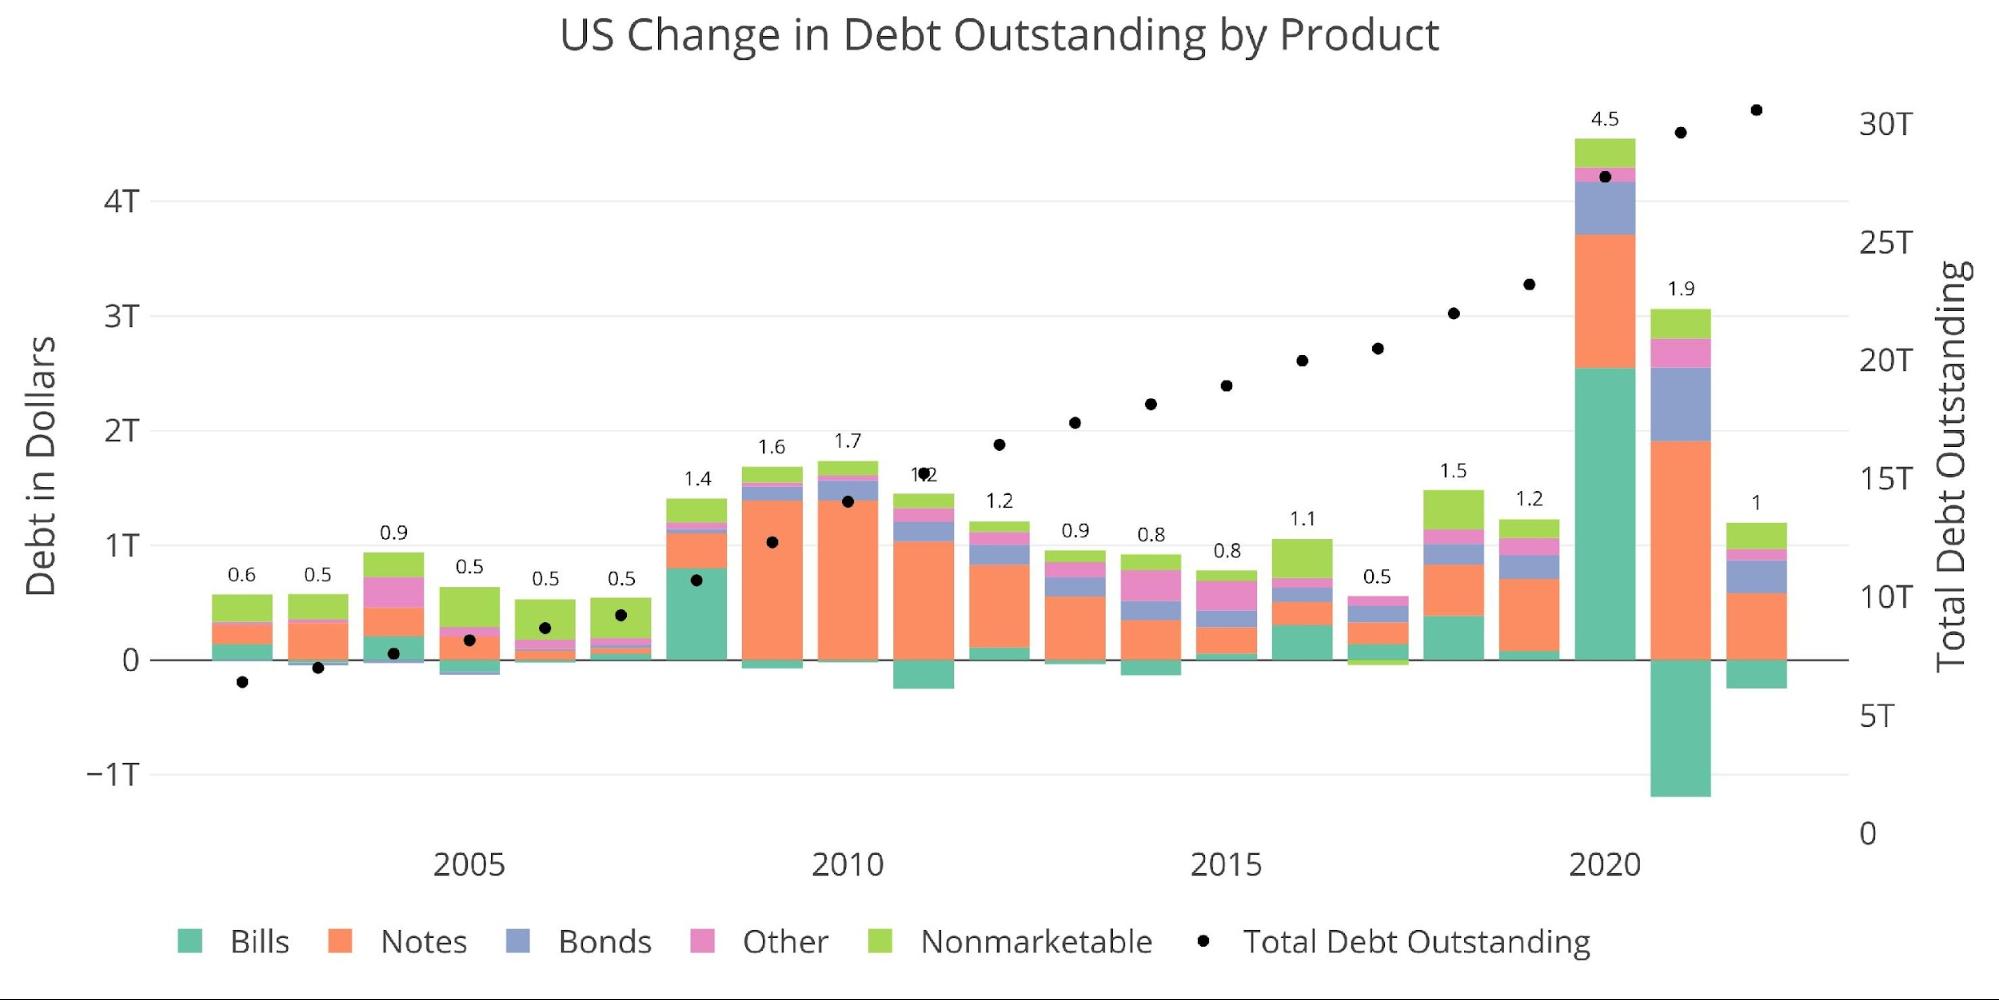
Figure: 2 Year Over Year change in Debt
The impact of this move can be seen below. The weighted average maturity of the debt is now at 6.18 years, up from 5.15 at the depths of the Covid crisis. This is the longest maturity of the debt since at least Jan 2001 which is the full availability of the data.
The impact of higher rates can also be seen. As the Treasury continues to roll over debt into much higher interest rates, the average interest rate is increasing. In the latest month, it has reached 1.5%. This is still well below current rates, suggesting there is room for this to move much higher.
Figure: 3 Weighted Averages
The impact of higher rates can be seen below. The color chart represents annualized interest on the main security types (i.e., Bills, Bonds, Notes, and TIPS). The black line represents the TTM net interest paid according to the Treasury Statement that summarizes expenses.
The gap between the two represents Nonmarketable securities and Inflation related expenses. Regardless of the difference, one thing is clear: interest expense is surging. The last Treasury Statement was published in early June, capturing expenses through May which showed $423B in Net Interest expense!
Unfortunately, this latest surge has not even begun to factor in the June 75bps hike nor the upcoming 50-75bps hike expected this month. This means that the Treasury is paying $423B in interest before rates increased by 150bps. There is no question that Net Interest Expense is about to blast through $500B.
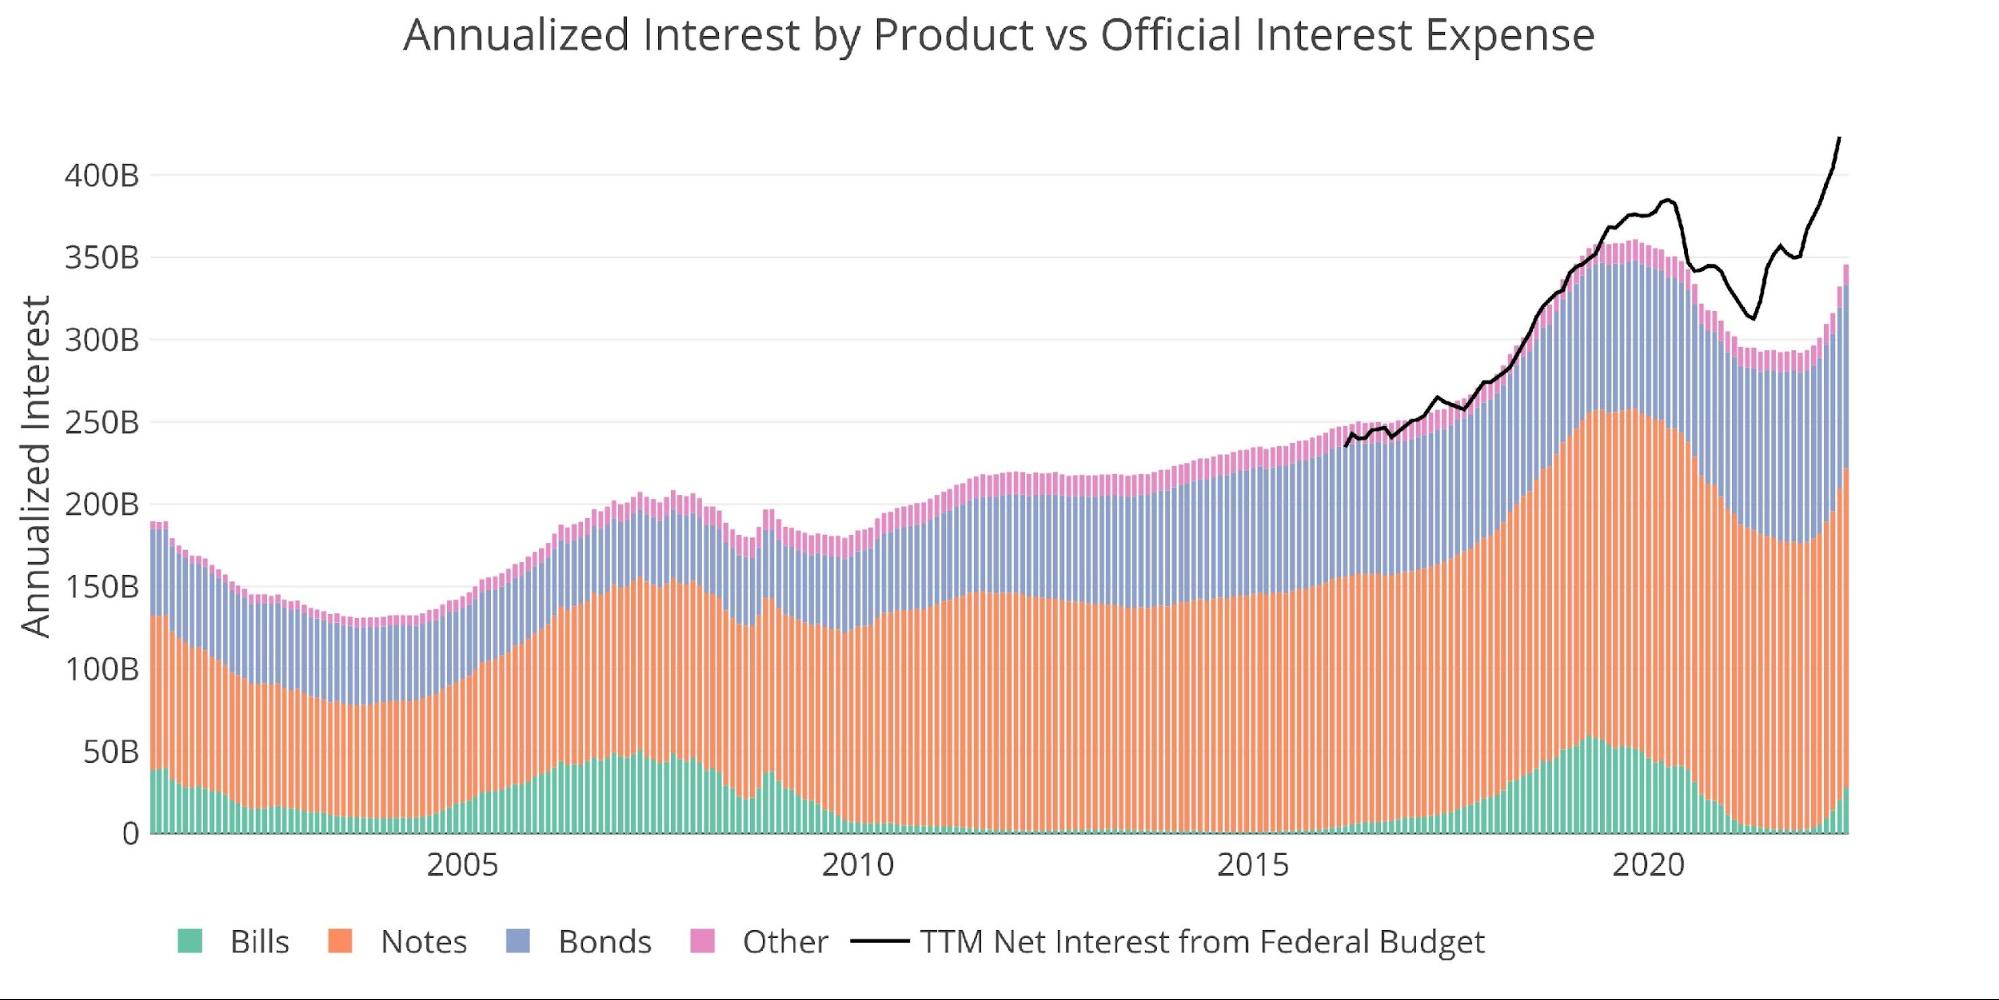
Figure: 4 Net Interest Expense
Digging into the Debt
The table below summarizes the total debt outstanding. A few key takeaways:
-
- The last two months have seen much more aggressive moves in closing out short-term debt
-
- ~$170B a month vs $53B 12-month average
-
- 1-3 Year notes also saw a monthly reduction of $41B – another move to extend maturity
- Non-marketable is also climbing at a rate faster than the 12-month average
- The last two months have seen much more aggressive moves in closing out short-term debt
On a TTM Basis:
-
-
- Debt has increased by $2T over the last 12 months, almost exactly the same as the previous 12 months
-
- The distribution of issuance has changed significantly (second to last column), falling from 0-7 years but increasing dramatically (350%) in 7-10 year instruments
-
- Over the last 3 concurrent years, debt has exploded by more than $8.5T
- Debt has increased by $2T over the last 12 months, almost exactly the same as the previous 12 months
-
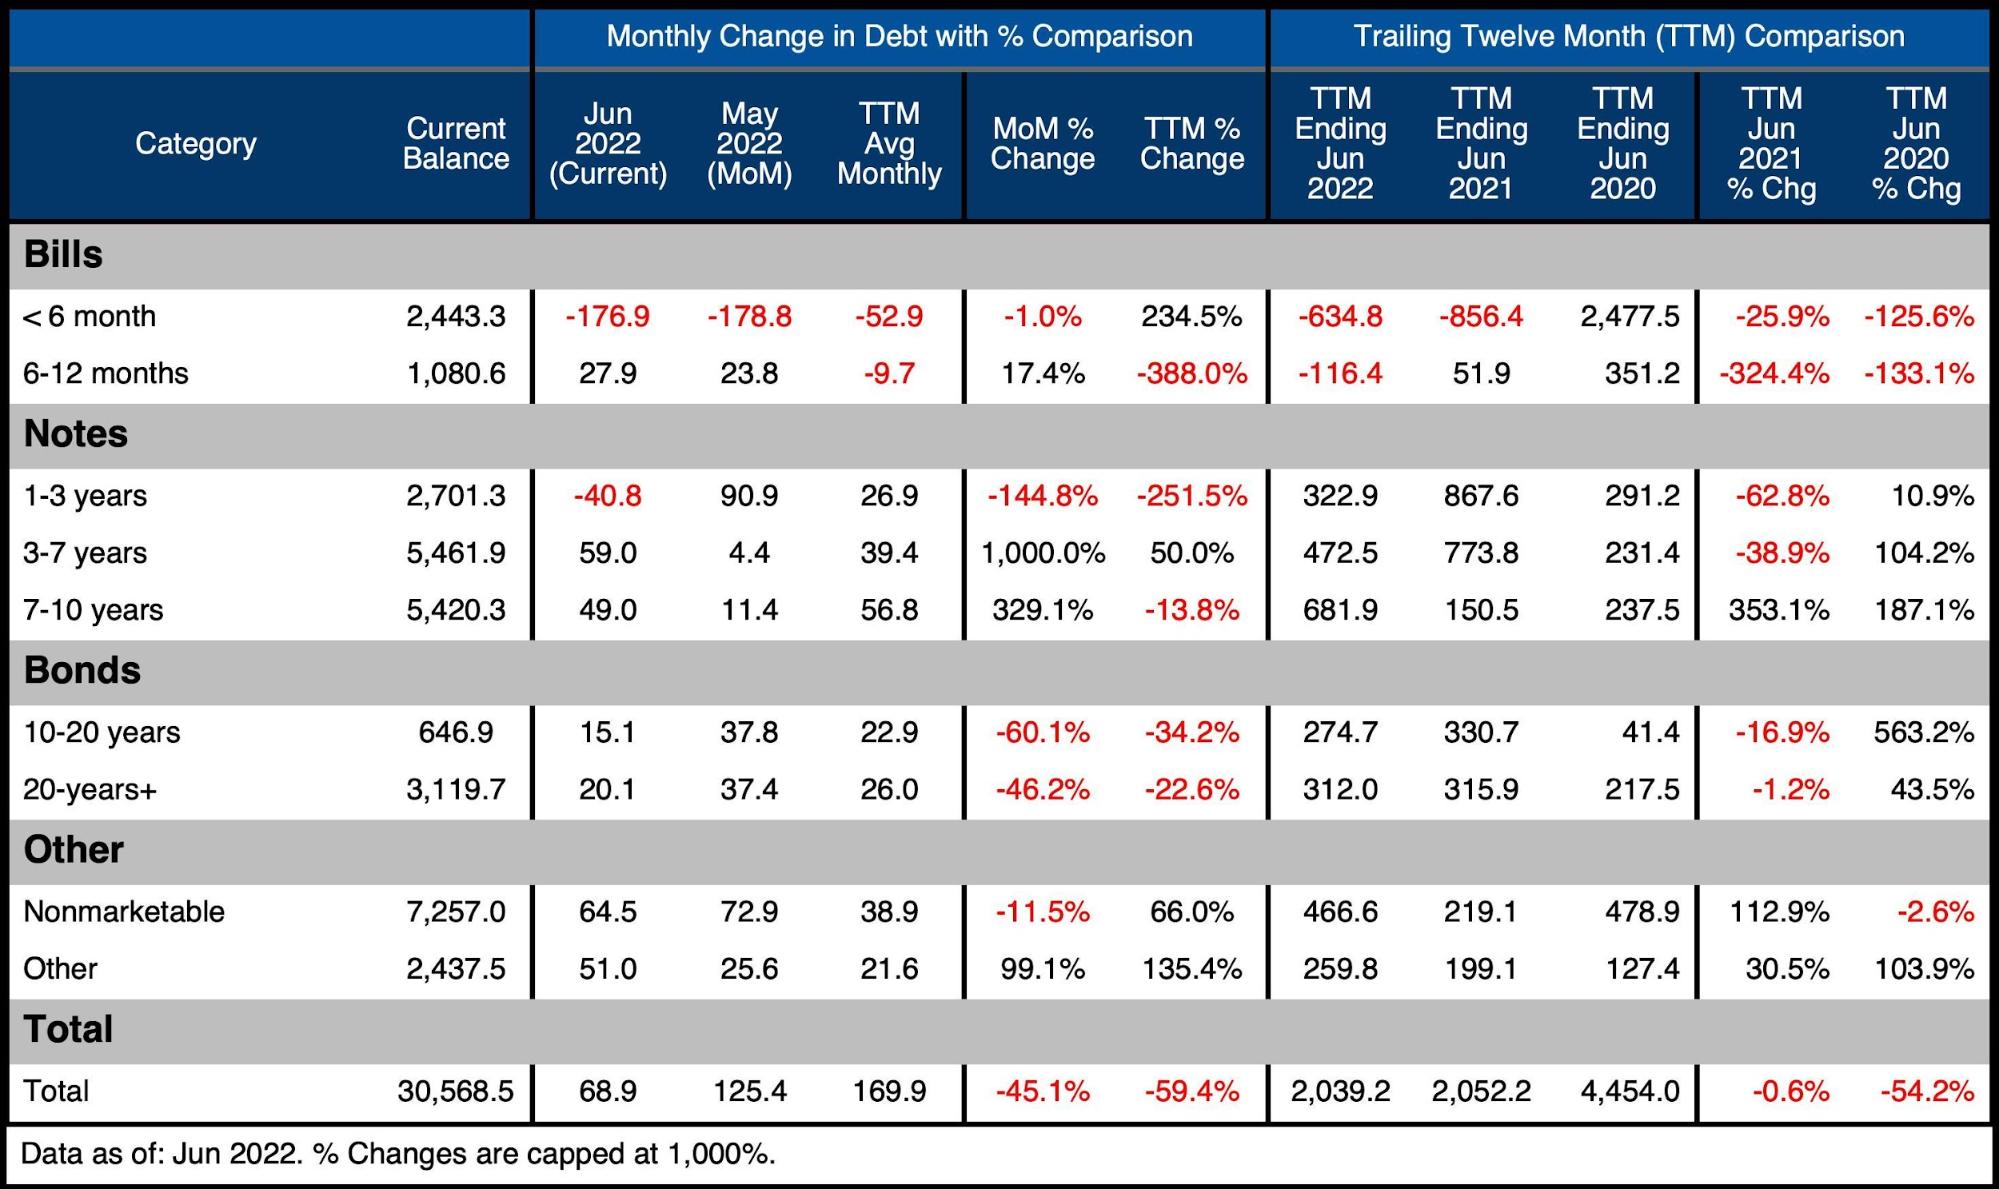
Figure: 5 Recent Debt Breakdown
Debt Rollover
As mentioned above, the annualized interest is set to explode even higher in the months ahead. The chart below shows the debt that will be rolled over in the coming months. This will be trillions in debt that will all be refinanced at rates that are 150bps higher!

Figure: 6 Monthly Rollover
Note “Net Change in Debt” is the difference between Debt Issued and Debt Matured. This means when positive it is part of Debt Issued and when negative it represents Debt Matured
T-Bills (< 1 year)
The majority of monthly rollover occurs in Treasury Bills. Interestingly, the Bid to Cover ratio has fallen quite quickly over the last few months indicating less market demand for short-term debt. This softer demand is surprising given that issuance rates are falling.
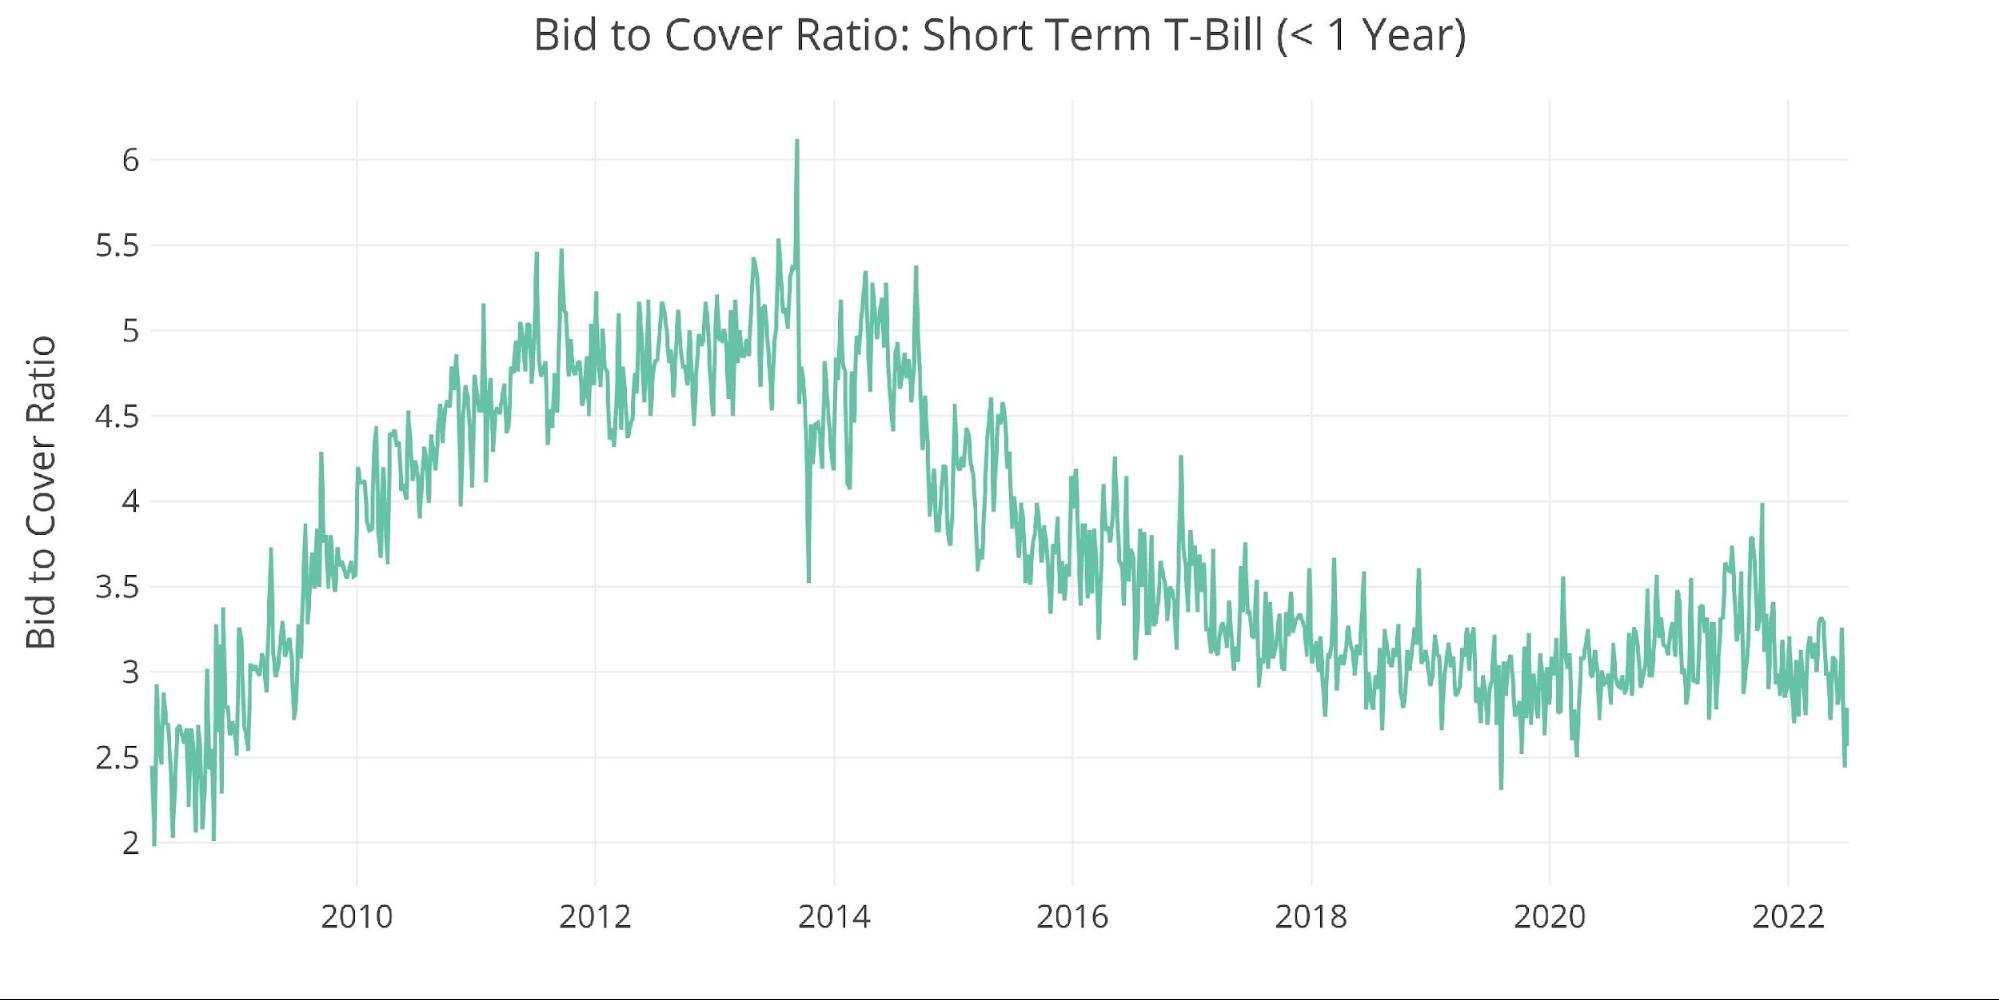
Figure: 7 T-Bill Bid to Cover
Treasury Notes (1-10 years)
The other maturities are not showing the same drop in demand. While the 10-year bid to cover has fallen, it’s still hovering around 2.3-2.4 with demand for 2 year staying strong.
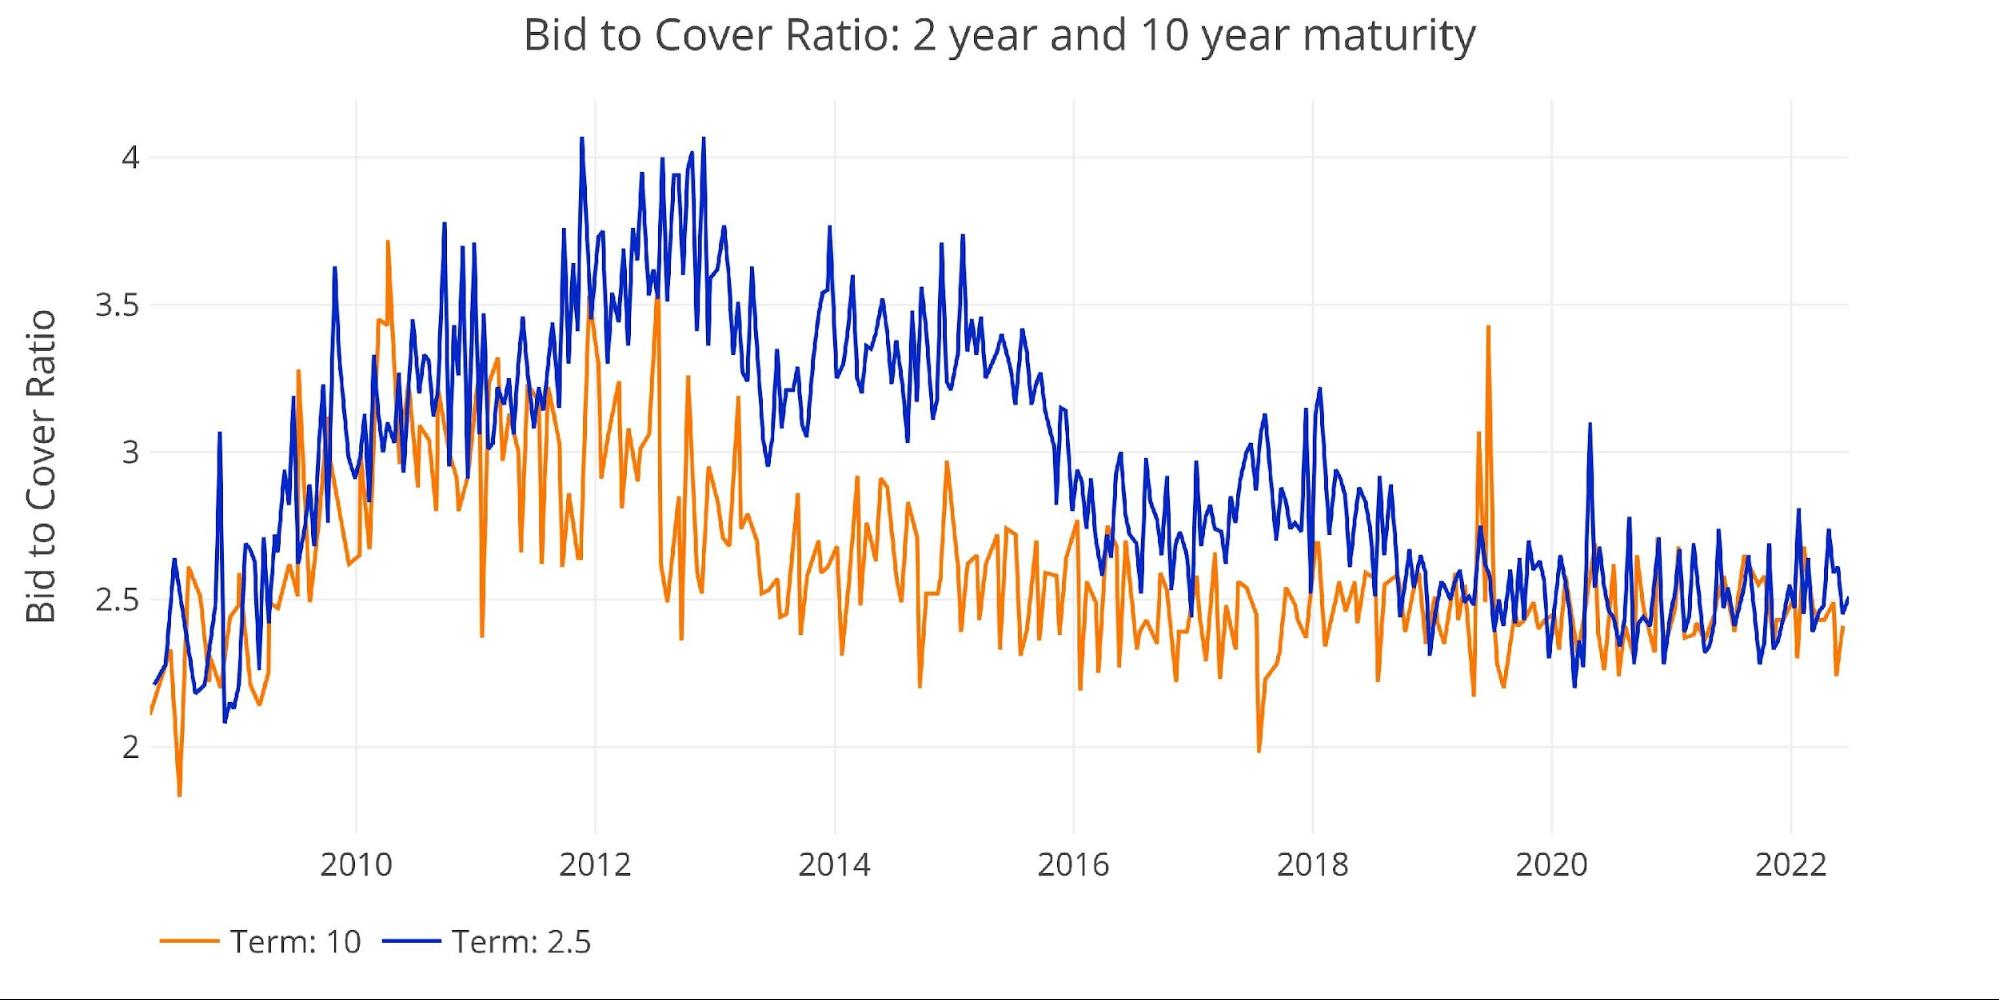
Figure: 8 2-year and 10-year bid to cover
Interest Rates
The chart below shows the trajectory of interest rates since 2000. The Treasury has benefited greatly from a consistent reduction in rates over the last 20 years. The tide has clearly turned as interest rates have exploded upwards unlike anything seen in recent history. The current move has happened faster than in 2006 and 2017. This is why interest payments are moving up so quickly, not to mention the enormous debt balance.

Figure: 9 Interest Rates
Historical Perspective
While total debt has now exceeded $30T, not all of it poses a risk to the Treasury. There is $7T+ of Non-Marketable securities which are debt instruments that cannot be resold. The vast majority of Non-Marketable is money the government owes to itself. For example, Social Security holds over $2.8T in US Non-Marketable debt. This debt poses zero risk because any interest paid is the government paying itself. The risk will be when Social Security needs to start selling that debt.
The remaining $23T is broken down into Bills (<1 year), Notes (1-10 years), Bonds (10+ years), and Other (e.g., TIPS). The Fed owns $5.7T, which also poses zero risk because the Fed remits all interest payments back to the Treasury. This benefit is large enough that the Fed has been reluctant to begin shrinking its balance sheet, which would turn a tailwind into a headwind for the Treasury.
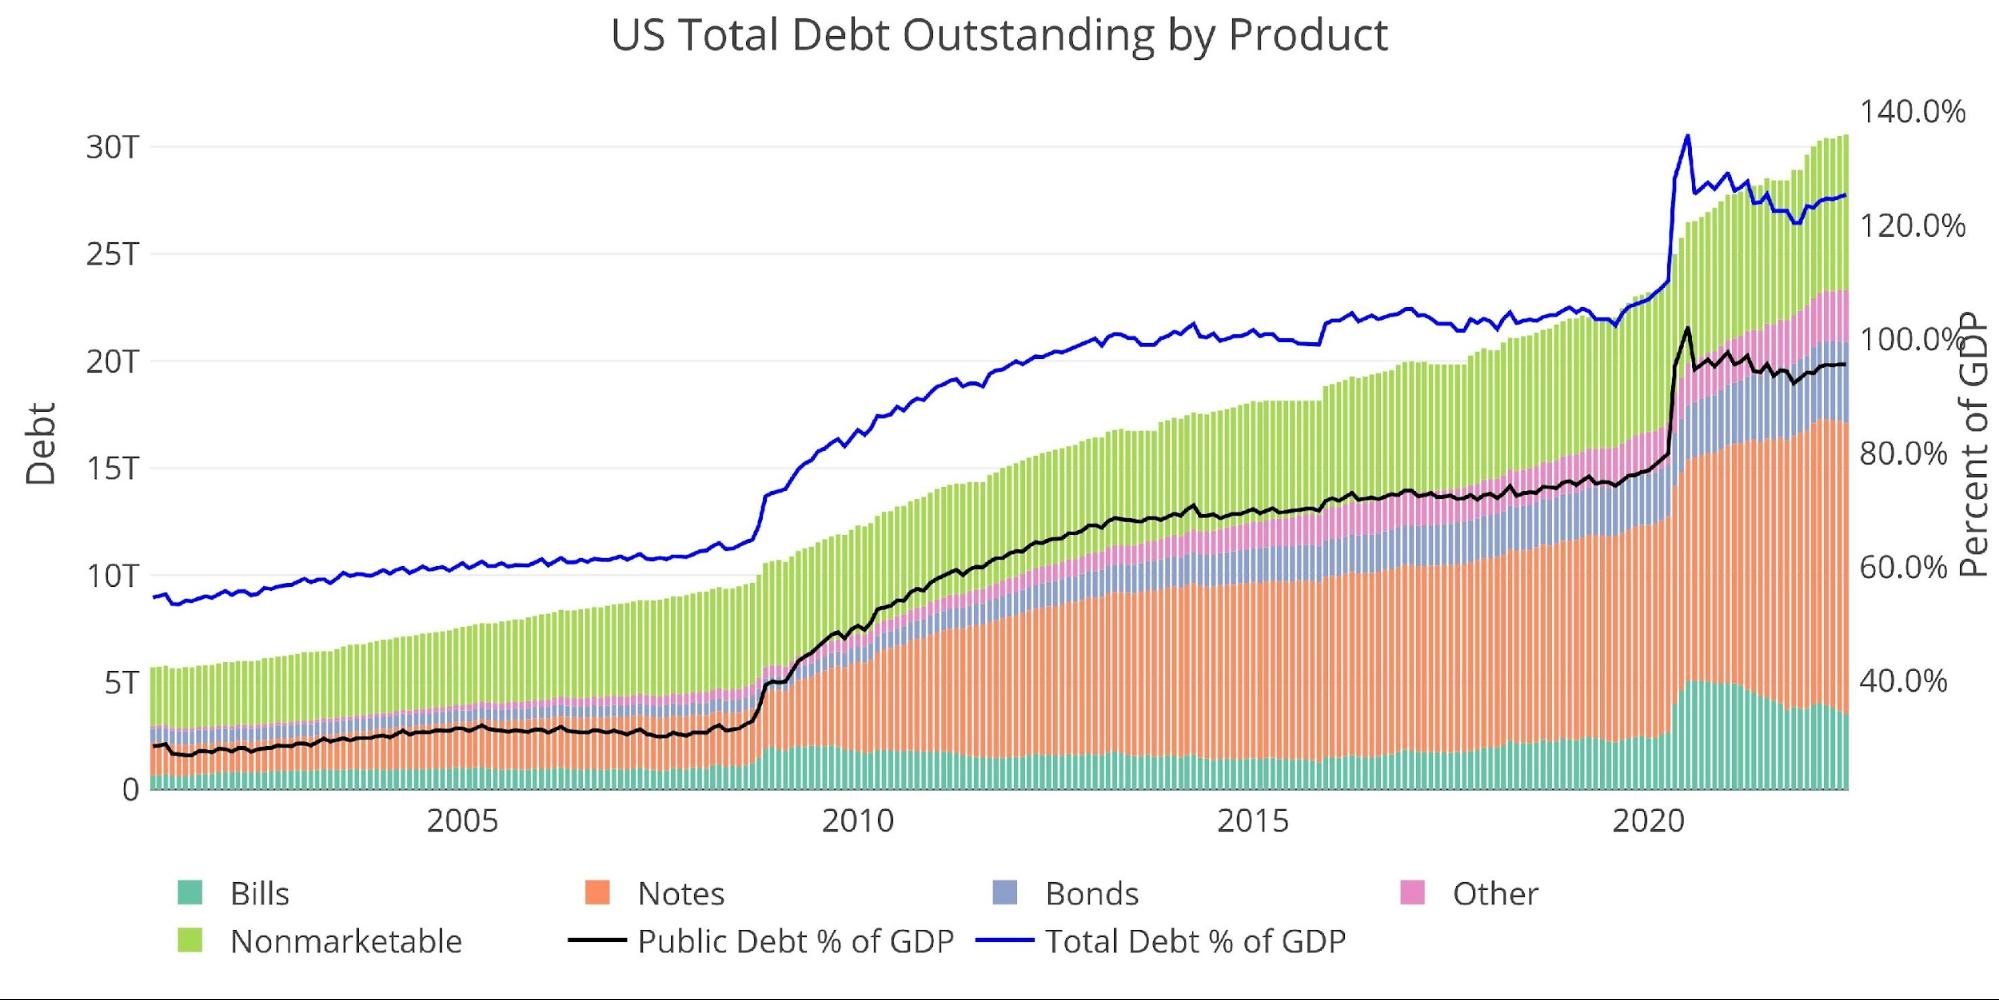
Figure: 10 Total Debt Outstanding
The chart below shows how the reprieve offered by Non-Marketable securities has been fully used up. Pre-financial crisis, non-marketable debt was more than 50% of the total. That number has fallen below 24%. In recent months, the Treasury has increased issuance of Non-Marketable but it’s not enough to make up the ground it has lost.
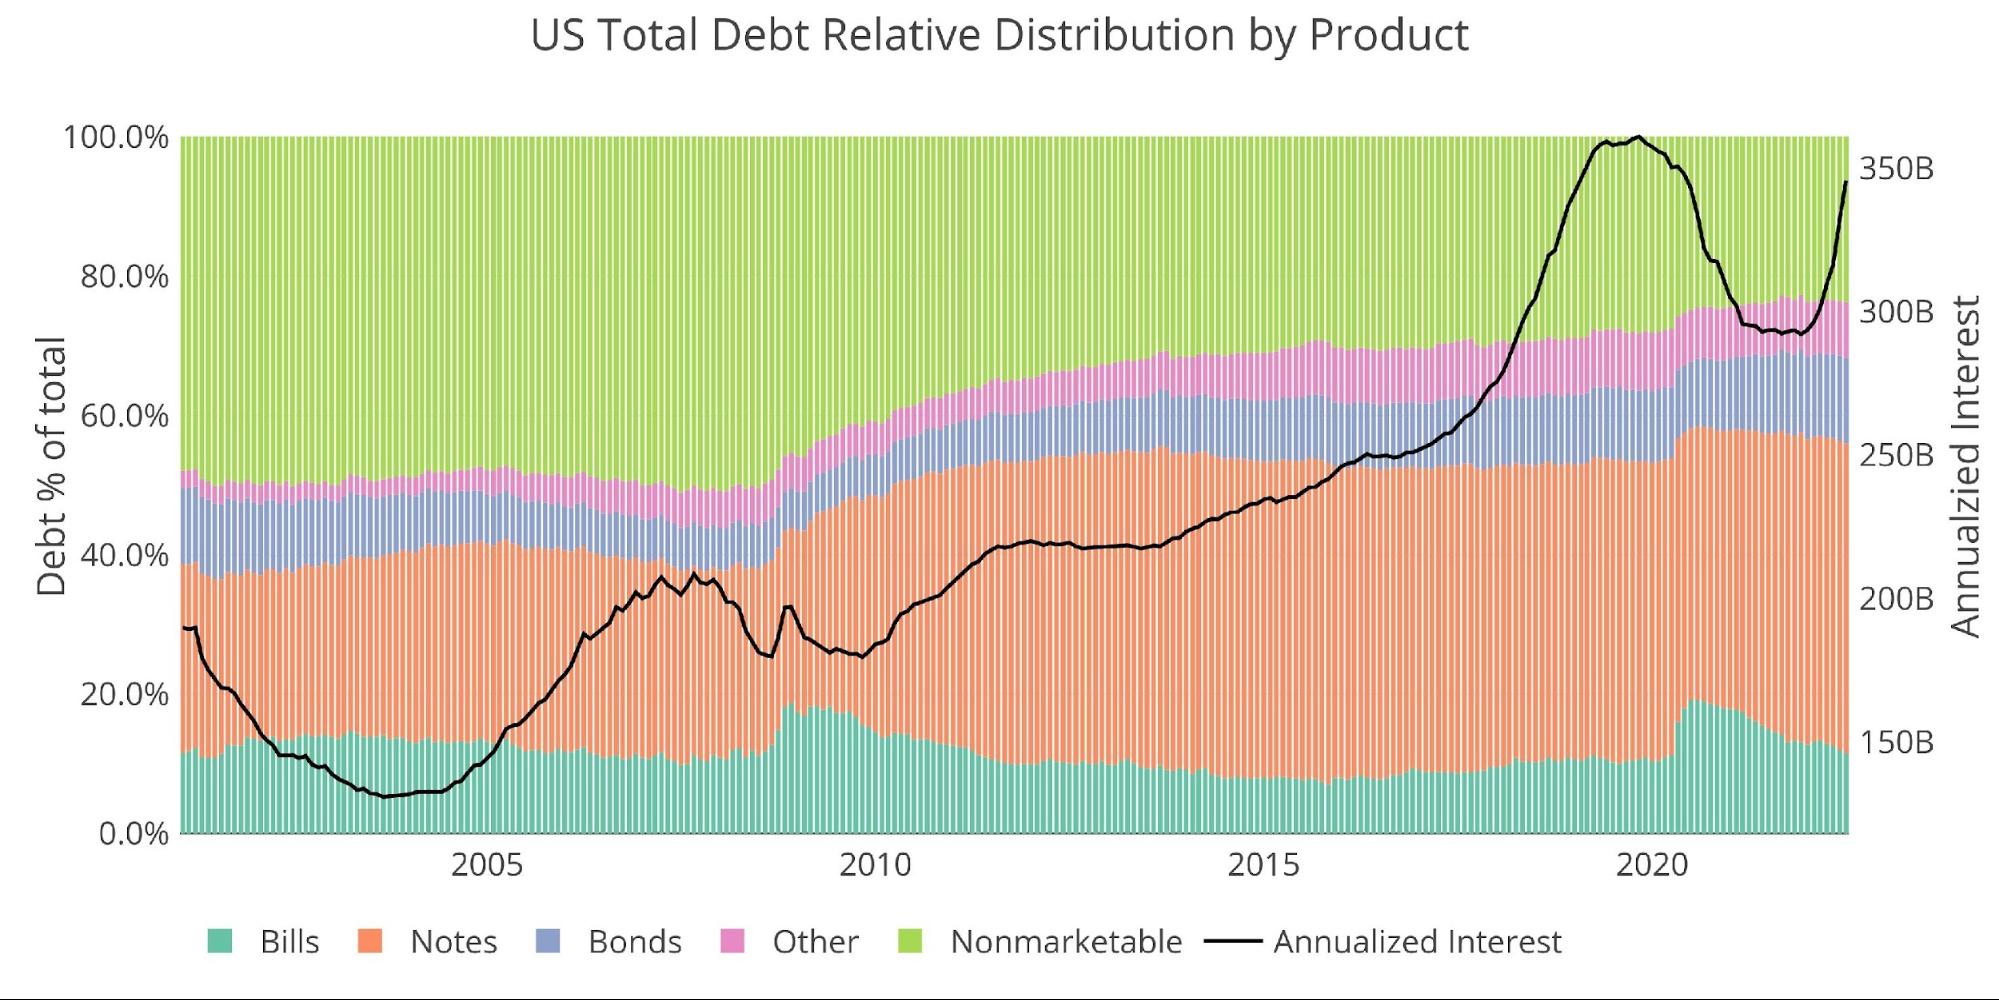
Figure: 11 Total Debt Outstanding
Historical Debt Issuance Analysis
As shown above, recent years have seen a lot of changes to the structure of the debt. Even though the Treasury has extended out the maturity of the debt, it no longer benefits from the free debt in Non-Marketable securities. Furthermore, the debt is so large that even though short-term debt has shrunk as a % of total, it is still a massive aggregate number ($3.5T).
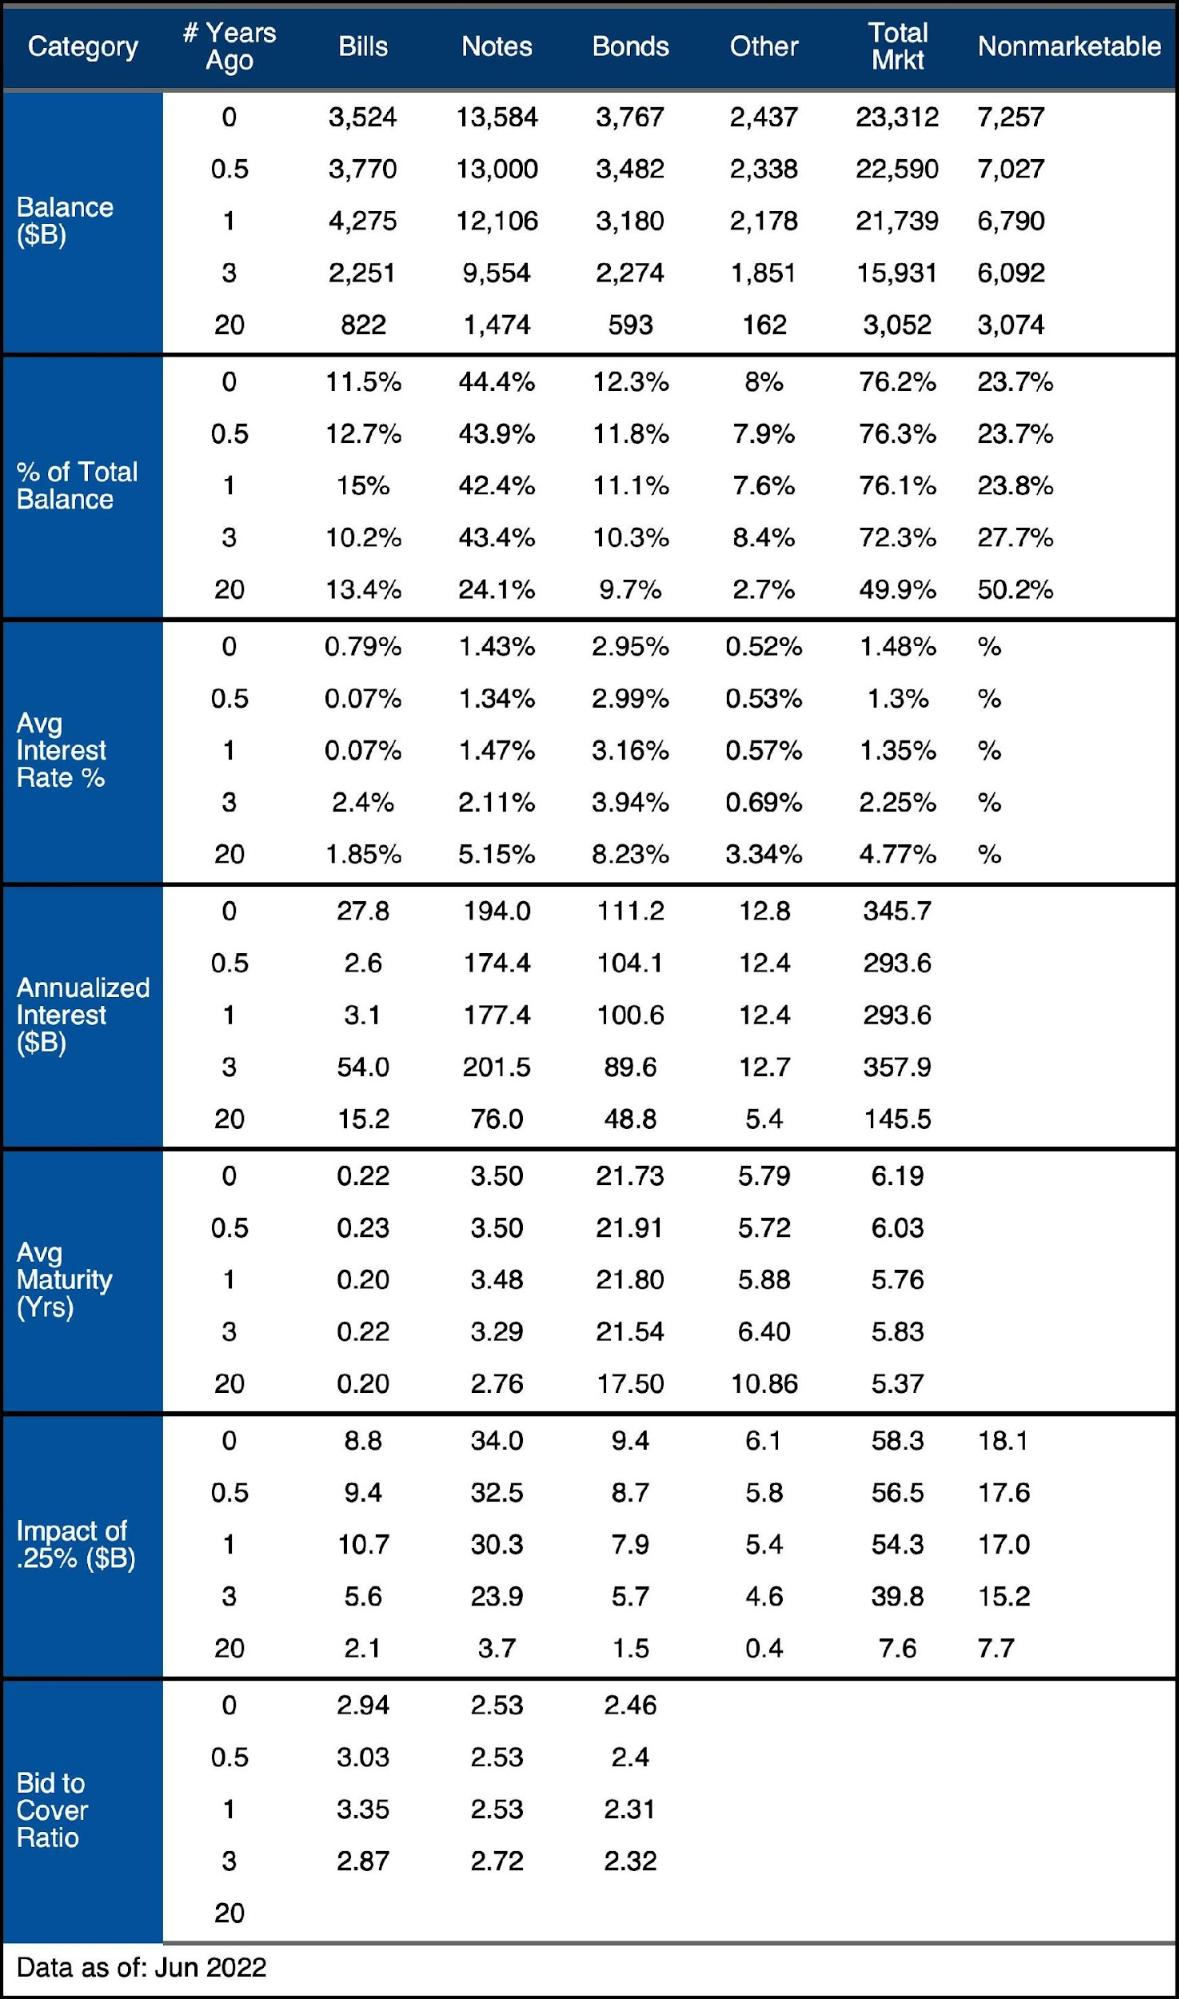
Figure: 12 Debt Details over 20 years
It can take time to digest all the data above. Below are some main takeaways:
-
- In a single year, Bills have fallen from 15.5% of the total to 11.5%
-
- Bonds now make up 12.3% of the total debt, the highest value based on the data available
- Notes make up 44.4% of the total debt, nearly double the amount 20 years ago
-
- Average maturity has increased from 2.76 years to 3.51 years
-
-
- Average interest rates on notes are now at 1.48%
-
- This is up from a year ago when avg rate was 1.35%
-
- Annual interest on Bills has increased from $2.6B 6 months ago to $27.8B today
-
- This is a massive move in 6 months and is just getting started
- Interest on Notes has increased $20B in 6 months – this is due to balance increase and higher rates (1.34% to 1.43%)
- Interest on Bonds is up $10B in the last year due to higher balances, rates have fallen from 3.16% to 3%
-
- In a single year, Bills have fallen from 15.5% of the total to 11.5%
What it means for Gold and Silver
The Treasury is watching its interest payments explode rapidly. With the Fed’s aggressive course of action, the impact of higher rates is being felt much quicker than in prior rate hike cycles.
The Treasury has to hope the Fed wins its inflation fight quickly and can immediately lower rates back down. Every rate hike will bring massive new costs to the Treasury expenses and every month that rates stay elevated becomes more debt rolled over at higher rates. This is not sustainable!
The balance on Notes is $13.5T with an average rate of 1.43% and maturity of 3.5 years. With current rates at 3%, the Treasury would owe an extra $200B on Notes alone it if was refinanced at current rates! This does not include Bills, does not include new debt to be added, and does not consider the impact of future rate increases.
The Treasury has maneuvered to reduce the impact of rising rates, but there is only so much that can be done with $30T. Higher rates are devastating. The Fed does not have time for a lengthy inflation fight, but it still has real rates extremely negative so the fight is just getting started. The Fed can talk tough, but the math is clear… they can only do so much before they send the Treasury into a debt spiral.
Data Source: https://www.treasurydirect.gov/govt/reports/pd/mspd/mspd.htm
Data Updated: Monthly on fourth business day
Last Updated: Jun 2022
US Debt interactive charts and graphs can always be found on the Exploring Finance dashboard: https://exploringfinance.shinyapps.io/USDebt/

Call 1-888-GOLD-160 and speak with a Precious Metals Specialist today!
Buka akaun dagangan patuh syariah anda di Weltrade.
Source link