
This analysis focuses on gold and silver physical delivery on the Comex. See the article What is the Comex for more detail.
Silver: Recent Delivery Month
Silver is wrapping up May which is a major month contract on the Comex. Delivery volume has been falling and resumes the downward trend that has been ongoing for a year. As the chart below shows, December and March now appear to be anomalies rather than a change in trend (for now).
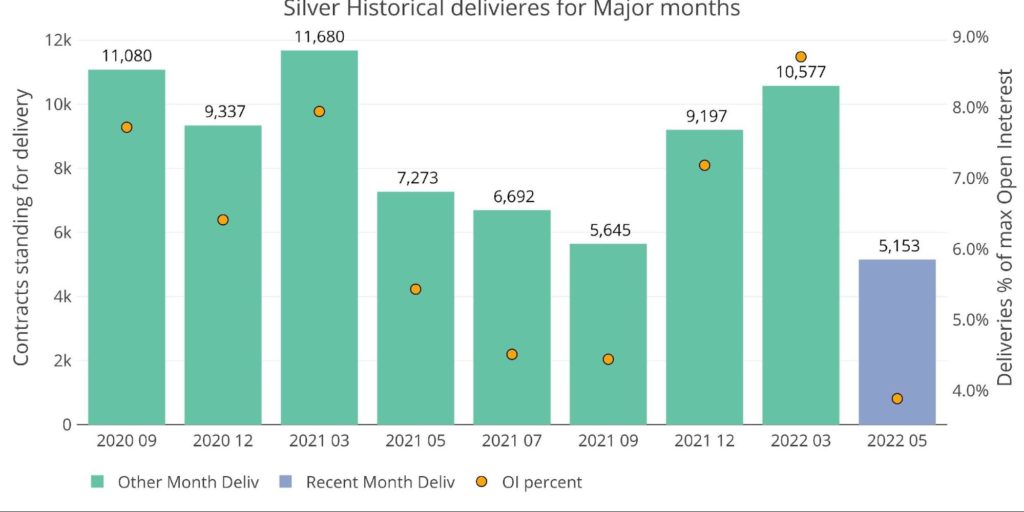
Figure: 1 Recent like-month delivery volume
Part of the low delivery volume can be attributed to the highest cash settlement of contracts since July of last year. So far, 436 contracts have cash settled instead of standing for delivery. However, even if you add the cash settlement to the remaining open interest (445) you would only have 881 additional contracts standing for delivery. When added to the current delivery volume of 5,153, you would get a total just above last September but below last July.
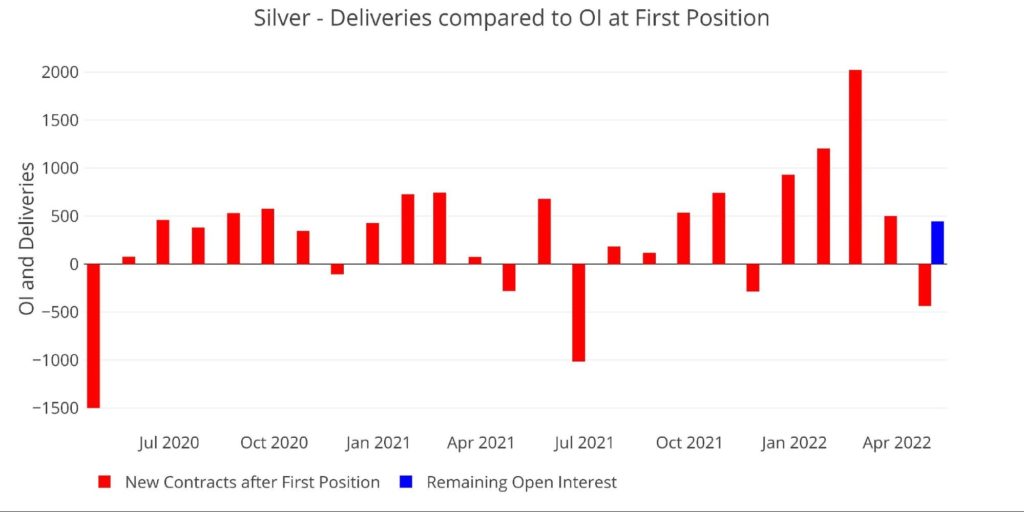
Figure: 2 24-month delivery and first notice
The better question this month is not “Why does delivery volume continue to fall?”, but instead “Why are contracts cash settling?”. The Comex Stock Report shows plenty of available inventory. If that was the case, then why would a contract holder keep their contract through First Notice only to cash settle in the end?
December and July were the other big cash settlement months, but there was a lot of activity going on around those months that may have prompted some shorts to want to cash settle. With the price of silver getting smashed lately, what would prompt cash settlement of almost 10% of the contracts?
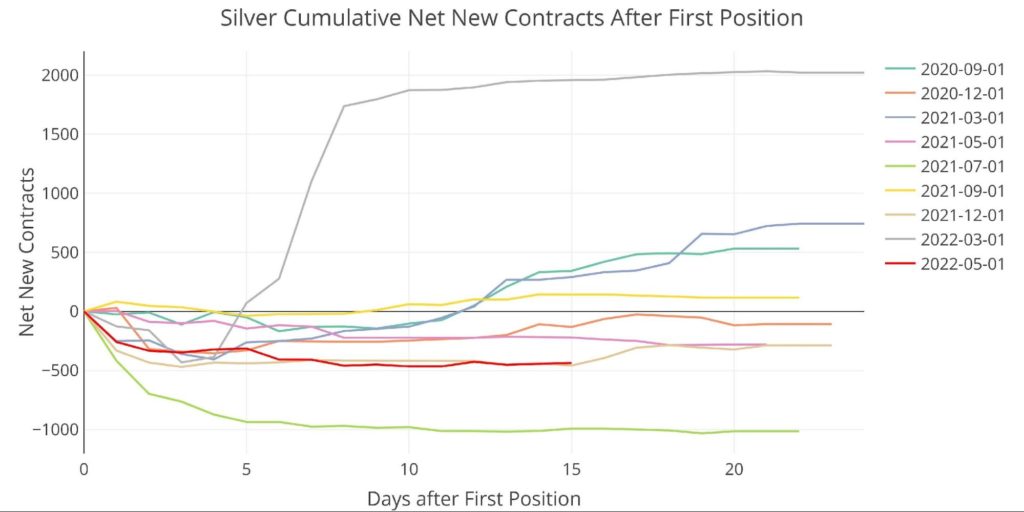
Figure: 3 Cumulative Net New Contracts
Further adding to the suspicion this month is the activity at the bank house accounts. Bank of America has a second month of zero activity after seeing extremely elevated activity from Dec-Mar. Furthermore, on net, this is the bank’s biggest delivery out volume in house accounts since December. If you exclude the massive outflow from BofA, this is the largest since July last year.
Why are the bank house accounts continuing to part with silver? What happened to BofA? It’s unlikely these questions will be answered, but the data is clearly showing strange activity. Especially considering the depressed delivery volume this month.
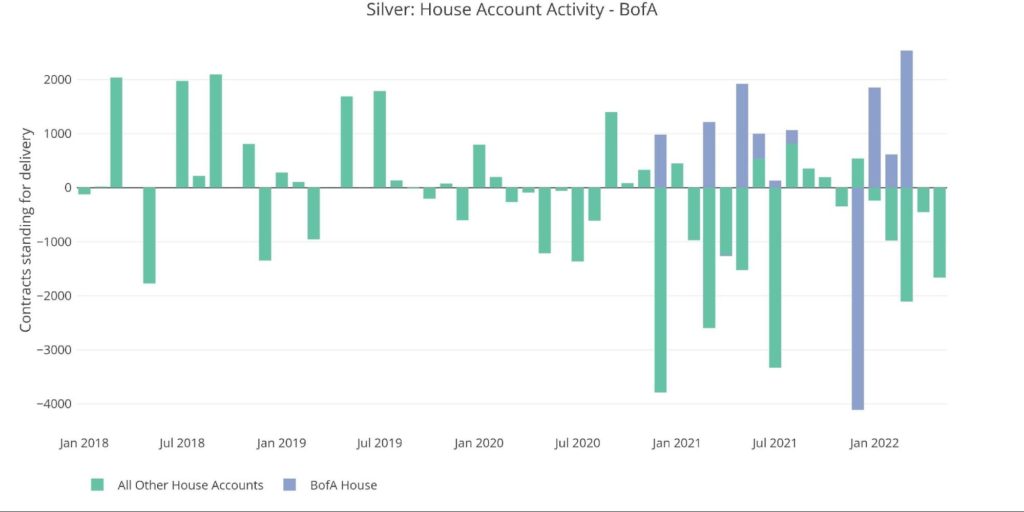
Figure: 4 House Account Activity
As shown below, this May is very average compared to the last 5 years. It should finish slightly above $600M in total delivery, but this would be below both 2020 and 2021.
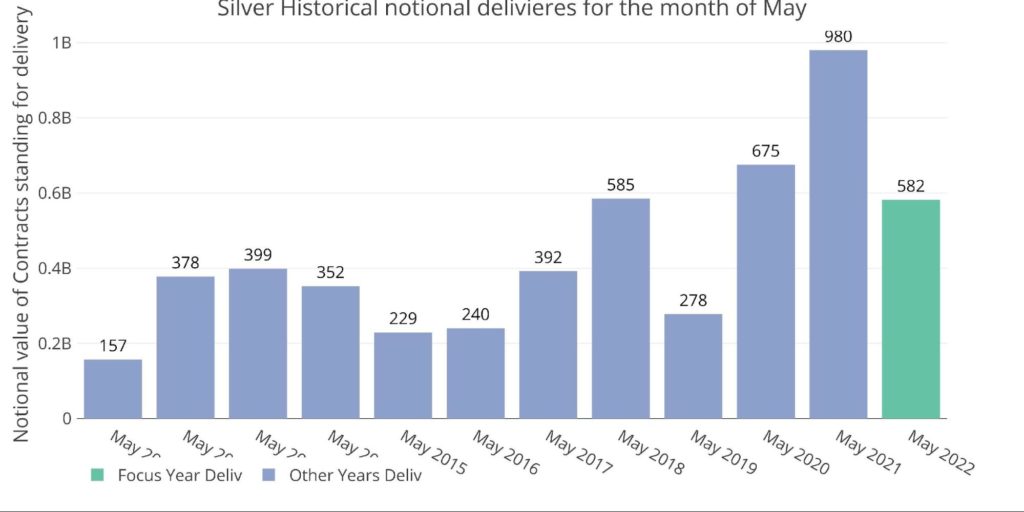
Figure: 5 Notional Deliveries
Silver: Next Delivery Month
Jumping ahead to June also shows fairly average open interest. Current OI is middle of the pack compared to other minor months around the same time in the cycle.
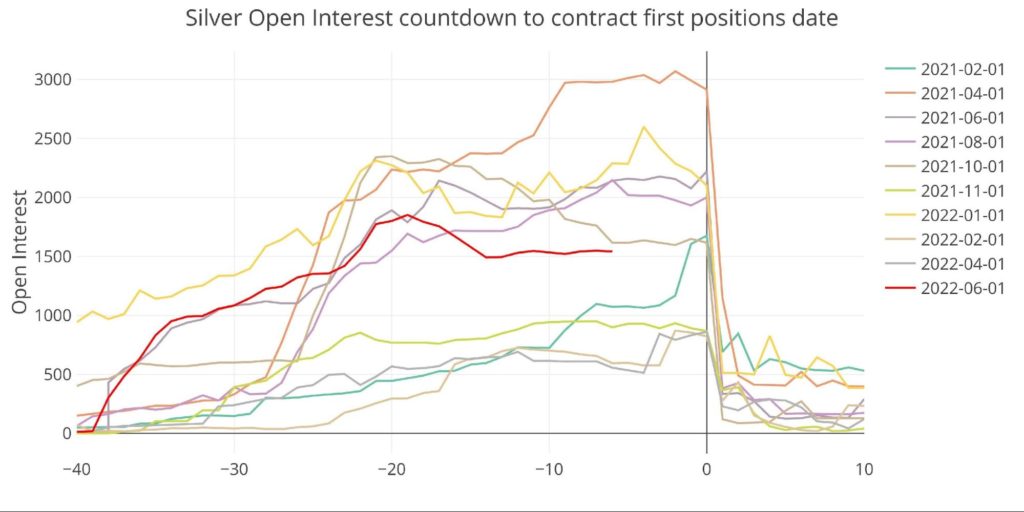
Figure: 6 Open Interest Countdown
At the current level of open interest (1542), delivery volume would exceed April but still be the second-lowest over the last 18 months.
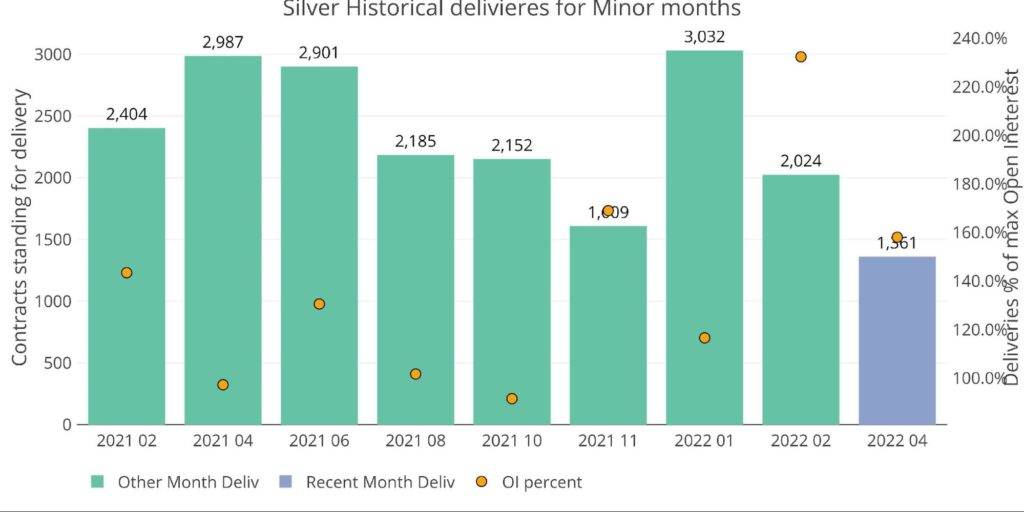
Figure: 7 Historical Deliveries
Gold: Recent Delivery Month
While silver momentum slows, albeit, against suspicious activity, gold is a different story entirely. Gold started out in May looking very weak, but has seen 4,542 contracts open and stand for immediate delivery mid-month. Ignoring the massive surge in March (probably attributable to the Ukraine conflict), this continues the upward trend that has been in place since May 2021.
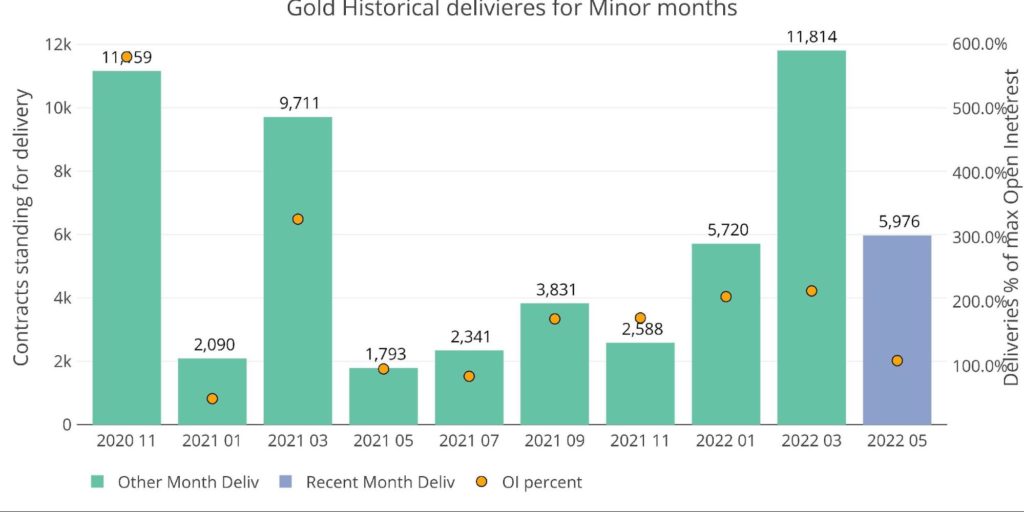
Figure: 8 Recent like-month delivery volume
As the delivery contract got started, only 1,721 contracts were set for delivery. This would have been the weakest month in 2 years. Instead, mid-month activity represented more than 2.5x the contracts outstanding to start the month.
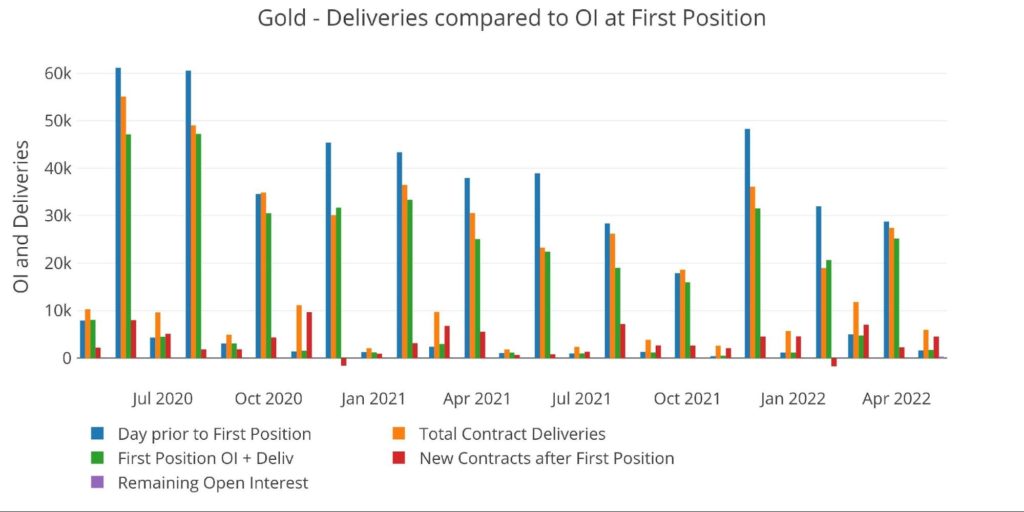
Figure: 9 24-month delivery and first notice
The chart below shows that the activity got started a little later in the month, but then ramped up quickly. Furthermore, the stock report shows that after taking delivery, investors were moving metal out of Registered and into Eligible.
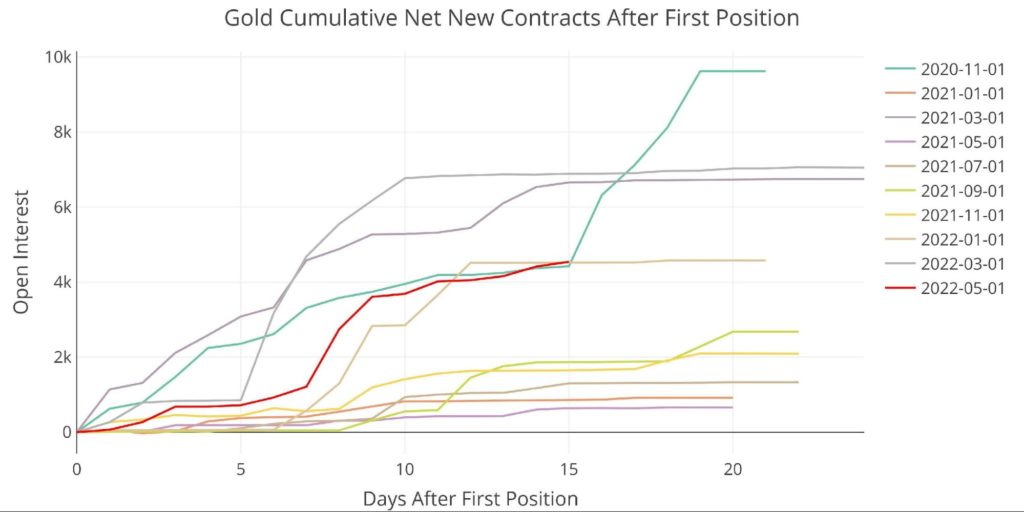
Figure: 10 Cumulative Net New Contracts
The banks are again net sellers this month as shown below. BofA is also suspiciously absent after being very busy the last 5 months.
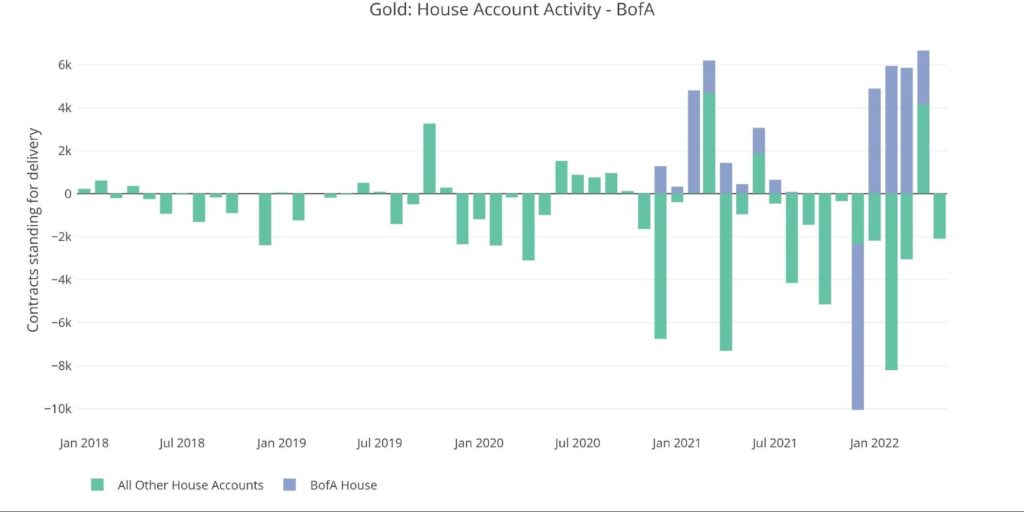
Figure: 11 House Account Activity
Looking at May historically shows that this month only trails May 2020 which is when delivery volume first notched up in a big way in response to Covid.
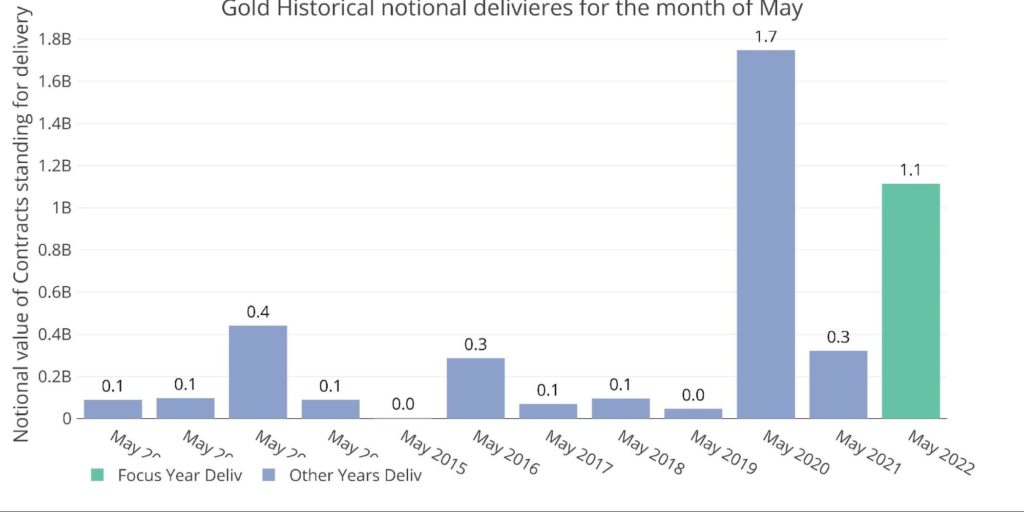
Figure: 12 Notional Deliveries
Gold: Next Delivery Month
While a lot can happen in 6 days, June is still looking quite strong. It is slightly below the last two Decembers and last June. It has lost some of the early strength it showed, but could still be setting up for a major delivery month.
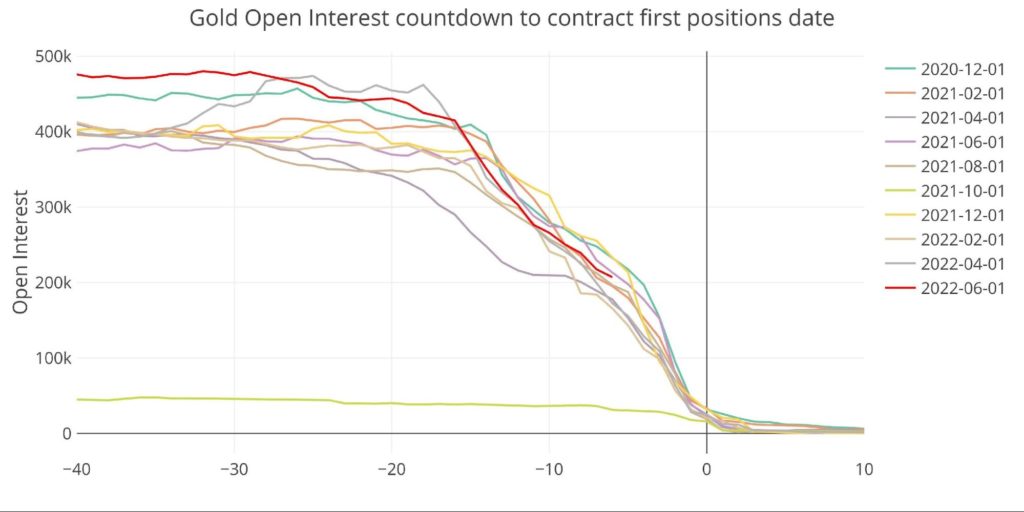
Figure: 13 Open Interest Countdown
It will be interesting to see if it can take out April, and possibly even December. Last June saw only 23,241 contracts stand for delivery. Hopefully, this June will beat out that number.
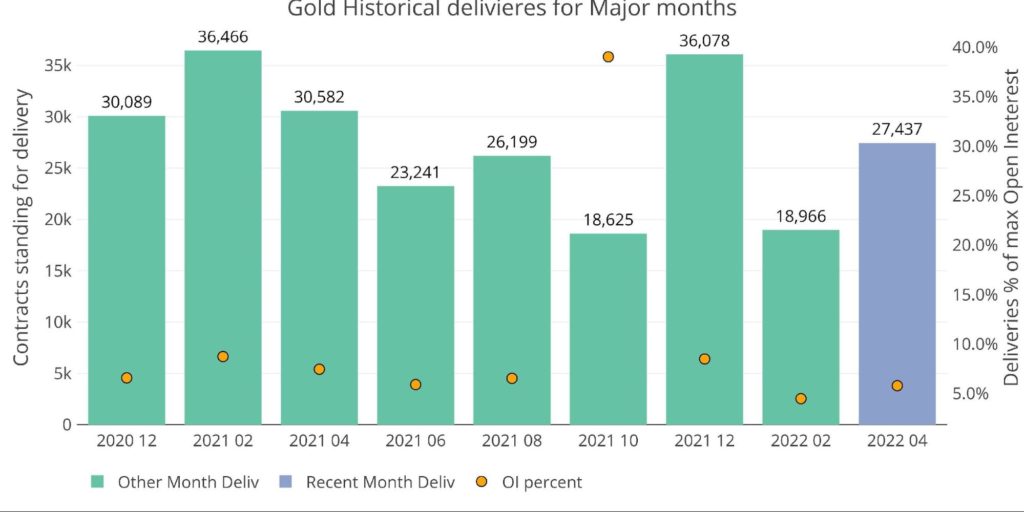
Figure: 14 Historical Deliveries
Another interesting data point is the Trade at Settlement activity. There is speculation that these trades are used specifically to keep a lid on gold prices. This month has again seen elevated volume of TAS trades.
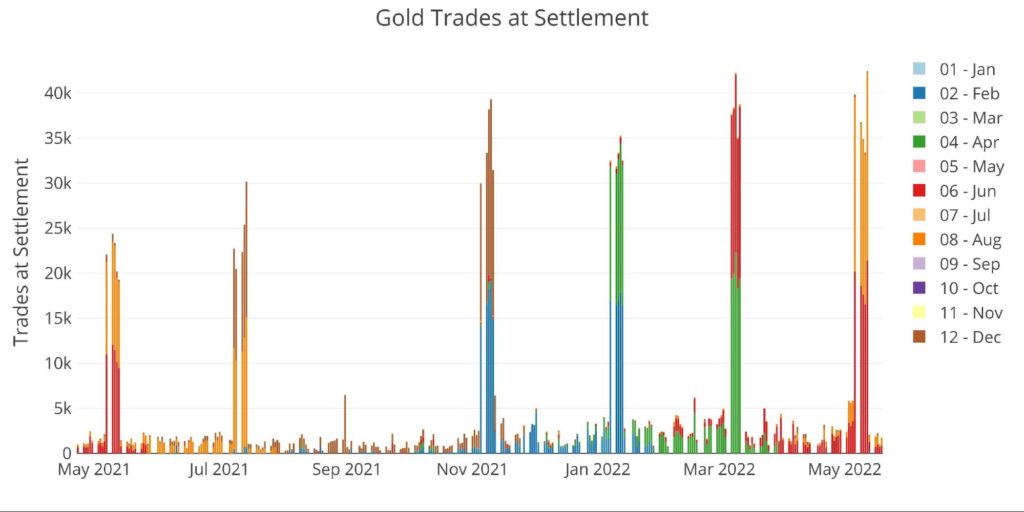
Figure: 15 Trades at Settlement
Spreads
One final indication of strength is the spread between June and August. It remains well above past months indicating that traders believe higher prices lie ahead. Furthermore, it increases the cost to roll contracts.
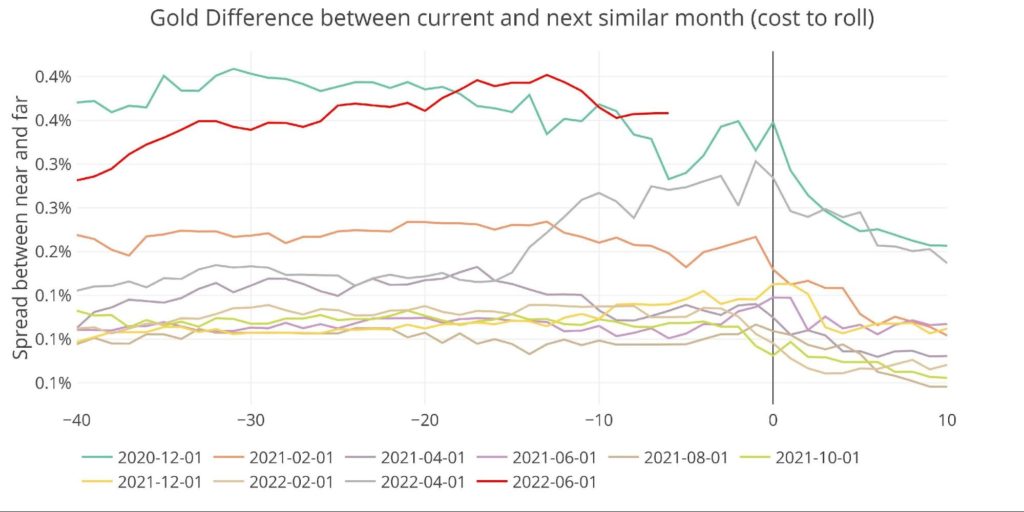
Figure: 16 Roll Cost
Wrapping up
Precious metal prices have been hammered over the past month as the market is still believing a Fed that is talking tough but doing nothing. It does appear that long-term investors who want physical delivery of metal have not lost sight of the bigger picture (at least in gold). Delivery volume continues to be strong.
June will be a great indication of the overall trend. It is a major month and investors have had time to digest the Ukrainian situation. If delivery activity stays elevated, it could signal that the real investors (those who want physical) are not buying the Fed’s bluff. Stay tuned!
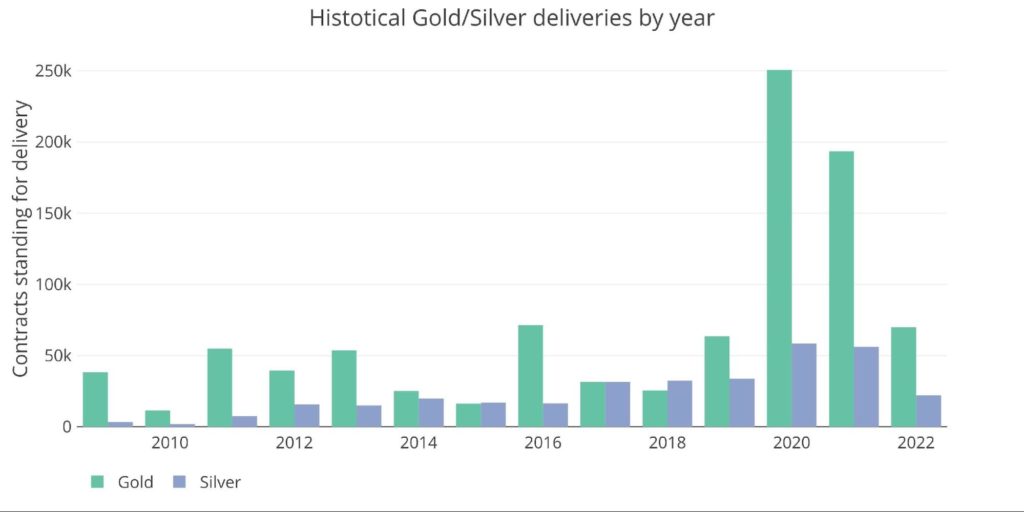
Figure: 17 Annual Deliveries
Data Source: https://www.cmegroup.com/
Data Updated: Nightly around 11 PM Eastern
Last Updated: May 19, 2022
Gold and Silver interactive charts and graphs can be found on the Exploring Finance dashboard: https://exploringfinance.shinyapps.io/goldsilver/

Call 1-888-GOLD-160 and speak with a Precious Metals Specialist today!
Buka akaun dagangan patuh syariah anda di Weltrade.
Source link