I have no interest whatsoever in shorting this market until we break down below that moving average.
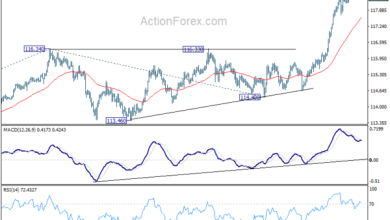
The FTSE 100 initially tried to rally during the day on Thursday but has run into a significant amount of resistance, right at an area that previously had shown it as well. The result was a significant breakdown that then sent the markets lower, reaching toward 7475. As an area that continues to be of interest, as the 7450 level had been both support and resistance recently. The market breaking through all of that could kick off a larger correction phase.
Keep in mind that the FTSE 100 is going to be heavily influenced by external markets, as risk appetite will run in the same general direction. The FTSE 100 has been very parabolic over the last couple of weeks, so a significant and sharp pullback would make quite a bit of sense. After all, sooner or later you need to acknowledge the existence of gravity.
The size of the candlestick is worth noting as well because it does completely engulfed and swallowed the previous candlestick. That is of course a very negative sign, so breaking down from here would make quite a bit of sense. On the other hand, if we turn around a break above the highs of the trading session on Thursday, that could kick off an attempt to recapture the 7600 level. Breaking above the 7600 level could be a major turn of events, as it would allow this market to go much higher.
Looking at this chart, at the very least one would think that a pullback makes sense due to the fact that we had gotten far ahead of ourselves. Any pullback could offer value, but I will wait for a pullback that shows signs of support on a daily candlestick to start trading this market. The last several candlesticks have all been very quiet as far as range is concerned, so it is worth noting that the candlestick for the Thursday session is much bigger than the previous seven or eight.
Ultimately, we could make a move towards the 50 Day EMA and still look relatively reasonably bullish. The market stain above that level is a very strong sign, and therefore I think would attract quite a bit of buying pressure. I have no interest whatsoever in shorting this market until we break down below that moving average.

Source link