US Dollar, NFP Talking Points:
- The US Dollar is at a big zone of long-term resistance after setting a fresh yearly high yesterday.
- Tomorrow brings Non-farm Payrolls out of the US and EUR/USD is the mirror image of USD at the moment, staring down a spot of long-term support. GBP/USD and AUD/USD, however, may offer some items of directional allure for traders looking at long or short-USD strategies.
- The analysis contained in article relies on price action and chart formations. To learn more about price action or chart patterns, check out our DailyFX Education section.
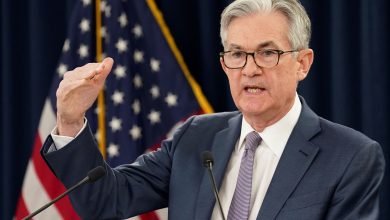
Markets remain in the grips of global conflict and that’s brought a number of uncertainties into the equation. Powell continued to talk up rate hikes at his appearance on Capitol Hill yesterday with a slightly softer tone and this helped equities to recover a bit.
Powell was abnormally to the point yesterday when he said he supported a 25 basis point hike at the rate decision in two weeks. But out the end of the year there’s still some considerable expectation for tightening, as the median expectation remains for six hikes by the end of 2022, and a 30% probability of at least seven hikes this year.
US Rate Hike Probabilities to the End of 2022
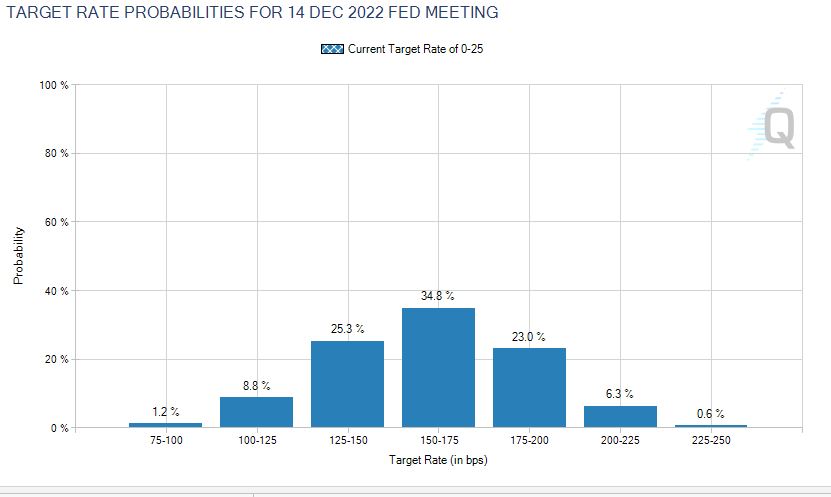
Chart prepared by James Stanley; Data from CME Fedwatch
Those odds still seem aggressively high to me, especially for a bank that’s been so incredibly careful with tightening in the past. Tomorrow brings the next piece of the puzzle with Non-farm Payrolls and the expectation for 400k jobs to have been added to U.S. payrolls in the month of February. The average hourly earnings component of the report will be especially important, as that signals wage growth and, in-turn, inflation. The expectation there is for 5.8% annualized, which remains well above the Fed’s inflationary target.
NFP Forecasts for Tomorrow
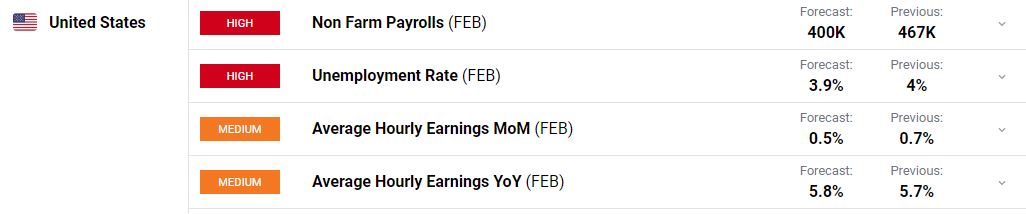
Chart prepared by James Stanley; data from DailyFX Economic Calendar
The US Dollar
The US Dollar has remained strong as the war bid has shifted the rates dynamic a bit. While the Euro was strong in early-February on hopes that the ECB may be turning a hawkish tide later this year, those expectations have largely diminished as the conflict in Ukraine has continued to step up. To be sure, inflationary forces are still showing in Europe but the slower growth than what’s shown in the U.S. make for a more problematic scenario around possible policy tightening.
The USD has run into a major area of loner-term resistance after setting another fresh yearly high this week. This zone runs from Fibonacci levels at 97.72 and 97.87.
US Dollar Weekly Price Chart
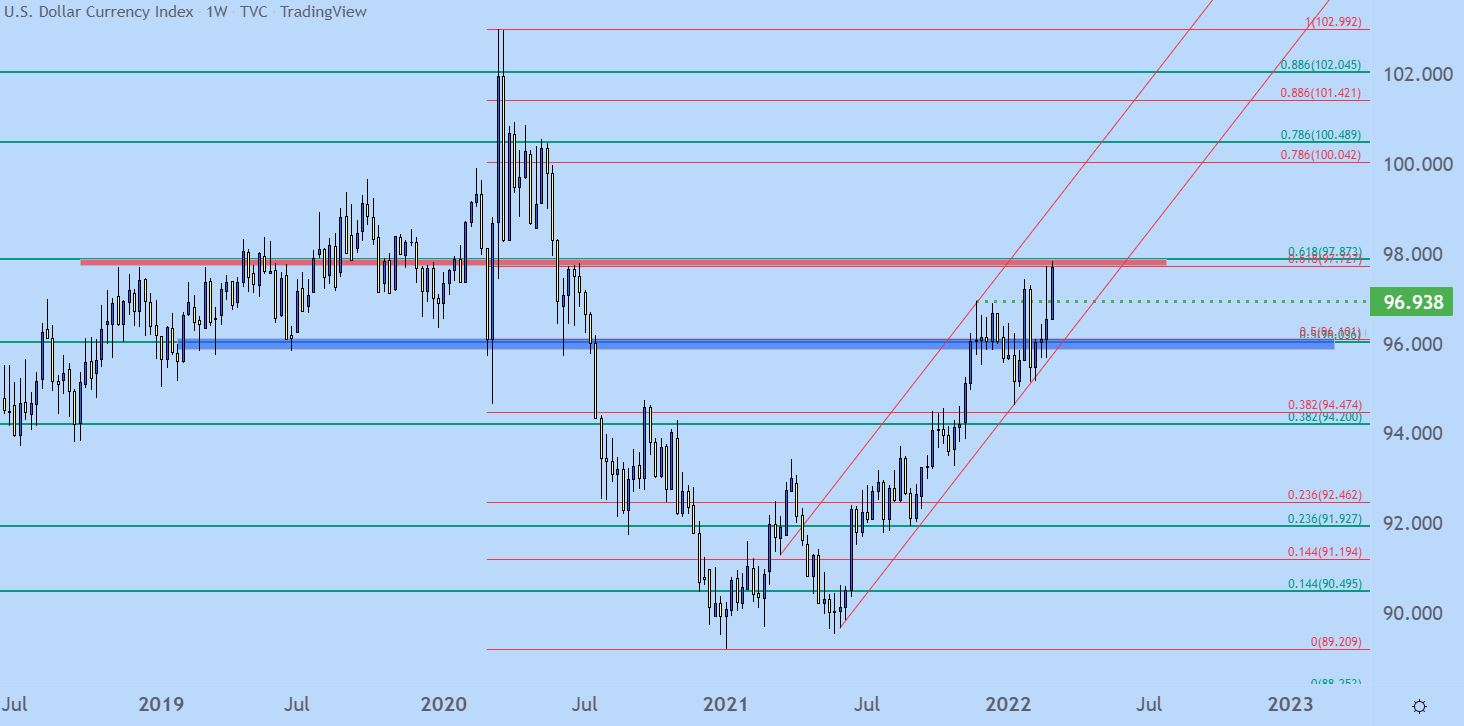
Chart prepared by James Stanley; USD, DXY on Tradingview
US Dollar Shorter-Term
On a shorter-term basis the USD has bullish breakout potential. That resistance started to come into play last week and initially led to a really strong reaction.
This zone came back into play yesterday and again, elicited a reaction albeit far more tame than what showed last week. And already this morning prices are making another move on this resistance, giving the appearance of bullish persistence.
This is setting up the logic of an ascending triangle formation which is often followed with the aim of bullish breakouts.
US Dollar Hourly Price Chart
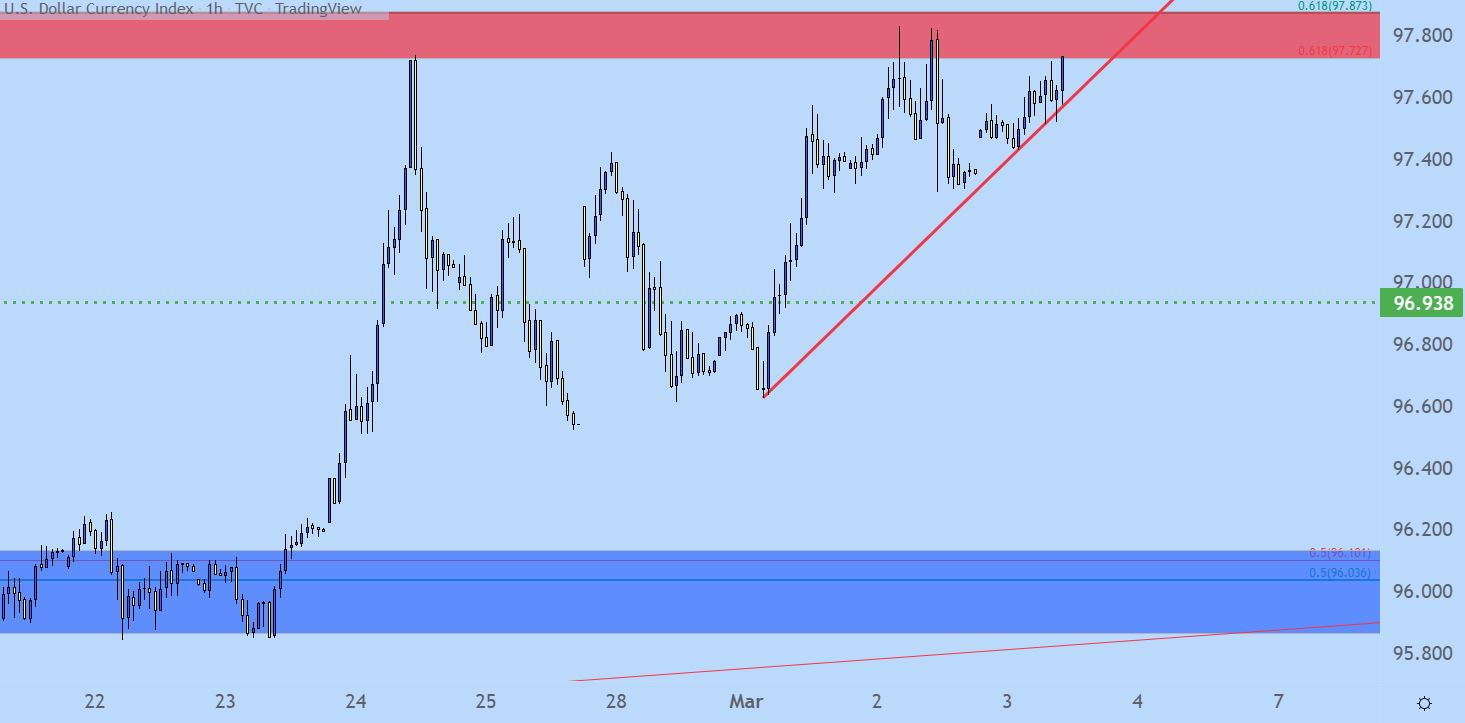
Chart prepared by James Stanley; USD, DXY on Tradingview
EUR/USD Nearing a Mass of Support
Longer-term EUR/USD is moving towards a big spot on the chart. I’m looking at the monthly below and there’s a long-term trendline that’s confluent with the major psychological level at 1.1000.
EUR/USD Monthly Price Chart
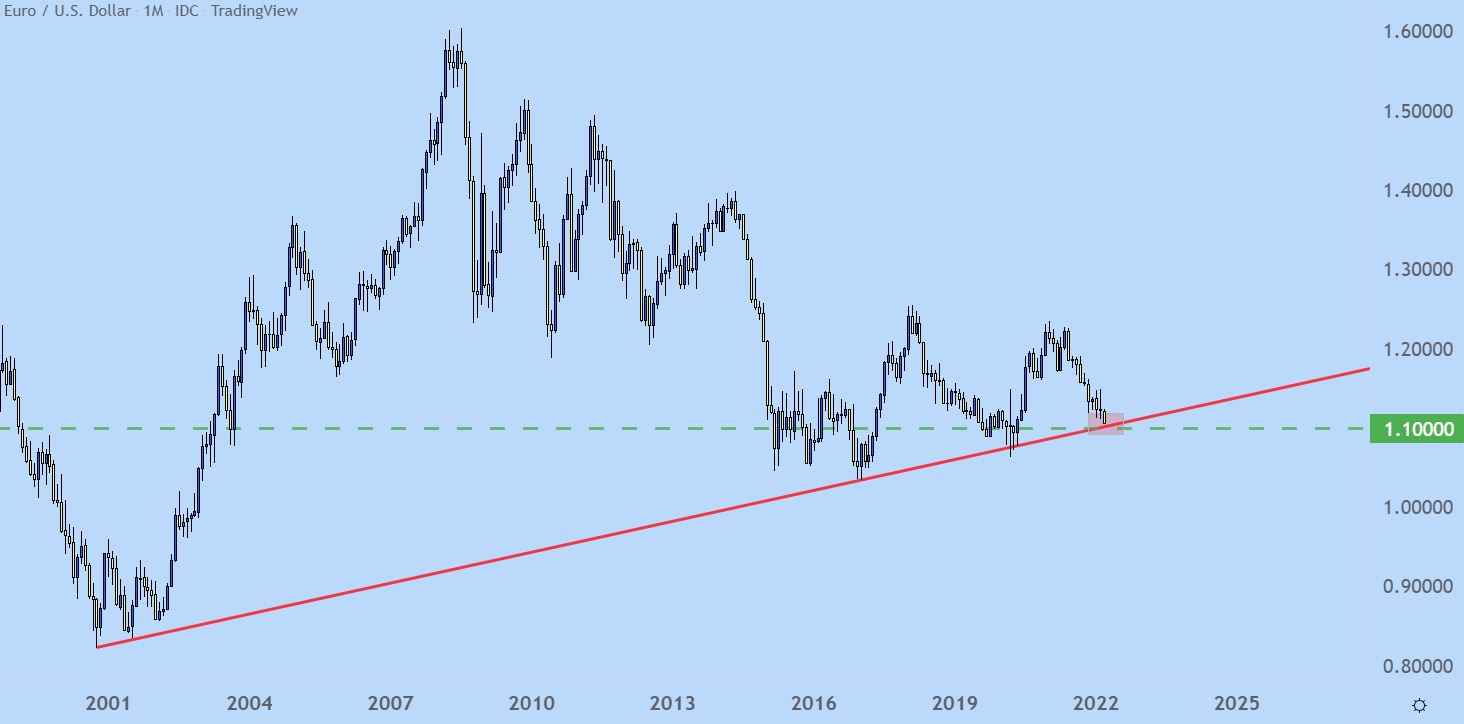
Chart prepared by James Stanley; EURUSD on Tradingview
EUR/USD May Break Before NFP
On the hourly chart of EUR/USD is a mirror image of the ascending triangle in the USD (descending triangle in EUR/USD) and this keeps the door open for short-term breakouts. And that could possibly lead to a test of that mass of support around 1.1000 ahead of tomorrow’s jobs report.
EUR/USD Hourly Price Chart
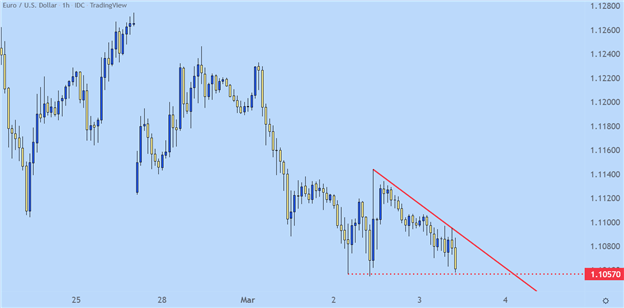
Chart prepared by James Stanley; EURUSD on Tradingview
GBP/USD Deeper Breakdown Potential
I’ve been tracking the short side of GBP/USD for bullish USD scenarios and the pair has started to show symptoms of breakdown over the past couple weeks. The notable item this week has been a breach of the 2020-2021 trendline as the pair pushed down to a fresh 2022 low.
Unlike EUR/USD above, the pair isn’t already very near a major spot of long-term support, so this may remain as an attractive venue for long-USD scenarios.
For support potential – there’s a major spot at 1.3167 that remains of interest.
GBP/USD Weekly Price Chart
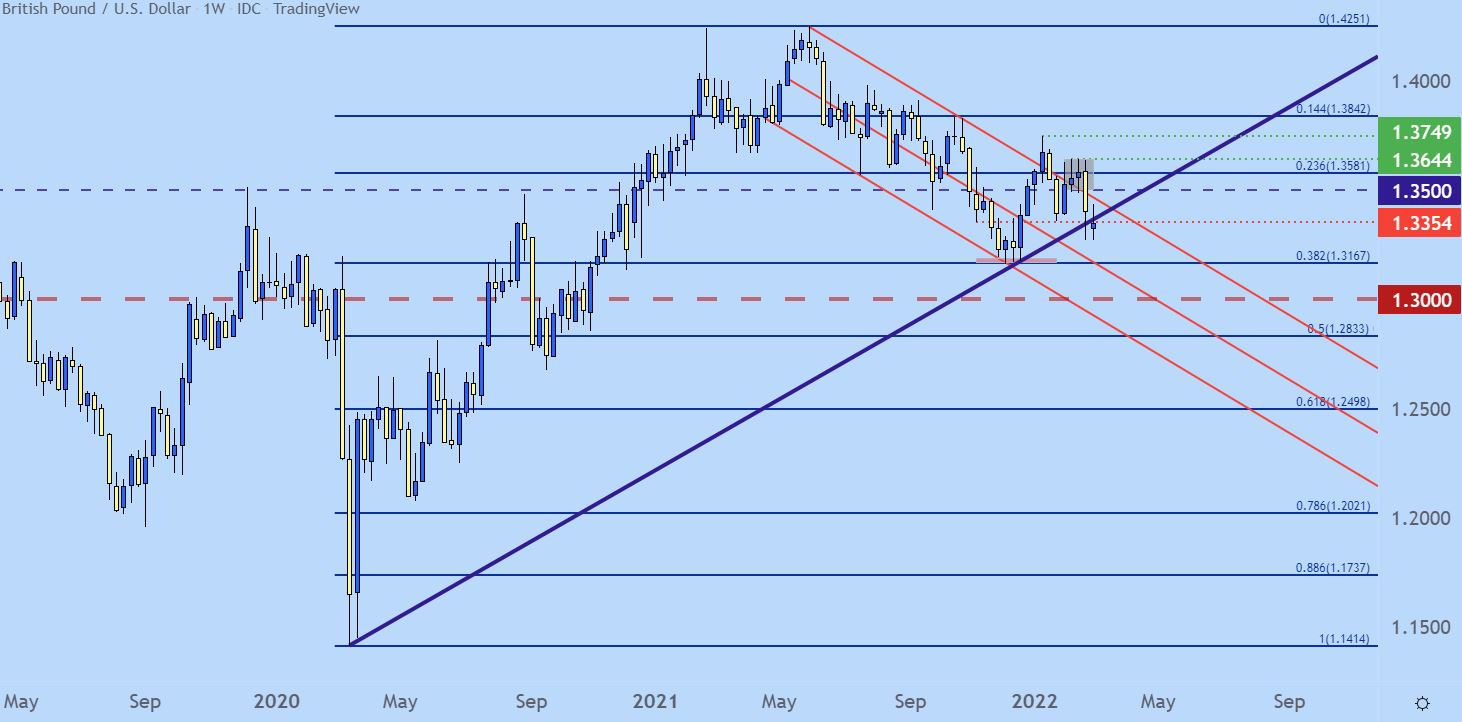
Chart prepared by James Stanley; GBPUSD on Tradingview
AUD/USD
On the short side of the USD I’ve been tracking AUD/USD, and that will likely remain. Even as the US Dollar is pushing up to a fresh yearly high, AUD/USD has been showing it’s own strength.
A falling wedge formation that built around the .7000 big fig has given way over the past two weeks and the pair is now trading at fresh three-month-highs.
The big item for this week was wedge resistance coming back in as support before the pair lifted to that fresh high, keeping the door open for further gains and if the USD does snap back, that could add an even stronger catalyst to the upside of this setup.
AUD/USD Weekly Price Chart
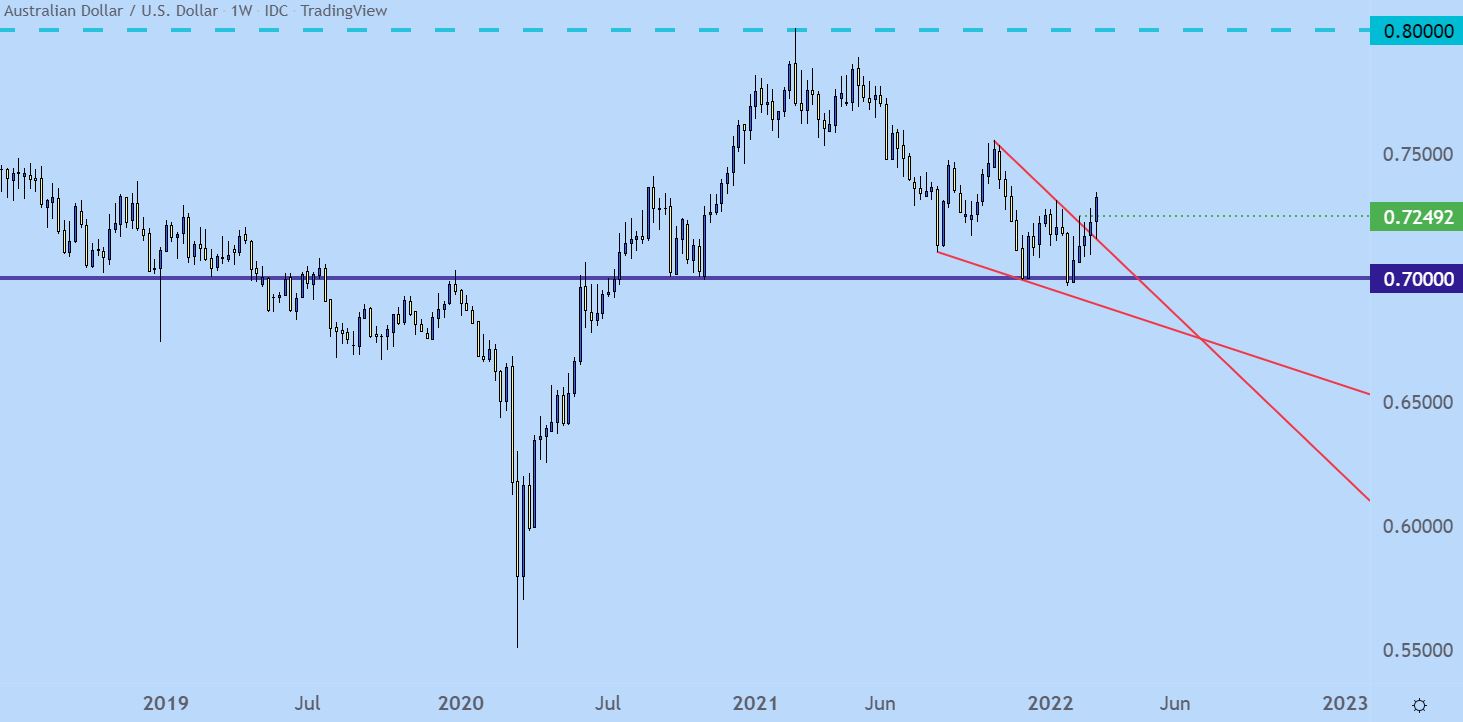
Chart prepared by James Stanley; AUDUSD on Tradingview
— Written by James Stanley, Senior Strategist for DailyFX.com
Contact and follow James on Twitter: @JStanleyFX
Buka akaun dagangan patuh syariah anda di Weltrade.
Source link